Repositório ISCTE-IUL
Deposited in Repositório ISCTE-IUL: 2019-04-01
Deposited version: Post-print
Peer-review status of attached file: Peer-reviewed
Citation for published item:
Guillamon-Saorin, E., Isidro, H. & Marques, A. (2017). Impression management and non-GAAP disclosure in earnings announcements. Journal of Business Finance and Accounting. 44 (3-4), 448-479
Further information on publisher's website: 10.1111/jbfa.12238
Publisher's copyright statement:
This is the peer reviewed version of the following article: Guillamon-Saorin, E., Isidro, H. & Marques, A. (2017). Impression management and non-GAAP disclosure in earnings announcements. Journal of Business Finance and Accounting. 44 (3-4), 448-479, which has been published in final form at https://dx.doi.org/10.1111/jbfa.12238. This article may be used for non-commercial purposes in accordance with the Publisher's Terms and Conditions for self-archiving.
Use policy
Creative Commons CC BY 4.0
The full-text may be used and/or reproduced, and given to third parties in any format or medium, without prior permission or charge, for personal research or study, educational, or not-for-profit purposes provided that:
• a full bibliographic reference is made to the original source • a link is made to the metadata record in the Repository • the full-text is not changed in any way
The full-text must not be sold in any format or medium without the formal permission of the copyright holders. Serviços de Informação e Documentação, Instituto Universitário de Lisboa (ISCTE-IUL)
Av. das Forças Armadas, Edifício II, 1649-026 Lisboa Portugal Phone: +(351) 217 903 024 | e-mail: [email protected]
Impression Management and Non-GAAP Disclosure in Earnings Announcements*
ENCARNA GUILLAMON-SAORIN, Universidad Carlos III de Madrid, [email protected] HELENA ISIDRO, Instituto Universitário de Lisboa (ISCTE-IUL), Lisboa, Portugal,
ANA MARQUES, Nova School of Business and Economics & Indian Institute of Management
Bangalore, [email protected] 1
November 2016
* The authors appreciate the valuable comments received from Ted Christensen, Stephen Taylor, Yinglei Zhang, Francesco Bova, Beatriz Garcia, Ross Jennings, Elmar Venter, as well as those received from the participants at the 2016 Journal of Business Finance and Accounting Conference, the 2015 UTS Summer Accounting Conference, the 2014 Mid-year meeting of the International Accounting Section of AAA, the 2013 Chulalongkorn Accounting and Finance Symposium, the 2013 Conference of the University of Miami, the EAA 2012 annual meeting, the IX Workshop on empirical research in financial accounting, Nova School of Business and Economics, Grenoble Ecole de Management, Bristol University, Durham University, Universidad de Navarra, Cass Business School, Bangor University, Indian Institute of Management Bangalore, and University of Auckland. We thank António Miguel for providing us with data on international risk factors. This study was supported by the Foundation for Science and Technology in Portugal (grant PTDC/EGE-GES/103770/2008). Encarna Guillamon-Saorin acknowledges financial contribution from the Spanish Ministry of Science and Innovation (SEJ2007-67582-C02-02/ECON, ECO2010-19314), Ministerio de Economia y Competitividad (2014/00452/001) and Comunidad Autonoma de Madrid (SEJ2008-00059-003). Ana Marques also acknowledges financial support received from Nova Forum. We are grateful for the excellent research assistance of Arash Aloosh and Luís Araújo.
1 Corresponding author’s address: IIMB, Bannerghatta Road, Bengaluru 560076, India. Tel:
1
Impression Management and Non-GAAP Disclosure in Earnings Announcements
Abstract
We study the market reaction to the disclosure of non-GAAP earnings measures that are combined with high impression management. We construct an impression management score that includes several communication techniques that managers often use to positively bias investors’ perceptions of firm’s performance. We hand-collect and code quantitative and qualitative information from earnings announcement press releases of large European firms. Our results indicate that non-GAAP measures are informative to capital markets. However, non-GAAP adjustments are more persistent when accompanied by higher levels of impression management. This evidence is consistent with managers trying to distort users’ perceptions when non-GAAP adjustments are of lower quality. Market reaction tests suggest that investors are able to see through managers’ intentions and ignore non-GAAP information that is accompanied by high impression management. Moreover, investors in sophisticated markets penalize non-GAAP measures communicated with high impression management. Our results are robust to a battery of sensitivity tests, including using a machine-coded tone measure.
Keywords: pro forma earnings; alternative performance measures; street earnings;
I. INTRODUCTION
Non-GAAP measures can be disclosed to inform capital markets about recurring performance or to portray a firm’s performance in an optimistic manner, a practice that may mislead investors. We study the disclosure of non-GAAP earnings measures that are accompanied by impression management
communication techniques, and explore how this varies across institutional environments. Impression management is a process in which managers select and present information, either qualitative or quantitative, in a way that distorts users’ perceptions of corporate achievements (Neu et al., 1998).
Our results indicate that non-GAAP measures are informative to capital markets. However, we find evidence consistent with managers using high levels of impression management to mask the recurring nature of some non-GAAP adjustments. We also find that investors perceive this combination to be strategic and penalize firms for this behavior. Thus, while there is a positive market reaction to non-GAAP adjustments, on average, investors ignore the adjustments that are accompanied by high
impression management. The country-level results suggest that this reaction is more pronounced in environments with a stronger presence of sophisticated financial statement users (institutional investors and financial analysts), and stronger investor protection.
Since markets value persistent earnings (Collins and Kothari, 1989), firms have incentives to separate permanent and transitory earnings components. However, earnings measurement and disclosure is constrained by GAAP and subject to monitoring. In their search for more flexible ways to convey information about earnings persistence managers have turned to voluntarily disclose non-GAAP in earnings press releases. Prior research suggests that investors perceive non-GAAP earnings to be informative (Bhattacharya et al., 2003; Bradshaw and Sloan, 2002), but expresses concerns about the possibility of strategic disclosure to positively bias investors’ perceptions (Andersson and Hellman, 2007; Bhattacharya et al., 2007; Cormier et al., 2011). Therefore, the challenge for investors and regulators is to
3 allow management freedom to use non-GAAP earnings to communicate key earnings components while simultaneously limiting opportunistic management of GAAP earnings (Young, 2014).
In contrast to the US where regulation constrains non-GAAP disclosure, in Europe non-GAAP disclosure is virtually unregulated. In addition, capital markets and institutional mechanisms are less developed in Europe than in the US, suggesting that the potential for these disclosures to mislead investors can be high. The European Financial Reporting Advisory Group, an organization which provides the European Commission with technical advice on accounting matters,has stressed that non-GAAP disclosures of large European firms are inconsistent and obscure (EFRAG, 2009). Consistent with these concerns, the European Securities and Markets Authority recently published a set of guidelines for the disclosure of non-GAAP measures (ESMA, 2015).
While non-GAAP earnings be used to manage investors’ perceptions, they are not the only communication tool available to managers.Earnings press releases offer great flexibility regarding both the format and the style of the message.1 Previous studies, examining the location of non-GAAP earnings in press releases, find that firms commonly place non-GAAP earnings more prominently than GAAP measures, and that the higher relative emphasis affects the judgements of some investors (Allee et al., 2007; Bowen et al., 2005; Elliott, 2006; Isidro and Marques, 2015). We extend these results by examining multiple communication strategies, which we refer to as impression management techniques. Thus, we provide a comprehensive analysis, considering that investors’ reactions may be affected by(1) the use of
1 Press releases are widely used by the business community and offer ample opportunity for discretionary disclosures. Prior
research finds evidence of strategic use of communication techniques, such as positive language tone, to influence investors’ perceptions about firm performance (Huang et al., 2014; Lang and Lundholm, 2000). Prior studies also find the use of impression management to be associated with other strategic behaviour, such as earnings management (Aerts and Cheng, 2011; Godfrey et al., 2003).
4 positive tone; (2) the emphasis given to non-GAAP measures, and (3) the use of performance comparisons (selecting benchmarks that give the impression of performance achievement). We consider emphasis in terms of (i) location of the measure in the press release, (ii) the repetition of non-GAAP information, and (iii) the reinforcement of keywords. We use content analysis to construct a firm-year score of impression management related to non-GAAP disclosures.
Whether or not investors perceive the combination of the impression management with non-GAAP disclosures to be misleading is an important empirical question. If European investors are capable of recognizing this type of disclosure, then strict regulation, which is costly to design and to enforce, may not be necessary. We hand-collect data and hand-code non-GAAP and impression management practices from the first two sections of firms’ earnings announcements press releases. This focus is consistent with Entwistle et al. (2006), who state that the headline is “the portion of the press release with highest profile, the language which is first read and which tends to be picked up by the financial press and newswire”.
In the spirit of Frankel et al. (2011) and Jennings and Marques (2011) we analyze the cross-sectional variation in the persistence of non-GAAP adjustments to make inferences about informative versus opportunistic intentions. Consistent with these studies, we find that the non-GAAP adjustments made by large European firms are generally recurring in nature. We extend literature by documenting that non-GAAP adjustments that are accompanied by high impression management are more persistent (i.e., of lower quality).
5 Our first hypothesis explores whether investors’ reaction to non-GAAP disclosures around the earnings announcement date varies with the level of impression management.2 In line with prior studies, which mostly use US data, we find an overallpositive market response to non-GAAP disclosures.
However, investors ignore non-GAAP disclosures that are accompanied by high impression management. This result suggests that investors interpret the combination of the two disclosure tools as a possible managerial attempt to mask the persistence of the non-GAAP adjustments made.This evidence is in line with prior findings that investors react to the tone of managers’ communications (Baginski et al., 2011; Davis et al., 2012; Demers and Vega, 2011), but that they are capable of detecting strategic
communication (Barton and Mercer, 2005; Huang et al., 2014). Another important result is that the market reaction is not limited to language tone. We find a similar market reaction to other communication techniques, such as emphasis and performance comparisons.3
This evidence begs the question of why investors in European markets are able to “see through” firms’ disclosure strategy, while results for the US suggest that unsophisticated investors are not able to do so. Although our measure of emphasis is not directly comparable with the measure of emphasis used in US studies, we discuss three possible explanations: (i) there are more sophisticated investors in European capital markets than in the US, (ii) investors are more familiar with non-GAAP disclosures in
2
One could argue that, given the difficulty of identifying who writes the press release (Garcia Osma and Guillamon-Saorin, 2011; Merkl-Davies and Brennan, 2007), it is unlikely that the person preparing the press release is the same person who determines the non-GAAP exclusions and its presentation in the press release. The contra argument is that the manager is the person accountable for the content of the press release. Given the lack of evidence in the literature, we can assume that the quality of firm communication is an equilibrium outcome (Ball, 2006), which implies consistent quality levels across the range of reported information prepared within a firm, regardless of the number of partiesinvolved (Gronstedt, 1996). This leads to the general expectation that impression management and non-GAAP information are positively associated.
3 Prior research for the US shows that investors are sensitive to the location of non-GAAP measures, when compared with the
location of GAAP figures, and that location can be used strategically by managers (Elliott, 2006). This measure is referred to as “relative emphasis” in Bowen et al. (2005). Our measure is more comprehensive than the ones used before, as it includes not only location but also repetition and reinforcement (See Figure 1).
6 Europe than in the US, and (iii) there has been a learning effect through time, as discussion on
non-GAAP in Europe has increased recently.
We subsequently evaluate the extent to which countries’ institutional and market conditions influence investors’ reaction to the combination of non-GAAP disclosure and high impression
management. International research documents that institutional and economic factors such as the level of investors’ protection, the quality of enforcement mechanisms, and the sophistication of market
participants affect reporting transparency (Bushman et al., 2004; Holthausen, 2009; Lang et al., 2012). In these settings, investors are also more likely to have the means to perceive and discount aggressive disclosures in these environments. We find that the market reaction to the combination of non-GAAP disclosures with high impression management is statistically negative in countries with more
sophisticated market participants (i.e. financial analysts and institutional investors), and stronger investor protection. These results suggest that while the investors in more sophisticated markets penalize the non-GAAP adjustments surrounded by high impression management (maybe understanding the persistence of the adjustments made), investors in less-sophisticated markets do not react to these adjustments (maybe perceiving them as cheap talk).Our resultsare robust to self-selection bias.
This study contributes to the voluntary disclosure literature in three ways. First, it indicates that managers complement disclosures of non-GAAP financial measures with impression management techniques. While prior research studies on management communication focus mostly on language tone, we investigate a wide range of impression management techniques, related to qualitative and quantitative information, and assess the market reaction to the combination of these techniques with non-GAAP disclosures. Second, we provide evidence that investors’ reaction to the disclosure of non-GAAP earnings with high impression management varies with institutional and economic conditions. Third, we provide
7 some useful insights for European regulators, since the recent guidelines do not apply to press releases. The design of a regulatory solution can take into account the fact that markets seem to be able to identify certain strategic non-GAAP disclosures, particularly sophisticated markets.
II. BACKGROUND AND HYPOTHESES DEVELOPMENT
Investors use earnings information to predict future earnings and future returns. The accuracy of these predictions depends on earnings persistence, and prior research suggests that market participants reward persistence (Collins and Kothari, 1989). The possibility of market rewards, as well as reputation and compensation motives, gives managers’ incentives to provide investors self-constructed earnings measures that exclude transitory items from GAAP earnings. Consistent with this idea, prior research reports that investors perceive non-GAAP performance measures to be more informative about future earnings than GAAP earnings, both in the US (Bhattacharya et al., 2003; Bradshaw and Sloan, 2002), and in the UK (Lin and Walker, 2000; Choi et al., 2007).4
Because non-GAAP earnings disclosures are not regulated in Europe, and are based mostly on the exclusion of expenses, there is a greater potential for investor misleading in Europe than in the US. While some managers may adjust GAAP earnings to provide a better measure of permanent earnings, others may exclude recurring items in an attempt to enhance investors’ perceptions of the persistence of firm’s profitability. Whether or not the users of non-GAAP information can see through managers’ strategic disclosures depends upon their knowledge and ability to detect them (Christensen et al., 2014).
4 The UK is a special case in Europe, because its Financial Reporting Standard 3 permits UK firms to report non-GAAP EPS
numbers in the face of the income statement. To ensure transparency, firms are required to reconcile these numbers to the GAAP figure.
8 Andersson and Hellman’s (2007) experimental evidence in an European context suggests that even financial analysts can be misled by non-GAAP disclosures. European markets are typically viewed as having weaker investor protection, and poorer enforcement quality than US markets (La Porta et al., 2006). These conditions may prompt more aggressive non-GAAP reporting. Accordingly, it is not clear,
ex ante, that investors will be able to detect impression management ploys and appropriately discount the non-GAAP adjustments. We examine this important question.
We predict that managers use impression management techniques, a cosmetic disclosure tool involving potentially several practices that can distort investors’ perceptions of firms’ performance(such as disclosure tone effects, strategic presentation of performance comparisons, or strategic emphasis), to hide the recurring nature of certain non-GAAP adjustments. Frankel et al. (2011) and Jennings and Marques (2011) argue that if the excluded items are purely transitory, their persistence should be close to zero, consistent with managers’ claims that the adjustments are informative. On the contrary, evidence that managers adjust for recurring earnings components signals managers’ purpose is not to inform, but rather to alter investors’ perception of firm performance. We contend that when managers exclude recurring expenses they use impression management in their earnings communications to persuade investors that the non-GAAP figures represent persistent earnings better than GAAP earnings.
Our argument of strategic disclosure is in line with thegrowing evidence on the use of impression management practices in earnings announcement press releases, such as language tone, to influence users’ perceptions of firm performance (e.g. Huang et al., 2014; Sadique et al., 2008; Tan et al., 2014). However, tone is just one of several impression management techniques. Earlier studies find that US firms with less value-relevant GAAP earnings disclose non-GAAP measures before the GAAP figures (Bowen et al., 2005), and that giving more emphasis to GAAP than GAAP can affect
non-9 professional investors’ judgements (Elliott, 2006; Allee et al., 2007). A recent study indicates that
European firms commonly disclose non-GAAP measures before the GAAP figures in press releases (Isidro and Marques, 2015).Thus, we anticipate that managers may use several impression management techniques to communicate non-GAAP information (Bowen et al., 2005; Garcia Osma and Guillamon-Saorin, 2011; Huang et al., 2013; Lewellen et al., 1996; Schrand and Walther, 2000). To capture various communication techniques, we create an impression management score associated with non-GAAP measures that contains both quantitative and qualitative information.5 If managers use impression management to enhance the creditability of their non-GAAP earnings measures and to obscure the recurring nature of their adjustments then the impression management score will be greater when managers’ non-GAAP adjustments are more persistent.
Several empirical studies document the capital market effects of manager communication practices such as disclosure tone (Baginski et al., 2011; Davis and Tama-Sweet, 2012). The fact that investors incorporate tone in their stock valuations is not the same as saying that they are not aware of self-serving management communications tactics. “Cheap talk” models predict that corporate
communication is costless, non-binding, and unverifiable, and therefore ignored by investors (Bhattacharya and Krishnan, 1999; Crawford and Sobel, 1982). Evidence consistent with both the informational and “cheap talk” arguments suggests that investors are capable of distinguishing between more- and less-credible messages (Barton and Mercer, 2005; Tan et al., 2014). This evidence suggests that investors can penalize firms when they perceive that managers use the discretion allowed in
5 Qualitative information is subject to interpretation by readers and can be easily biased (Behn and Vaupel, 1982). For this
reason, managers who intend to persuade users to embrace a certain belief are likely to make more use of qualitative disclosures. Quantitative disclosures, on the other hand, are more precise and can be verified ex-post (Healy and Palepu, 2001), but they can also be biased by managers through presentation techniques. For these reasons, a combination of both qualitative and quantitative information, which yields a more comprehensive score, is used in our study.
10 corporate communications to overstate performance. If investors respond similarly in the case of non-GAAP disclosures then they will interpret non-non-GAAP measures communicated in combination with high impression management as an attempt to portray recurring expenses as transitory expenses. As a result, we should observe a negative market reaction to non-GAAP earnings disclosures with high impression management, assuming that lower quality exclusions are associated with higher impression management. On the other hand, if market participants are not able to see through the strategic combination of the two disclosure mechanisms, then there will be no difference in the reaction to non-GAAP information with higher or with lower impression management. We state our first hypothesis in the alternative form as follows:
HYPOTHESIS 1:Investors react differently to non-GAAP disclosures that are combined with high
impression management in earnings announcements.
European markets are characterized by wide variation in (i) market sophistication, (ii) regulation, and (iii) enforcement (Bushman et al., 2004; La Porta et al., 2006). Isidro and Marques (2015) show that country-level institutional conditions affect non-GAAP disclosure practices, when the GAAP figure misses an earnings benchmark.Thus, it is possible that the market response to non-GAAP disclosures combined with high impression management varies across market characteristics.
We focus on two important country characteristics: (1) market’s sophistication and (2) strength of regulation aimed at protecting minority investors. A higher level of overall market sophistication should be associated with a richer information environment and a better understanding of managers’ strategic choices. Sophisticated users, such as analysts and institutional investors, collectively produce, gather, validate, and disseminate information to the market. These activities result in improvements in corporate transparency and in information environment (Bushman et al., 2004). Hence, we anticipate that investors
11 are more likely to perceive the combination of non-GAAP figures with high impression management as a strategic disclosure tactic in sophisticated markets. If investors discount managers’ non-GAAP
adjustments with high impression management, then we expect the discount to be stronger in countries with a higher presence of sophisticated market participants. We expect a similar effect in a setting where enforcement of investor protection against self-dealing by the controlling shareholder is stronger. Both a desirable regulation and an efficient enforcement mechanism seem to be necessary for the development of capital markets and for the improvement in managers’ reporting practices (Holthausen, 2009).
Following these arguments, we state our second hypothesis as follows:
HYPOTHESIS 2:If investors react to the combination of non-GAAP disclosures and high
impression management in earnings announcements negatively, this reaction is more negative in countries with more sophisticated users and stronger enforcement.
III. SAMPLE SELECTION AND HAND-COLLECTION OF DATA
Our initial sample comprises all industrial firms included in the Financial Times 2006
classification of the 500 largest European companies. This sample allows us to study a group of firms representing a considerable portion of European capital markets, and to investigate the effects of cross-country variation in market conditions in a setting where the effects of managers’ disclosure practices can have a great impact.
Our main source of data is the earnings announcement press releases obtained from the
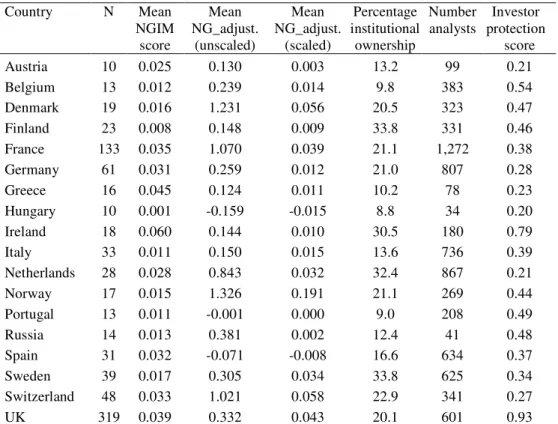
12 possible problems of incorrect translation.6 After eliminating observations for which we are unable to find press releases, our potential sample consists of 2,212 firm-year observations, covering fiscal years 2003 to 2009. We then exclude 436 press releases (20%) that do not include non-GAAP measures. We code non-GAAP measures and impression management techniques related to these measures, when they are located in the first two sections of the press release. These sections are considered the most prominent locations where managers are likely to create a “first positive impression” by emphasizing good news (Guillamon-Saorin et al., 2012; Huang et al., 2013). The focus on these sections leads to the elimination of 170 observations which disclose non-GAAP measures, but not in the prominent sections of the press release.7 We obtain data on financial items and market returns from Thomson Reuters Datastream and data on analysts’ forecasts from I/B/E/S. Country-level factors are from published sources. After eliminating observations with missing values and observations from countries with less than ten firm-years, we end up with 845 observations corresponding to 243 firms (Table 1).
Non-GAAP earnings measures
We hand-collect and code the type and the value of non-GAAP measures included in annual earnings announcement press releases. We compare non-GAAP earnings with GAAP earnings reported in the financial statements to calculate the value of the adjustments made by managers. Based on the
categories of non-GAAP measures identified in earlier literature, we code the following non-GAAP
6 In the cases where firms disclosed two versions of the press release, one in English and one in the company’s local-language,
we analyzed the English version. However, given that these are the largest European companies that operate internationally, we believe the companies would make sure that their foreign investors would have an accurate press release. Thus, we do not expect that differences between the local language and English impact in our results. To ensure that language issues do not change our results we repeat the analysis for the UK firms only. Our conclusions do not change.
7 Because this sample selection choice can tilt our sample towards firms that are more aggressive in their disclosure strategies,
we repeat our tests including the 170 observations and assuming that impression management is zero (i.e. adding non-aggressive firms). Our results do not change.
13 earnings measures: (i) non-GAAP earnings per share, (ii) non-GAAP from continuing operations per share, (iii) non-GAAP net income, (iv) non-GAAP income from continuing operations, and (v) adjusted versions of EBITDA and EBIT. We do not collect non-GAAP cash measures, adjusted values for sales, or ratios.
We exclude non-GAAP financial measures with ambiguous labels and non-GAAP measures that are commonly used by the accounting and finance community (such as EBITDA and EBIT) because they can be viewed by capital market participants as GAAP measures. Unlike the situation in the US, in some European countries national accounting standards establish a defined format for the income statement, which includes subtotals as EBITDA and EBIT. That practice continued even after the introduction of IFRS. The measures studied in this paper are usually labeled in the press releases as “adjusted net income”, “net income excluding…”, and “adjusted earnings per share”.
Measuring impression management
We perform a manual content analysis to obtain a score for impression management related to the non-GAAP figures. Although potentially subjective, manual content analysis offers great flexibility to collect in detail a diverse range of practices that cannot be captured by computer-aid techniques (Li, 2010; Linderman, 2001). For example, it is not possible to code performance comparisons using machine-based methods. Most textual analysis papers using machine-machine-based methods focus mainly on generic features of narrative disclosures such as length, tone, or readability. Furthermore, research using computer-aided methods to investigate the tone of the announcement rely on pre-specified wordlists, which does not consider the fact that managers are likely to use a combined range of disclosure practices to impress users (Davis et al., 2012; Rogers et al., 2011).
14 To code the impression management in each earnings announcement we follow the schema
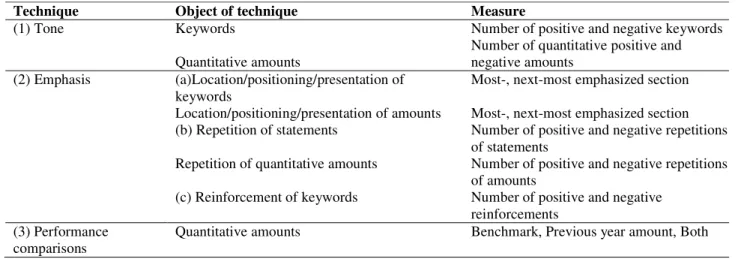
developed by Brennan et al. (2009) and empirically tested by Garcia Osma and Guillamon-Saorin (2011). We analyze the three impression management disclosure techniques described below.8
(1) Tone consists of using positive language, keywords, statements, or numerical amounts to create a positive image of corporate results that would not be achieved using more neutral statements. Our analysis of tone is based on qualitative and quantitative information related to non-GAAP figures. We categorize keywords as positive or negative based on a list of keywords (Abrahamson and Amir, 1996; Abrahamson and Park, 1994; Clatworthy and Jones, 2003) customized to include other keywords that appear in the press releases. For example, in “2003 net income adjusted for special items shows strong increase: +17% to 7.34 billion for results in euro” (Total, press release 2003), “increase” is coded as a positive keyword related to a GAAP figure. We further classify all non-GAAP amounts included in the most- and next-most emphasized sections of earnings press releases as positive (negative) if current year amount is higher (lower) than previous year or if it is explicitly stated as positive or negative. In Total’s press release, income adjusted for special items is explicitly stated as positive and therefore coded as positive non-GAAP amount.
(2) Emphasis consists of making a particular piece of information more obvious to the reader by using three strategies: (a) placing the information strategically in the press release (emphasis by location), (b) repeating the same piece of information in the press release (emphasis by repetition), and (c) reinforcing keywords by adding a qualifier to emphasize their connotation (emphasis by
8 One of the measures of impression managements in prior literature is selectivity which is based on the selection of figures
from the financial statements to be included in the narratives of corporate disclosures such as earnings announcement press releases (Brennan et al. 2009). We do not consider selectivity as non-GAAP measures are not part of financial statements.
15 reinforcement).9 In Total’s 2003 press release, for example, the net income adjusted for special items is located in the highlights and repeated again in the main text. This practice is coded as a repetition of a positive non-GAAP amount.10 Moreover, the word “strong” is coded as a positive reinforcement because it enhances the positive connotation of the positive keyword “increase”.
(3) Performance comparisons relates to managers’ decisions to include a benchmark to compare with current year figures depending on the firm performance. Firms may also choose a benchmark strategically to show positive rather than negative changes. In Total’s 2003 press release the
percentage “17%” is considered and coded as a reinforcement of the current year non-GAAP amount (7.34 billion).
Based on the three impression management practices described here, we calculate an impression management score (NGIM). Figure 1 explains the methods followed to code and analyze the impression management techniques, using the 2006 press release of Yell Group as an example. For the qualitative information related to non-GAAP figures, we give each keyword a weight of 1. If the keyword appears in the most-emphasized section, we add a weigh of 1; for the next-most emphasized section, we add a weight of 0.5. If the keyword is reinforced, we add a weight of 0.5. If the statement is repeated, we add a weight of 0.5. Similarly, for the quantitative information, we give a weight of 1.0 to each non-GAAP quantitative amount identified in the press release. If the quantitative amount appears in the
most-emphasized section, we add a weight of 1; for the next-most most-emphasized section we add a weight of 0.5.
9 Thus, while previous non-GAAP studies focused on relative emphasis (location of non-GAAP measure versus the location of
the GAAP figures), we measure the level of emphasis, focusing only on the location of the non-GAAP measure. This approach is consistent with the coding of the other measures included in our score.
10 Although it is common that information included in the headline is also included in the main body of the press release, we
consider this practice as emphasis by repetition because it is up to the manager to (1) provide the press release with a headline (2) to include the same piece of information in the headline and in the main body of the press release.
16 If the quantitative amount is accompanied by a performance comparison, we add a weight of 0.5. If the quantitative amount is repeated, we add a weight of 0.5. These weights are either positive or negative depending on the keyword or amount positive or negative connotation. The final impression management score is calculated as the total composite score for all positive keywords and amounts minus the total composite score for all negative keywords and amounts, divided by the total number of words in the sections analyzed, as in earlier literature (Tetlock et al., 2008). This scaling allows for comparisons between press release sections of different lengths (Rogers et al., 2011). Figure 2 illustrates the calculation of the score.
IV. RESEARCH DESIGN
We argue that managers may attempt to hide the persistence of non-GAAP adjustments by associating the disclosure of these figures to impression management techniques. In order to assess whether this association exists we test the persistence of the non-GAAP adjustments disclosed with a high level of impression management. We estimate a model similar to that used by Frankel et al. (2011) and Jennings and Marques (2011), as follows:
EPSi,t+1 = α0 + α1NG_EPSi,t + α2NG_adjustmenti,t + α3High_NGIMi,t +
α4High_NGIM x NG_EPSi,t + α5High_NGIM x NG_adjustmenti ,t +
FirmControlsi,t + TimeControlsi,t + IndControlsi,t + CountryControlsi,t + μi,t (1)
The dependent variable is GAAP earnings per share (EPS) for period t+1. We also estimate the model using operating income per share at t+1. Using operating income removes a potential mechanical
17 relation between EPSt+1 and NG_adjustment resulting from recurring adjustments such as depreciation or amortization (Frankel et al., 2011).
In classic persistence models, the independent variable of interest would be GAAP EPS for period
t. Since we are interested in analyzing the persistence of non-GAAP adjustments, and GAAP EPS is equal to non-GAAP EPS (NG_EPS) minus the non-GAAP adjustments on a per share basis
(NG_adjustment), we use these two variables instead. If the non-GAAP adjustments are transitory items they should not be persistent and the estimated coefficient for NG_adjustment should not be statistically different from zero. However, given Frankel et al.’s (2011) and Jennings and Marques’ (2011) results, we anticipate that at least some of the adjustments are recurring items. We expect to find a negative
coefficient on NG_adjustment, because these exclusions are almost always expenses. The main variable of interest is the interaction term High_NGIM x NG_adjustment. High_NGIM is an indicator variable coded as one when the firm’s impression management score for non-GAAP disclosure is higher than the sample median score, and zero otherwise. A significantly negative coefficient indicates that the
adjustments made by managers who use a high level of impression management are more persistent (i.e., they are of lower quality), consistent with our prediction.
We include the following firm-level controls. Size is the logarithm of total assets. Growth is a common factor of three variables: book-to-market assets, average sales growth in the last three years, and capital expenditures to total assets. Loss is an indicator variable coded as one if the value of GAAP earnings is negative, and zero otherwise. ROA Volatility is calculated as the standard deviation of ROA (return on assets) over the previous three years. We also include year, industry (based on one-digit SIC codes), and country indicators. All variables are for firm i and year t.
18 Our first hypothesis assesses whether market participants react differently to the disclosure of non-GAAP earnings that are communicated with high impression management. We use the following model to test it:
CAR = β0 + β1GAAP_surprisei,t + β2NG_adjustmenti,t + β3High_NGIMi,t
+ β4 High_NGIM x NG_adjustmenti,t+ IndustryControlsi,t
+ CountryControlsi,t + εi,t (2)
CAR is the cumulative abnormal return for a three-day window centered on the date of the earnings announcement press release (k). CAR is calculated as Πk=-1,+1(1+ARk)-1, where AR is the abnormal return obtained from the Fama-French three factor model (Fama and French, 1993) estimated over the previous 365 days and ending on day k-2. Given the international nature of the sample, we use country-specific risk factors, specifically market premium, size, and book-to-market international risk factors obtained from Ferreira et al. (2012, 2013). The definition of variables GAAP_surprise and
NG_adjustment is based on Marques’ (2006) methodology but takes into consideration the measurement issues discussed by Cohen et al. (2007) and Bradshaw et al. (2014).Given that I/B/E/S provides GAAP forecasts as well as non-GAAP forecasts, these two measures are used to calculate GAAP surprise and non-GAAP surprise, respectively.11 We split the total earnings surprise of non-GAAP earnings measures (i.e., the difference between non-GAAP earnings and the median consensus non-GAAP earnings forecast) into two components. The first component is GAAP_surprise, and it is calculated as the difference
11
Marques (2006) considers I/B/E/S consensus forecasts as the benchmark to compute GAAP surprise because no other analysts’ forecast data was available at that time. Cohen et al. (2007) points out that this practice introduces measurement error. Now that there are two sets of I/B/E/S forecasts available (GAAP and non-GAAP) this practice is no longer necessary. Bradshaw et al.’s (2014) findings indicate that after correcting for measurement error non-GAAP earnings are still more informative to investors than GAAP earnings.
19 between GAAP earnings per share and the median consensus GAAP earnings forecast, scaled by share price at the end of the previous year. The second component is NG_adjustment, representing the
adjustments made by managers to obtain non-GAAP earnings. It is calculated as the difference between non-GAAP and GAAP earnings per share, scaled by share price at the end of the previous year.12 If non-GAAP earnings are more valuable to financial markets than non-GAAP earnings, the estimated coefficient for
NG_adjustment (β2) should be positive. We expect a positive coefficient for High_NGIM (β3) as prior
literature provides evidence that the tone of corporate narratives influences the market valuations positively (Davis et al., 2012).
Our focus is on the coefficient of the interaction between High_NGIM and NG_adjustment (β4). If
market participants do not understand managers’ attempts to promote their overstated versions of earnings through the use of a high level of impression management, then the coefficient β4 should be
positive. However, if investors interpret earnings announcements containing non-GAAP information combined with high impression management as an attempt to camouflage the recurring nature of non-GAAP adjustments, there are two possible scenarios: either they ignore it or they react negatively.
Hypothesis 2 states that if investors react to the combination of non-GAAP disclosures and high impression management negatively, this reaction is more negative in countries with more sophisticated users and stronger enforcement. To test this proposition, we extend model (2) as follows:
12 We note that the variable NG_adjustment is unscaled in equation (1), whereas in equations (2) and (3) it is scaled by share
20
CAR = γ0 + γ1GAAP_surprisei,t + γ2NG_adjustmenti,t + γ3High_NGIMi,t
+ γ4 High_NGIM x NG_adjustmenti,t + γ5 High_Country
+ γ6 NG_adjustmenti,t x High_Country + γ7 High_NGIM x High_Country
+ γ8 High_NGIM x NG_adjustmenti,t x High_Country
+ IndControls i,t + υi,t
(3)
We use two measures to assess the level of sophistication of capital markets. The first is the percentage of institutional investment to market capitalization in the country, from Ferreira and Matos (2008). The second is the number of analysts in a country as reported in Bae et al. (2008). We assess the strength of investor protection with the anti self-dealing index created by Djankov et al. (2008). To facilitate the interpretation of results for each of the country measure, we create indicator variables coded as one if the country’s value, for each variable, is above the sample median, and zero otherwise. These are mentioned as High_Country in equation (3). The main focus of model (3) is the coefficient of the three-way interaction term High_NGIM x NG_adjustment x High_Country (γ8). Consistent with
hypothesis 2, we expect γ8 to be significantly negative. The definitions of the remaining variables and
expected coefficients are as discussed previously for model (2).
V. EMPIRICAL RESULTS Descriptive statistics and univariate tests
Table 2 presents descriptive statistics by country. The mean non-GAAP impression management score (NGIM) is positive for all countries, indicating an overall positive impression in the sample press releases. We find the highest NGIM score in Ireland (0.060) and the lowest in Hungary (0.001). A score of 0.060 means that in every 100 words analyzed there are six points more of positively biased content
21 than negative biased content. Hungary’s score indicates a more neutral content. The mean values of the adjustments (both unscaled and scaled by market price) vary substantially, suggesting the existence of country-level effects.The mean of the country-level variables also vary substantially, which encourages our belief that differences in institutional and economic conditions are likely to result in differences in the market reaction to non-GAAP disclosures.
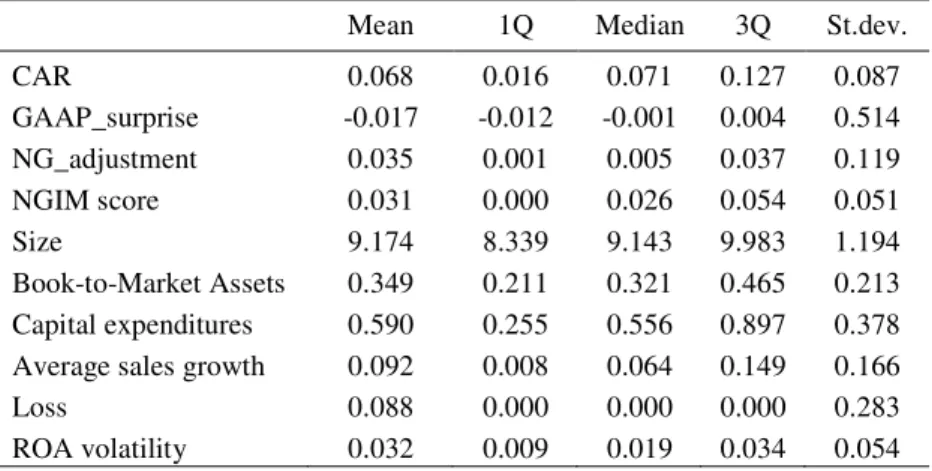
Panel A of Table 3 presents descriptive statistics of the main variables included in our models. The mean GAAP_surprise is -0.017, indicating that on average GAAP earnings misses analysts’ GAAP forecasts by approximately 0.2 cents (per each Euro of its price). On average, non-GAAP earnings are higher than GAAP earnings as the mean NG_adjustment is 0.035. The positive mean is consistent with prior evidence and results from managers’ excluding mostly expenses. Panel B of Table 3 presents Pearson correlations and their level of significance. Correlations are generally low. The NGIM score is positively correlated with CAR and NG_adjustment.
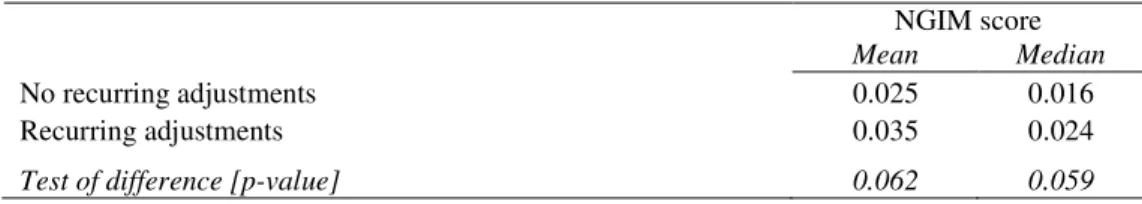
Table 4 presents univariate tests of the association between impression management and several aggressive non-GAAP disclosure practices. Black and Christensen (2009) find that managers
intentionally exclude recurring items, such as R&D, depreciation and amortization, stock-based compensation, and tax items. The univariate results in Panel A of Table 4 indicate that the level of the NGIM score is higher when firms make adjustments for recurring items. This evidence is consistent with a strategic use of non-GAAP disclosures and impression management techniques. We also find that firms that disclose non-GAAP figures with higher emphasis than GAAP figures tend to have a significantly
22 higher impression management score (Panel B).13 Moreover, we observe that firms than beat analysts’ forecasts only on a GAAP basis (i.e., when GAAP earnings miss the benchmarks) disclose non-GAAP measures with higher impression management (Panel C).
Figure 3 presents a temporal analysis of the recurring adjustments and the impression management score. The figure shows that both variables follow a similar time pattern.This finding suggests the
possibility of a strategic use of the non-GAAP disclosures and impression management techniques. A caveat of this analysis is that we can only observe exclusions for a limited number of cases (409 firm-years), because many firms do not disclose the nature of the adjustments. The lack of information is a direct consequence of the absence of strict non-GAAP disclosure rules in Europe.14
Results for the persistence analysis
Table 5 reports estimation results for two versions of model (1). As expected, the coefficients of
NG_EPS are positive and statistically significant, which is an indication that future earnings are
associated with current earnings. Consistent with our expectations and prior evidence, we find that some of the managers’ adjustments are persistent. The estimated coefficients of NG_adjustment are negative (values are -0.476 and -0.703) and statistically significant. The estimated coefficients for the interaction variable High_NGIM x NG_adjustment are negative and significant. In other words, the non-GAAP adjustments made by the High_NGIM group are more recurring (i.e., of lower quality). This recurrence of
13
We caution that our impression management score includes measures of emphasis and thus it is not surprising that impression management and the emphasis of non-GAAP earnings are positively related.
14
Given the small number of observations and relative short time-series, we cannot rule out that the association between non-GAAP recurring exclusions and impression management could be a consequence of the 2008 financial crisis.
23 the adjustments combined with high impression management is consistent with our argument that
managers use communication strategically in an attempt to mask the persistence of the adjustments, and portray non-GAAP earnings as a better measure of recurring performance than GAAP earnings.
Results for the market reaction (H1)
We test whether investors react to non-GAAP disclosures combined with high impression management. Table 6, Column (1) presents the results for a base model that includes only the
GAAP_surprise and the constant term. The estimated coefficient is positive and statistically significant, indicating that the market interprets the announcement of GAAP results above analysts’ expectations as good news. In column (2) we add NG_adjustment to the model to examine whether the market perceives alternative earnings numbers to be relevant information, in addition to that conveyed by GAAP. This effect has been established in US markets, but to the best of our knowledge, has never been tested
internationally. The positive and statistically significant coefficient (coefficient = 0.061, t-statistic = 2.44) is consistent with the notion that non-GAAP information has incremental information content and
previous results. This result can be interpreted as the investors’ perception that the non-GAAP
adjustments lead to a higher earnings surprise than that indicated by the GAAP figure. In column (3) we test whether there is a market reaction for a high level of impression management and find markets react positively to this.
Column (4) of Table 6 presents the results of estimating model (2). The coefficient of interest,
High_NGIM x NG_adjustment, is negative (-0.130) and statistically significant (t-statistic = -5.78), indicating a lower market reaction to non-GAAP adjustments when the disclosure of the non-GAAP is accompanied by a high level of impression management. The abnormal return for the non-GAAP
24 management is 0.125, whereas the reaction to the adjustments, when the non-GAAP disclosure is
accompanied by high impression management is economically and statistically zero (0.125 – 0.130). This empirical evidence suggests investors ignore non-GAAP information when managers communicate that information aggressively. Given our persistence results, one possible explanation is that investors
perceive the aggressive communication style as an attempt to inflate the firm’s operating profitability and penalize firms for it. This result differs from previous findings for US markets, where unsophisticated investors are misled by aggressive non-GAAP disclosures. We provide three alternative explanations for this discrepancy: (i) there are more sophisticated investors in the European capital markets than in the US, (ii) non-GAAP disclosures are more common in Europe than in the US, and (iii) there has been a learning effect through time, as discussion on non-GAAP has increased recently. Some data on the three possible explanations follows.
First, sophisticated users dominate the European capital markets. A report on the share ownership structure of listed European companies, submitted to the European Commission and the Financial
Services User Group, indicates that the weight of households’ ownership went from 28% (in 1975) to just 11% (in 2012) and that individuals now held equity mostly through retail investment funds and
“packaged products” offered by financial distributors.15
Second, our data indicates that that non-GAAP reporting is a common European practice (80% of our sample reports a non-GAAP figure in their press releases). In most cases (89%) non-GAAP figures have the same or higher emphasis than GAAP numbers, and in 74% of the cases European firms report
25 some type of reconciliation to GAAP measures. Thus, investors are familiar with non-GAAP information of European firms. In untabulated tests we include in our main model an indicator variable for the
presence of a tabular reconciliation (Reconc). The estimated coefficient for High_NGIM x
NG_adjustment is still negative and statistically significant, and the coefficient of a three-way interaction between this variable and Reconc is also negative and statistically significant. This result is consistent with reconciliations helping investors to understand whether the adjustments are recurring.
Third, it is possible that through time managers learn about the negative reaction to exaggerated impression management. The mean of the NGIM score is 0.04 during the period 2004 to 2007, but decreases significantly to 0.02 in 2008 and is almost zero in 2009. Interestingly the number of aggressive recurring exclusions follows a similar pattern (see figure 3). It is possible that managers reduced
impression management due to an increasing negative investor response to that practice. To shed light on this question we repeat our analysis adding a time trend variable (TREND) to the model. We find a negative and significant coefficient for High_NGIM x NG_adjustment x TREND, which confirms that the reaction to the combination of high impression management and non-GAAP numbers has increased through time. It is also possible that managers have reduced aggressive non-GAAP communication in the aftermath of the financial crisis, as one of the consequences of the crisis was the increased public pressure for more transparent corporate reporting, but our time series is not sufficiently long to draw conclusive statements.
The remaining coefficients in column (4) are in line with the results in the previous estimations. The positive estimated coefficient for High_NGIM (0.046) is consistent with prior evidence of a general positive market reaction to the use of communication techniques to convey earnings information.
26 One could wonder whether the effect observed for non-GAAP impression management is a spill-over effect of general impression management. To test this possibility, we add to the model a measure of impression management that captures the impression management used on the remaining information. We create an indicator variable, High_OtherIM, coded as one when the impression management in the text unrelated to non-GAAP disclosures is above the sample median, and zero otherwise. We then interact the indicator variable with GAAP_suprise, and include it in the model. The estimated coefficient for
High_NGIM and its interaction with NG_adjustment remains significant, indicating that there is an effect for general impression management that is different from the effect observed for non-GAAP disclosures.
To test whether our results are driven by one or more impression management tools, we test the individual components of our impression management score: tone, emphasis, and performance
comparisons. Panel B of Table 6 indicates that all components are relevant.
We conduct several additional tests. We first investigate the market reaction to non-GAAP adjustments and impression management in periods after the earnings announcement. Specifically, we estimate the model for windows [+2,+30], [+2,+60] and [+2,+90]. For the 30-day period we find a similar negative investor response, and similar coefficients for the other variables. Thus, it is possible that investors do not fully unravel managers’ motives, and that NGIM dampens the negative price response that occurs in the short window. However,we find no evidence of a reaction in the subsequent 60-day or 90-day period. Second, in order to take into consideration that the expected value of adjustments may be different from zero, we run a model with a structure similar to column (4) of Table 6, but where we
27 substitute NG_adjustment by NG_adjustment_surprise.16 Results are consistent with the ones discussed in Table 6. Third, to account for the influence of country specific variation in impression management (that may result from cultural and language differences) we repeat the analysis using a country demeaned NGIM variable. The results are similar to those reported in Table 6. We also repeat the tests excluding the UK and France to rule out the possibility that our results are driven by firms in these two countries,which account for about half of our total sample. Our conclusions do not change, although the empirical results are slightly weaker (due to the small sample size). Fourth, we repeat the analysis including in the model time indicators or a time trend variable and obtain similar results. Finally, we test the impact of IFRS adoption and find no evidence of an IFRS effect.
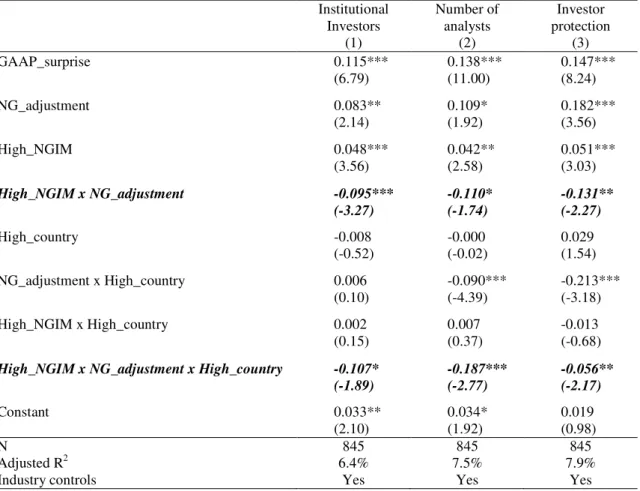
Results of country-level effects (H2)
Hypothesis 2 states that if investors react negatively to the combination of non-GAAP disclosures and impression management this penalty is stronger in countries with more sophisticated markets, and with stronger enforcement. To test it we interact High_NGIM x NG_adjustment with the indicator variable High_Country, which is coded as one when the country has score above the sample median in each of the three country factors (percentage of institutional investors, number of financial analysts, and private enforcement of anti self-dealing), and zero otherwise. Table 7 presents the results. The negative and statistically significant coefficients on High_NGIM x NG_adjustment x High_Country indicate that the market reaction to non-GAAP adjustments that are accompanied by high impression management is
16
We define NG_adjustment_surprise as Non-GAAP surprise – GAAP surprise, where Non-GAAP Surprise = Actual Non-GAAP Earnings – Forecasted Non-GAAP Earnings.
28 lower for firms from countries with a higher presence of institutional investors andanalysts, and with strong enforcement of minority investors’ rights. The total market reaction to the adjustments made in such settings is the sum of the coefficients of the variables NG_adjustment, High_NGIM x
NG_adjustment, NG_adjustment x High_country and the three-way interaction. Ignoring the one
coefficient that is not statistically significant we get the following totals: -0.119 for column (1), -0.278 for column (2), and -0.218 for column (3). These values are statistically negative. Moreover, our results indicate that the investors in less-sophisticated markets ignore non-GAAP adjustments made with high impression management, as the sum of the two coefficients of interest (NG_adjustment, and High_NGIM
x NG_adjustment) is statistically zero. Taken together, our results suggest that while the investors in more sophisticated markets penalize the adjustments communicated with high impression management (maybe understanding the persistence of the adjustments made), the investors in less-sophisticated markets do not react to these adjustments (maybe seeing them as cheap talk).
We next combine the three country variables using principal component analysis and extract two factors: SOPH (high loadings for variables percentage of institutional investors and number of analysts), and PROT (high loading for investor protection). Untabulated results indicate that the estimated
coefficients for High_NGIM x NG_adjustment x High_SOPH and High_NGIM x NG_adjustment x
High_PROT are negative, but only the first one is statistically significant.Overall, our results are
consistent with H2 and can be interpreted as evidence that investors in developed markets penalize more the firms that strategically use communication techniques to diminish the transparency of non-GAAP disclosures.
29
VI. ADDITIONAL ANALYSES Self-selection: the decision to disclose non-GAAP earnings
Our main analyses are based on cases that disclose non-GAAP earnings measures in the same section in which we measure impression management. This requirement ensures that the impression management score is directly related to non-GAAP reporting, but creates potential selection problems. These problems arise because we analyze only firms that choose to disclose non-GAAP information, and that choice is likely to be a result of specific conditions rather than a random choice. To address this concern we estimate a two-step selection model (Heckman, 1979). Similar to Christensen et al. (2014), we follow Tucker (2007) and allow the disclosing (NGdisclose) and non-disclosing groups to have different coefficients on the inverse Mills ratio (Mill) in the second step of the estimation.
The selection equation models the decision to disclose a non-GAAP figure in the earnings announcements, considering determinants previously identified in the literature (e.g. Walker and Louvari, 2003; Lougee and Marquardt, 2004; Marques, 2006) and our three alternative measures of sophisticated markets, due to the results of Isidro and Marques (2015). The selection results in Table 8 are consistent with our previous results, as the two sets of the three coefficients estimated for the interaction terms of interest, High_NGIM x NG_adjustment and its interactions with the country-level variables, are negative and statistically significant in all cases. Furthermore, the two sets of three coefficients estimated for the inverse Mills ratio are negative and statistically significant, indicating that there is a self-selection effect in our sample and the unobserved factors are negatively associated with CAR.
30
Choice of impression management level
Considering that the level of impression management used is chosen by the firm, we next assess whether managers are being strategic in their disclosure decisions. We follow the method proposed by Hogan (1997) to model auditor choice in initial public offerings to construct counterfactual results for firms choosing high and low impression management. We start by estimating the determinants of communicating non-GAAP numbers using high impression management, in order to obtain the inverse Mills ratios for high and for low impression management firms.
As determinants of high non-GAAP impression management we use firm characteristics associated with aggressive communication (Garcia Osma and Guillamon-Saorin, 2011; Black et al., 2016), as follows. Past accruals management is an indicator variable coded as one when the firm's net operating assets are above the industry year median, and zero otherwise. Real earnings management (REM) is calculated as the sum of two measures of real earnings management (abnormal cash from operations, and abnormal production of inventory). Accrual earnings management (AEM) is defined as the abnormal accruals from the performance-adjusted modified Jones model (Jones, 1991; Dechow et al., 1995; Kothari et al., 2005). Good news indicates if the firm reports an increase in earnings. Unmanaged earnings are calculated as I/B/E/S actual EPS minus REM and AEM. Past_NGIM is an indicator variable coded as one when the firm reported high NGIM in the previous year, and zero otherwise. Leverage is computed as debt to total assets. Size is measured as the natural log of total assets. Institutional holdings are measured by the percentage of institutional holdings in the firm.
31 We next use the estimated results to compute predicted values of CAR for the two subsamples. The predicted CARs indicate investor reaction if a high (low) NGIM firm had opted to use low (high) NGIM practices. Finally, we compare the mean predicted CARs with the actual CARs. The difference in means indicates the effect of firms’ strategic choice. For high NGIM firms the market reaction (actual CAR = 0.075) is significantly stronger than the reaction they would have achieved if they selected the low impression management style (predicted CAR = 0.034).This difference suggests a strategic choice of impression management. The same conclusion is obtained for low NGIM firms, as they avoid the negative market reaction that they would have experienced if they had engaged in high impression management (actual CAR is 0.032 and predicted CAR is -0.05, and the difference is statistically significant at the 1% level).
Alternative measures of impression management
To test the sensitivity of our results to alternative measures of impression management we first repeat the analysis using an industry adjusted measure of impression management. The second approach is to calculate an abnormal measure of impression management similar to that proposed by Huang et al. (2013). The abnormal impression management is the residual of a regression of high non-GAAP impression management on firm characteristics described in the section above. Finally, we change the weighting scheme of the impression management score, as weights can be subjective (Beattie et al., 2004). We repeat our empirical tests using an unweighted impression management score. We also use weights that are twice those initially assigned to tone for emphasis and performance comparisons. The idea is that these characteristics are likely to enhance more the positiveness or negativeness of
32
Machine-based measures
The manual content analysis applied in this study allows us to obtain a measure of impression management that is specifically tailored for non-GAAP disclosures, and covers several communication techniques. However, manual content analysis can introduce subjectivity in the analysis. To test the robustness of our results we construct three machine-based measures of language tone. We focus only on tone because commonly used machine-based methods are developed to capture tone. The three measures of language tone are based on: (i) the Loughran and McDonald (2011) dictionary, (ii) the Harvard dictionary (Loughran and McDonald, 2011, 2015), and (iii) the list of words derived from our manual content analysis.17
The market reaction results for the machine-coded scores are similar to those presented in tables 6 and 7, but slightly weaker. For example, the coefficients and correspondent t-statistics for the interaction term in equation 2 (High_Tone x NG_adjustment) are -0.094 (t-stat = -1.45) in the case of Loughran and
McDonald (2011) score, -0.092 (t-stat=-1.73) for the Harvard dictionary score, and -0.093 (t-stat=-1.82) for the score based on our own wordlist. We believe the weaker results are a consequence of two factors. First, the machine-coded score captures only tone and ignores other communication techniques which are captured by our main score. Second, the lists are not developed with announcements of financial data in
17
The Loughran and McDonald (2011) list is available at http://www.nd.edu/∼mcdonald/Word Lists.html. The Harvard
Psychosociological Dictionary, is available through the GI website (see http://www.wjh.harvard.edu/∼inquirer/). The list derived from the manual content analysis of the press releases included in this study is available upon request. The Loughran and McDonald (2011) list and the Harvard list are chosen because they have been widely used in accounting and finance research. However, they have also been criticised. First, the Harvard list is developed for psychological research and includes words which are not common in a finance context (e.g. mine or cancer) and it has been argued that it misclassifies words in financial applications (Loughran and McDonald, 2011). Second, the Loughran and McDonald (2011) list is developed for corporate 10K but it is biased towards a negative content (the list includes 354 positive words and 2,329 negative words).
33 mind. Overall, we conclude that computer-based methods of content analysis may not work as well as manual analysis for studying specific aspects of corporate disclosures.
VII. CONCLUSION
Managers use the flexibility allowed by earnings announcement press releases to disclose non-GAAP earnings measures that exclude transitory components, and are potentially a better presentation of permanent earnings. But the discretionary nature of non-GAAP calculations also creates opportunities to mislead investors. This possibility is intensified in environments where there are no stringent rules on non-GAAP reporting, investor protection is weaker, and investors’ sophistication is low. In addition, the flexibility allowed by earnings announcement press releases offers managers the opportunity to use communication techniques (i.e. impression management) to persuade investors and other users that their non-GAAP disclosures are a good representation of the firm’s persistent profitability.
For a sample of large European firms, we find that managers exclude recurring items from non-GAAP earnings, and that they combine this practice with high impression management. Investors react positively to non-GAAP information disclosed with low levels of impression management, but ignore the non-GAAP values that are combined with high impression management. Our evidence suggests that the market correctly identifies high impression management as an attempt to positively bias their perception about the persistence of non-GAAP earnings. Finally, we consider country-level conditions such as users’ sophistication and protection of investors’ rights. Our results indicate that in countries with sophisticated users and strong investor protection there is a penalty for disclosing non-GAAP figures with a high level of impression management.
34 Appendix
Measuring Impression Management
Yell Group plc- Final Results 8097 words
23 May 2006 07:01
Regulatory News Service English
(c) 2006 All Rights Reserved.
RSN Number: 3958D Yell Group plc 23 May 2006
Yell Group plc financial results for the year ended 31 March 2006
Strong growth across all business. Successful integration of TransWestern
Most emphasized section -- Group revenue up 26.1% to £1,621.3 million
-- Group adjusted EBITDA up Keyword+ 28.0% Bench+ to £502.9 NUM+ NG million
-- Adjusted profit after tax up Keyword+ 26.1% Bench+ to £233.6 NUM+ NG million
-- Group operating cash conversion of 88.9% compared to 88.4% last year --Adjusted diluted earnings per share up Keyword+ 25.2% Bench+ to 32.8 NUM+ NG pence
-- Proposed final dividend up 21.4% to 10.2 pence per share
Next most emphasised
section
Statutory results (unaudited)
2005 2006 Change Revenue 1,285.3 1,621.3 26.1% Operating profit 327.7 449.9 37.3% Profit after tax 162.5 212.3 30.6% Cash generated from operations 357.8 411.5 15.0% Diluted earnings per share (pence) 22.9 29.7 29.7%
Least emphasised section
Key: NUM+/-=positive/negative amount, Bench+/-= positive/negative performance comparisons, Keyword+/-=positive/negative keyword
NG= Non-GAAP figure
We illustrate impression management practices using a specific press release of a company included in our sample: Yell Group plc, year of 2006. We perform manual content analysis, which allows a detailed scrutiny of the press release. We manually code the three impression management practices investigated in the current study. Each press release is assigned three levels of emphasis (most-, next-most and least- emphasized sections) and the qualitative and quantitative information is coded for each