DOI: 10.1590/1808-057x201703360
*Paper presented at the American Accounting Association Annual Meeting, Chicago, IL, United States of America, August 2015.
Voluntary disclosure and earnings management:
evidence from the Brazilian capital market*
Silvia Consoni
Universidade Federal do Paraná, Departamento de Ciências Contábeis, Curitiba, PR, Brazil
Romualdo Douglas Colauto
Universidade Federal do Paraná, Departamento de Ciências Contábeis, Curitiba, PR, Brazil
Gerlando Augusto Sampaio Franco de Lima
Universidade de São Paulo, Faculdade de Economia, Administração e Contabilidade, Departamento de Contabilidade e Atuária, São Paulo, SP, Brazil
Received on 03.09.2016 – Desk acceptance on 03.21.2016 – 2ndversion approved on 01.05.2017
ABSTRACT
his study examines the association between the voluntary disclosure of economic and inancial information and earnings management. he outlined arguments on the subject are based on the assumption that consistent voluntary disclosure policies may reduce earnings management. he analysis is conducted on a random sample of 66 non-inancial Brazilian listed companies in the 2005-2012 period. To measure voluntary disclosure, the index proposed by Consoni and Colauto (2016) is used. As a proxy for earnings management, discretionary accruals (DA) are estimated based on the model by Dechow, Sloan, and Sweeney (1995). he relationship between these measurements is analyzed using a model of simultaneous equations and by the random efects regression method with panel data. A signiicant negative relationship was expected a priori; however, the main result of the study indicates that voluntary disclosure and earnings management are not simultaneously determined or associated. Although the results obtained contradict certain theoretical assumptions, there are alternative explanations for this inding. he empirical set of evidence in this research, in addition to those in previous studies, should be interpreted with caution because there is no consensus on the measures for voluntary disclosure and earnings management. Second, several companies in Brazil may not be interested in providing high-quality voluntary disclosure because most of their shareholders enjoy private beneits of control. his issue reduces the importance of the potential market demand for information, stratiies information asymmetry, and does not prevent earnings management.
1. INTRODUCTION
Although it is well known that corporate disclosure brings advantages such as greater stock market liquidity and a lower cost of capital (Botosan 1997, 2006; Lopes & Alencar 2010; Welker 1995), managers are not always willing to increase the level of accounting disclosure. In addition to these benei ts, there are most likely competing elements that may justify tighter managerial control over information, contributing to the importance of decisions about whether to disclose information.
Managers generally have access to more specii c and accurate information about a company’s business than do other market actors, but they may want to disclose or retain that information to serve their personal interests (Demsetz & Lehn, 1985). According to Watts and Zimmerman (1986), in deciding which information to report, managers attempt to evaluate how alternative methods will af ect their wealth.
According to Dye (1988), a manager enjoys an advantage over stockholders with regard to information because it is diffi cult for the latter to directly observe the company’s performance and therefore identify its future business prospects. In this sense, Scott (2012) observes that this information asymmetry creates ideal conditions for selective and distorted information reporting and a temptation to moral hazard. h us, greater information asymmetry allows managers to use their discretion for the specii c purpose of managing accounting results.
Information asymmetry can be reduced through voluntary disclosure and tighter regulation (Scott, 2012). However, regulation in the context of agency conl ict works only if the regulator can require the disclosure of information that market participants are unwilling to disclose voluntarily (Beyer, Cohen, Lys, & Walther, 2010). According to Watts and Zimmerman (1986), the recognition, measurement, and disclosure of accounting data are not always guided by impartial decisions, but can be driven by economic incentives that maximize the expected utility of one of the interested parties. Managers overlook the fact that, in earnings management, accounting choices should be guided by the economic fundamentals of the company’s business.
h e guiding hypothesis of this study is that voluntary disclosure and earnings management are negatively related because this relationship is based on the relationship of each of these variables with information asymmetry. Healy and Palepu (2001), Lambert, Leuz, and Verrecchia (2007), and Verrecchia (1983) present voluntary disclosure as a factor that contributes to the reduction of information
asymmetry. For Dye (1985, 1988) and Schipper (1989), among others, the information asymmetry between managers and investors is the necessary condition for earnings management. From this perspective, this study aims to investigate the relationship between voluntary disclosure of economic and i nancial information and earnings management in the Brazilian capital market.
Voluntary disclosure and earnings management are recurring themes in research on i nance and accounting. However, there is little empirical evidence on the relationship between them that is specii c to the Brazilian capital market. One example is the study by Murcia and Wuerges (2011), who explore this relationship from 2006 to 2008 using a sample of the 100 largest companies listed on the São Paulo Stock Exchange, Commodities and Futures(BM&FBOVESPA) and report a partially negative association between voluntary disclosure and earnings management.
To deepen this discussion, the time period of 2005-2012 is explored. Part of this period is marked by adjustments resulting from the process of alignment with international accounting standards starting in 2008. Consoni and Colauto (2016) present evidence that this process can be understood as an exogenous factor that had a signii cant positive ef ect on voluntary disclosure in Brazil. h erefore, the index proposed by Consoni and Colauto (2016) is adopted as a metric for voluntary disclosure and, dif erent from that of Murcia and Wuerges (2011), the proxy for earnings management that is used is the discretionary accruals (DA) estimated using the model by Dechow et al. (1995).
h e analysis performed in this study reveals that voluntary disclosure and earnings management are neither co-determined nor associated. h at is, the absence of a relationship between the variables investigated suggests that disclosure decisions are not an important determinant for the practice of earnings management in Brazil. For the U.S.A. (Jo & Kim, 2007; Lobo & Zhou, 2001) and British (Iatridis & Kadorinis, 2009) markets, there is evidence of a negative association. h us, it should be noted that dif erent proxies for voluntary disclosure and earnings management make direct comparison diffi cult. Moreover, institutional dif erences between markets may inl uence both voluntary disclosure and earnings management.
companies ignores the fact that the voluntary disclosure may itself be based on poor-quality information. h is point must be discussed and other methodologies must
be used to better understand the behavior of voluntary disclosure and earnings management in the Brazilian context.
2. LITERATURE REVIEW AND HYPOTHESIS DEVELOPMENT
2.1 Voluntary Disclosure of Information
The demand for additional resources always increases when new investment opportunities appear and new investment opportunities are themselves likely to be associated with a widening gap in the information asymmetry between “insiders” and “outsiders” (Healy & Palepu, 2001). Analytical models, such as those developed by Diamond and Verrecchia (1991), Glosten and Milgrom (1985), and Kim and Verrecchia (1994), show that information asymmetry decreases as the level of voluntary disclosure of information rises because and this can reduce the adverse selection component of the bid-ask spread (the mechanism for price protection when shares are bought and sold). As a result, the trade volume and stock market liquidity increase, possibly reducing the cost of capital.
According to Grossman (1981), Milgrom (1981), and Milgrom and Roberts (1986), without information disclosure, investors would be unable to distinguish between high-quality and low-quality stocks. A lack of information would lead investors to reexamine their beliefs about the company’s value and, logically, of er an average price for the entire group of stocks evaluated. In this sense, managers have an incentive to disclose all of the data at their disposal to distinguish themselves from those with less favorable data. In turn, theory about voluntary corporate disclosure has concentrated on identifying the reasons that full disclosure does not in fact occur.
Some of the research conducted by Robert E. Verrecchia and Ronald A. Dye, or research to which these authors contributed, has aimed to formulate models to explain partial voluntary disclosure. Refuting Verrecchia’s thesis (2001) that there is no unii ed theory of voluntary disclosure, Dye (2001) demonstrates that his arguments dif er from those of Verrecchia in that they consider models of voluntary disclosure to be essentially endogenous, whereas Verrecchia (2001) attributes the same status to endogenous and exogenous models.
According to Dye (2001), the idea that voluntary disclosure is effi cient and contributes to effi cient resource allocation in the capital market is related to the credibility of the i nancial data disclosed. Although Verrecchia (2001) notes managers’ propensity not to disclose data
that are essentially true, Dye (2001) argues that Verrecchia omits what he considers the determining factor in the disclosure’s credibility, earnings management.
In this sense, Core (2001) argues that unbiased disclosure is not a manager’s ideal, given that it carries a high cost. This conclusion is based on Watts and Zimmerman’s understanding (1986, p. 205) that not all accounting manipulation is eliminated and that only in capital markets with rational expectations will managers fail to benei t from manipulation. h e notion that it is very expensive to eliminate manipulation entirely indicates that managers can introduce some disclosure bias at a low personal cost.
In Verrecchia’s model (1983), the disclosure costs that hinder full disclosure do not vary based on the information that the manager possesses. In Verrecchia’s view (1983), the discretionary disclosure policy of managers is inl uenced by the costs of disclosing data, but the managers’ only motivation for divulging information is its ef ect on the company’s value.
In contrast, Dye (1985, 1986) claims that disclosure costs vary with the nature of what is being disclosed. If investors are uncertain whether managers withhold private information, they cannot interpret a lack of information as a sign that the company in question is withholding bad news. In the eyes of investors, Dye argues, companies with bad news are therefore indistinguishable from companies that make no disclosures.
It is interesting to note that the benei ts of corporate disclosure typically result in voluntary information disclosure, but not of all the information to which company management is privy. As noted by Dye (2001), the best information for the purpose of negotiating contracts is not necessarily the best information on which an investor should base a decision. h erefore, managers can strategically choose what to disclose and when to disclose it, provided that investors are uncertain as so what information the managers possess.
2.2 Earnings Management
Earnings management has been studied from many perspectives and methods. As a result, Mulford and Comiskey (2002) report that dif erent characterizations have arisen, such as income smoothing, the reduction of current proi ts for the sake of future proi ts (big bath), creative accounting, and cosmetic i nancial statements (window-dressing), among others.
Healy and Wahlen (1999, p. 368) and Schipper (1989, p. 92) explain that earnings management can aim to modify both proi t measures and economic and i nancial ratios, thereby modifying the form and content of accounting information. It is thus supposed that the practice of earnings management can interfere with the credibility of accounting data and its utility for decision-making by market actors. h us, if earnings management is viewed as an opportunistic act, it must be viewed as reducing the quality of the published disclosure.
For Arthur Levitt (1998), former president of the Securities and Exchange Commission (SEC), earnings management stems from a decline in the quality of i nancial information disclosure, and measures requiring greater transparency and oversight of the i nancial statement disclosure process would be necessary to contain it. In Brazil, the Brazilian Securities Commission (CVM, by its Portuguese abbreviation) has also spoken on this subject. In Circular n. 480 (14 February 2007) (Comissão de Valores Mobiliários/Normas Contábeis e Auditoria/ Superintendência de Relações com Empresas, 2007), the CVM declared that it considers earnings management to be an arbitrary form of discretion intended to inl uence or manipulate accounting numbers, though it falls within the limits of the law.
Despite the reduction in data reliability that ot en accompanies the practice of earnings management, there are arguments that this practice can be useful if kept within certain limits. Fields, Lys, and Vincent (2001) and Schipper (1989) argue that earnings management may
reveal information about the company’s value. In this sense, Subramanyam (1996) and Burgstahler, Hail, and Leuz (2006) refer to the practice of earnings management as an opportunistic behavior, but not when management’s discretion is used to better communicate the company’s underlying economic and i nancial performance. h us, if earnings management is used responsibly, then this practice can transmit private information to the market about expectations for future corporate earnings.
According to Dechow and Skinner (2000), the dif erent interpretations of earnings management agree that the practice requires intentional management, but it is not clear whether that intention is merely opportunistic or designed to convey private information to investors. As a result, this aspect makes it diffi cult to achieve a comprehensive understanding of the motivations for this practice and leads to widely dif ering empirical results.
According to Schipper (1989, p. 95), it is the persistence of information asymmetry that makes earnings management possible. h is condition arises from a contractually established form of communication that cannot be eliminated without changing the contract. Along this same line of reasoning, Dye (1988) argues that earnings management occurs when one or more hypotheses of the Revelation Principle are violated, given that monitoring mechanisms would force managers to reveal the truth about the information that they possess.
h e Revelation Principle is present in the literature on the design of mechanisms. In this context, mechanisms refer to a set of incentives that causes the agent to act in a manner that maximizes utility for the principal (Myerson, 1979). According to Lambert (2001), the premises of the Revelation Principle are related to communication, the form of the contract, and the commitment taken on. h us, the author explains that, according to the logic of mechanisms, when agents receive private information, they have the ability to transmit the information in its fullest dimension, i.e., when there are two signals, they will be transmitted as two separate messages rather than being aggregated into a single message.
in a manner that serves their own interest, given that shareholders cannot perfectly monitor the company’s performance and observe the prospects of the business environment. Dye (2001) addresses this issue, noting that Verrecchia (2001) neglects what he considers to be the determining factor in the information’s credibility, earnings management.
According to Watts and Zimmerman (1986), managers sometimes have the power to determine when an event will be shown in the accounts and which transactions will af ect the results reported, such as the appropriation of a certain expense, revenue, and the disposal of assets. In this sense, Bushman, Engel, and Smith (2006) explain that proi t may not be a good indicator for monitoring managers’ ef orts. One reason is that managers may choose accounting policies to maximize their own expected utility, managing the earnings opportunistically, and/or by reducing voluntary disclosure.
As suggested by LaFond and Watts (2008, p. 450), the private benei ts of control give managers incentives to use private information to transfer wealth to themselves, “even in the absence of i nancial-reporting-based debt and compensation contracts”. Furthermore, the institutional environment can interfere and provide various incentives for the practice of earnings management. h e level of protection for the investor can guide corporate choices on issues such as governance, the dividend policy, the financial structure, and the shareholder control of companies.
h e literature on earnings management suggests many explanations and/or motivations for this practice, with each of the explanations being applied to particular circumstances. Healy (1996, p. 108-109) suggests that the motivations for earnings management are ambiguous, making it diffi cult to establish appropriate methods for analyzing a certain behavior. In any given group of companies, some may act to reduce proi t to reduce their tax burden or discourage potential competition, whereas others may inl ate proi ts to maximize bonuses, meet analysts’ projections, or obtain loans. Furthermore, all of these behaviors may be present in the same company over a given period.
Due to the variety of environments in which businesses operate, it is diffi cult for a single explanation to cover all environments. In summary, it appears that earnings management occurs because there is no precise measure of net income and because the generally accepted accounting principles (GAAP) cannot completely constrain the subjectivity inherent in accounting policy choices and
in certain practices. Many decisions about accounting choices are complex and defy a simple answer about which best informs the investor.
h erefore, the issue of information asymmetry presents itself as a link between voluntary disclosure and earnings management and supports the research hypothesis. To inform stakeholders, managers can voluntarily disclose qualitative and quantitative information that goes beyond that which is required by law.
h rough voluntary disclosure, managers can show current and prospective earnings to those interested in the i nancial position of the company or they can clarify and explain the criteria adopted for the company’s formulation of its accounting policies and estimates (Lundholm, 2003). According to Lambert et al. (2007), this ef ort aims to reduce information asymmetry and thereby increase investors’ ability to make decisions and accurately monitor their investments.
Dye (1985, 1988) and Schipper (1989) consider the information asymmetry between managers and shareholders to be a necessary condition for earnings management. Schipper (1989) states that high levels of information asymmetry between managers and shareholders indicate a lack of sufficient resources, incentives, or access to relevant information for managers’ actions to be monitored.
Trueman and Titman (1988) base their work on the assumption that voluntary disclosure increases transparency and that earnings management would therefore be more easily detected by shareholders of companies with a more consistent voluntary disclosure policy. Under these circumstances, managers would be less likely to practice earnings management because its purpose and ef ectiveness depend on the level of information asymmetry between managers and other market participants. h us, managers would limit the level of voluntary disclosure if they wanted to maintain the l exibility to engage in earnings management.
disclosure to be inversely correlated with earnings management. Based on the theoretical predictions and empirical results discussed, the research hypothesis is as follows:
H1: as the index of voluntary disclosure of economic and i nancial information increases, the level of earnings management decreases.
3. METHODOLOGY
3.1 Measurement of Voluntary Disclosure
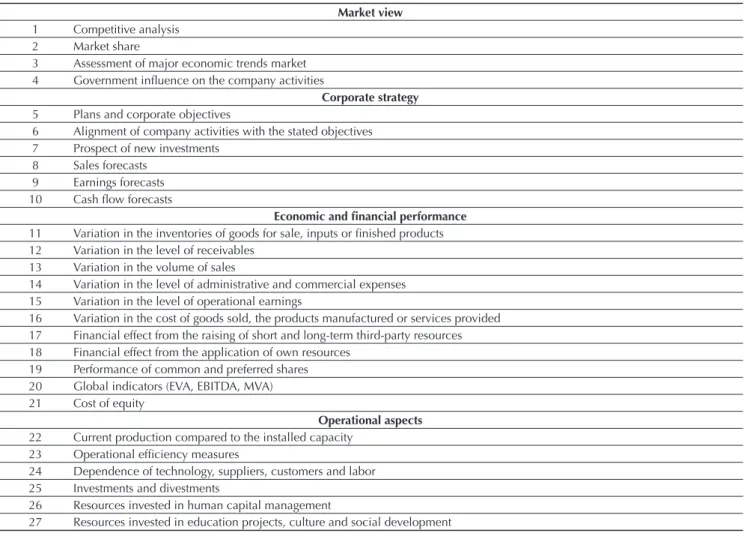
To explore what underlies the objective of this study and the specii cs of the context being analyzed, as Botosan (2004) refers to it, this study employs the metric proposed by Consoni and Colauto (2016) for measuring the content of voluntary disclosures (Table 1). h ese researchers conceive the metric grounded in Brazilian studies and dei ne its content based on the elements that continue to be voluntary over the time period of the study. h is
aspect of the methodology is relevant in the context of this analysis because, starting in 2008, Brazil began the process of aligning with the international accounting standards. In addition, in 2009, the CVM began to require companies to i le a Reference Form, which replaced the Annual Information Form (IAN, by its Portuguese abbreviation), and contributed to changing the nature of disclosure and increasing the volume and detail of the disclosed information.
Table 1 Voluntary disclosure index
Market view
1 Competitive analysis 2 Market share
3 Assessment of major economic trends market 4 Government inl uence on the company activities
Corporate strategy
5 Plans and corporate objectives
6 Alignment of company activities with the stated objectives 7 Prospect of new investments
8 Sales forecasts 9 Earnings forecasts 10 Cash l ow forecasts
Economic and i nancial performance
11 Variation in the inventories of goods for sale, inputs or i nished products 12 Variation in the level of receivables
13 Variation in the volume of sales
14 Variation in the level of administrative and commercial expenses 15 Variation in the level of operational earnings
16 Variation in the cost of goods sold, the products manufactured or services provided 17 Financial effect from the raising of short and long-term third-party resources 18 Financial effect from the application of own resources
19 Performance of common and preferred shares 20 Global indicators (EVA, EBITDA, MVA) 21 Cost of equity
Operational aspects
22 Current production compared to the installed capacity 23 Operational efi ciency measures
24 Dependence of technology, suppliers, customers and labor 25 Investments and divestments
26 Resources invested in human capital management
27 Resources invested in education projects, culture and social development
h is metric favors economic-i nancial information, although voluntary disclosure is not restricted to this content. It is understood that this limitation guides the analysis and is primarily due to the diffi culty of evaluating the disclosure of socio-environmental information in heterogeneous samples. Occasionally, this type of information is linked to details of corporate activities in certain segments of the market and may even be disclosed to meet regulatory requirements for that sector of the market.
h e procedures for data collection are the same as those adopted by Consoni and Colauto (2016), aligning the scope of each item of the metric with the content of statements in the Management Report and, where applicable, in some sections of the IAN and Reference Form. To take advantage of the fact that some companies disclose more detailed information, these researchers dei ne coding criteria that consider how detailed the information is, in both qualitative and quantitative terms. h erefore, when no information is available for a certain item, a score of 0 is assigned; when only qualitative information is available, presented in descriptive terms, 1 point is assigned; and when both qualitative and quantitative information is available (in monetary or non-monetary terms), 2 points are assigned.
h e absolute individual score ranges from 0 to 54 points (27 items measured, each worth a maximum of 2 points). h e index, which is a proxy for voluntary disclosure, is obtained by dividing of the absolute score of each company for each year by the maximum possible score. h e closer the ratio is to 1, the better the company’s voluntary disclosure is.
Along the same line presented by Francis et al. (2008), it is understood that a voluntary disclosure policy comprises
a stable set of disclosure practices. Although voluntary disclosure also occurs in conference calls, websites, and newspapers, the documents cited are consulted because they are subject to a fairly uniform presentation framework, making it possible to compare companies and monitor the regularity of their disclosures.
3.2 Measuring Earnings Management
According to Dechow and Dichev (2002, p. 39-40), accruals are temporary adjustments that delay or anticipate the recognition of cash l ows. Because not all i nancial decisions are directed at earnings management, researchers have separated total accruals into discretionary (opportunistic behavior) and non-discretionary (related to the level of business activity) accruals. h e literature of ers a variety of models for estimating DA, many of which are attempts to improve on previous models. For this study, we use the model by Dechow et al. (1995), known as the Modii ed Jones model. h is model uses aggregate accruals to try to estimate a “normal” level of accruals and deviations from this level are considered evidence of earnings management. h e advantages and disadvantages of this model have been discussed by Dechow, Ge, and Schrand (2010), DeFond (2010), Fields et al. (2001), Guay, Kothari, and Watts (1996), Lo (2008), h omas and Zhang (2000), and Young (1999), among others, but no alternative approach of ers a superior solution. According to Subramanyam (1996), the DA estimated by this model are priced by the market.
To estimate the DA, it is i rst necessary to calculate the total accruals obtained using the balance sheet approach. h e total accruals of company i at time t is dei ned as follows:
where TAi,t is the total accruals of company i at time t, ∆CAi,t is the variation in the current assets of company i
at the end of time t-1 to the end of time t, ∆Cashi,t is the variation in the available cash of company i from the end of time t-1 to the end of time t, ∆CLi,t is the variation in the current liabilities of company i from the end of time
t-1 to the end of time t, ∆CLFi,t is the variation in the
short-term loans and i nancing of company i from the end of time t-1 to the end of time t, Depri,t is the amount of depreciation, amortization, and depletion of company
i during time t, and Ai,t-1 is the total assets of the company at the end of time t-1.
DA are estimated using pooled ordinary least squares (OLS) with the following equation:
where ∆REVi,t is the variation in the net revenue of company i from time t-1 to time t, weighted by the total assets at the end of time t-1, ∆RECi,t is the variation in the accounts receivable (net) of company i from time t-1 to time t, weighted by the total assets at the end of time t-1,
PPEi,t is the balance of the i xed asset accounts (gross) of company i from time t-1 to time t, weighted by the total assets at the end of time t-1, and εi,t is the error term of company i for time t.
All model variables are del ated by the total assets of the previous time period (Ai,t-1) to minimize the ef ect of company size and the problem of heteroscedasticity. Regarding the parameters of the modii ed Jones model, the i xed assets and the dif erence in variation between net revenue and accounts receivable are the main drivers of the process of recognizing accruals. Using the estimated coeffi cients α1 and α2 of each company-year (equation 2), the non-DA (NDAi,t) are calculated as follows:
h e absolute DA (DAi,t) represent the dif erence between total accruals (TAi,t) and non-DA (NDAi,t) as follows:
In this sense, DA are the residuals of the regression. h e farther the residual is from 0 (whether positive or negative), the greater the level of earnings management
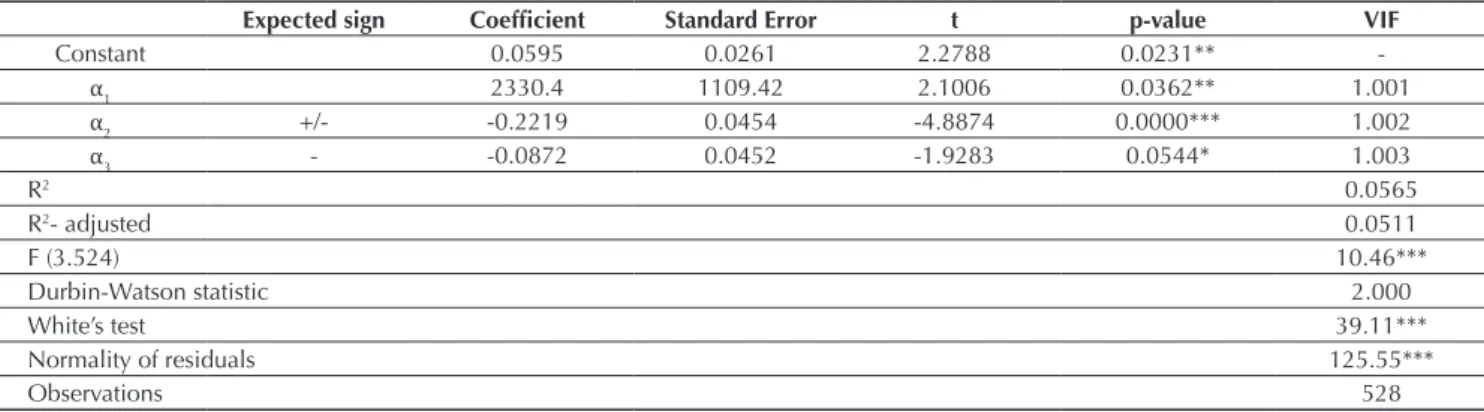
is. Table 2 shows the estimates of the parameters obtained by the Modii ed Jones model.
2
3
Table 2 Coeffi cients estimated by the Modifi ed Jones model (2005-2012)
Expected sign Coefi cient Standard Error t p-value VIF
Constant 0.0595 0.0261 2.2788 0.0231**
-α1 2330.4 1109.42 2.1006 0.0362** 1.001
α2 +/- -0.2219 0.0454 -4.8874 0.0000*** 1.002
α3 - -0.0872 0.0452 -1.9283 0.0544* 1.003
R2 0.0565
R2- adjusted 0.0511
F (3.524) 10.46***
Durbin-Watson statistic 2.000
White’s test 39.11***
Normality of residuals 125.55***
Observations 528
Note: the dependent variable is total accruals (TA).
coeffi cient α1 = 1/Ai,t-1; coeffi cient α2 = variation in the net revenue of company i from time t-1 to time t, weighted by the total assets at the end of time t-1, minus the variation in accounts receivable of company i from time t-1 to time t, weighted by the total assets at the end of time t-1; coeffi cient α3 = balances of fi xed assets accounts (gross) of company i at the end of time t, weighted by total assets at end of time t-1; VIF = variance infl ation factor.
*, **, ***: signifi cant at the 10, 5, and 1 levels, respectively. Source: Prepared by the authors.
h e variance inl ation factor shows that the model does not have multicollinearity problems in the specii cation. h e Durbin-Watson statistic shows that there is no serial autocorrelation. In turn, the model’s residuals do not follow a normal distribution. Nevertheless, according to Wooldridge (2002, p. 167), the OLS estimators satisfy asymptotic normality; that is, they have an approximately normal distribution in suffi ciently large sample sizes. White’s test detects heteroscedasticity, which makes the OLS estimators ineffi cient.
h e α2 coeffi cient is negative and related to the dif erence in variation between net revenue and accounts receivable. h eoretically, the sign expected for this coeffi cient is diffi cult to predict because it is related to the increase
in accruals, both for increasing and decreasing reported earnings. h e α3 coeffi cient represents i xed assets, which is responsible for expenses associated with depreciation, amortization, and depletion and, as expected, is positively correlated with these expenses.
3.3 Statistical Model
The research strategy is designed based on a simultaneous equations model. From the theoretical arguments outlined in the literature, it is assumed that corporate disclosure policy and the management of accounting data result from endogenous decisions. h erefore, the following two structural equations are dei ned to compose the system of simultaneous equations:
where DAi,tis the discretionary accruals of company i
at time t, VDIi,t is the index of voluntary disclosure of company i at time t, ROAi,t-1is the ln of the proi tability of corporate assets for company i from the end of time t-1
to the end of time t, LEVi,t is the ln of the book leverage of company i at the end of time t, LIQi,tis a dummy for the liquidity of the shares of company i at the end of time
t, IFRSi,t is a dummy for the period of alignment with international i nancial reporting standards of company
i at time t, taking the value of 1 for the 2009-2012 period and 0 otherwise, SIZEi,tis the size of the company, as measured by the ln of the total assets of company i at time t, CONi,tis the control rights, as measured by the percentage of common shares held by the main controlling shareholder or the sum of the percentages of common shares held by those who participate in the shareholders’ agreement for company i at time t, and εi,tis the error term for company i at time t.
5
h e two-stage least squares (2SLS) method is used to estimate the system of simultaneous equations. h e OLS method produces inconsistent estimators for models with endogenous explanatory variables. In turn, if no endogenous explanatory variables exist, or in the case of weak instruments, then the 2SLS method produces ineffi cient estimators, i.e., they lack the minimum variance.
3.4 Sample
h is study employs the same sample of companies that is used in Consoni and Colauto (2016). h e sampling procedure favors the random selection of companies that have maintained an active registration in the BM&FBOVESPA during the 2005-2012 period, excluding i nancial companies. By calculating the minimum size for i nite populations, with a signii cance level of 5% and a 10% margin of error, Consoni and Colauto obtain a sample of 66 companies, representing 32% of the population considered.
h ese criteria lead to the formation of a balanced panel containing 568 observation-years. Companies in the electric power and the steel and metallurgy sectors predominate in the sample, totaling 30%. Over 55% of the sample companies belong to the traditional market and, on average, the concentration of control rights is
73%, as measured by the percentage of common shares held by the controlling shareholder or, in some specii c cases, the sum of common shares held by participants in the shareholders’ agreement.
In considering whether the sample is appropriate for the aims of this study and, consequently, the analysis of its results, the following factors are taken into consideration: (i) h e sample has survival bias; that is, companies that closed or went public at er 2005 are not included in the sample. Including only companies with active registrations makes it possible to indirectly control for the potential ef ects of economic and regulatory changes on the main variables of the study, particularly on voluntary disclosure. In addition, this study seeks to monitor the consistency of companies’ voluntary disclosure policies. However, the survival bias makes it more diffi cult to generalize the results; (ii) To avoid impairing the measurement of some variables, such as the proxy for earnings management, companies in the finance and insurance sector are excluded from the sample because they have their own rules, chart of accounts, and specii c property that are not comparable to other sectors; (iii) A sample of 66 company-years makes it possible to construct a disclosure index, given that, according to Core (2001), disclosure indices require intensive manual labor and are viable only for small samples.
4. RESULTS
4.1 Regression Analysis Using 2SLS
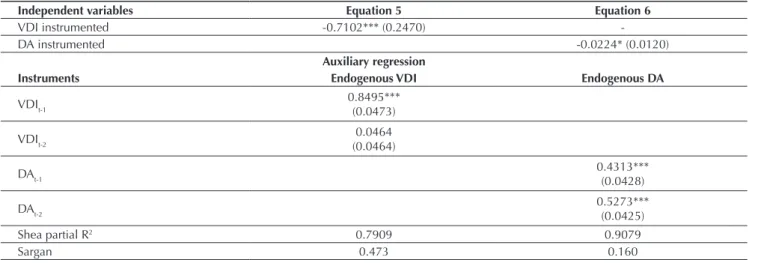
h e results obtained by the 2SLS and the diagnostic statistics for the estimates are presented in Table 3.
Table 3Summary of results for the two-stage least squares regression
Independent variables Equation 5 Equation 6
VDI instrumented -0.7102*** (0.2470)
-DA instrumented -0.0224* (0.0120)
Auxiliary regression
Instruments Endogenous VDI Endogenous DA
VDIt-1 0.8495***
(0.0473)
VDIt-2 0.0464
(0.0464)
DAt-1 0.4313***
(0.0428)
DAt-2 0.5273***
(0.0425)
Shea partial R2 0.7909 0.9079
h e Shea R2 statistic from the i rst-stage regression
indicates that the instruments are relevant in explaining the endogenous regressors. To ensure over identii cation, the lagged endogenous variables are used as instruments. h e Sargan test of over identifying restrictions is used to assess the i t of the instruments. h is test evaluates the statistical plausibility of the assumption that the instruments are exogenous. h e result shows that the instruments are statistically relevant. To perform analyses with appropriate estimators, it is necessary to test simultaneity between DA and VDI, adopting the Wu-Hausman specii cation test. h e test indicates that the residuals are not signii cant, as reported in Table 3; thus, it is impossible to reject the null hypothesis of exogeneity. In other words, DA and VDI show no simultaneous relationship in this model.
h e estimation of models with endogenous explanatory variables by the OLS method produces inconsistent estimators. However, the 2SLS method for estimating models produces ineffi cient estimators that lack the minimum variance when no endogenous explanatory variables exist or in the case of weak instruments. Because
there are no indications of simultaneity, it is more effi cient to use the OLS method.
4.2 Regression Analysis of Panel Data
Panel data, specii cally the i xed ef ects model, may be used to identify the sequential interrelationship between the DA and VDI variables. However, if only one of the relationships is signii cant, a unidirectional relationship will be observed between these variables. h erefore, the equations are estimated individually. First, the functional relationship between the dependent and independent variables is tested to observe the behavior of the VDI variable and of the control variables in relation to the DA and vice versa.
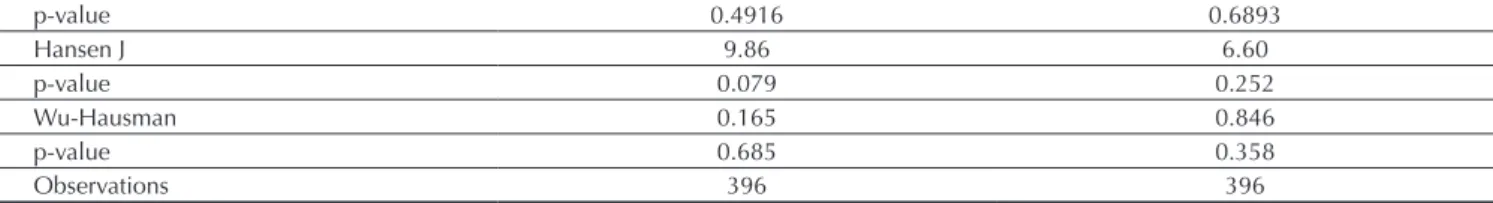
The Hausman test for the null hypothesis of the consistency of random ef ects estimators indicates that the i xed ef ects estimators are less effi cient; thus, the random ef ects model is deemed more suitable. h e results of the panel diagnostic tests and other results are shown in Table 4.
p-value 0.4916 0.6893
Hansen J 9.86 6.60
p-value 0.079 0.252
Wu-Hausman 0.165 0.846
p-value 0.685 0.358
Observations 396 396
Equation 5: DAi,t = α0 + α1VDIi,t + α2ROAi,t-1 + α3LEVi,t + α4IFRSi,t + α5SIZEi,t + εi,t Equation 6: VDIi,t = α0 + α1DAi,t + α2CONi,t + α3LIQi,t + α4IFRSi,t + α5SIZEi,t + εi,t
Note: standard error in parentheses. Regressions with exogenous variables not reported in table. DA = discretionary accruals; VDI = voluntary disclosure index.
*, **, ***: signifi cant at the 10%, 5%, and 1% levels, respectively. Source: Prepared by the authors.
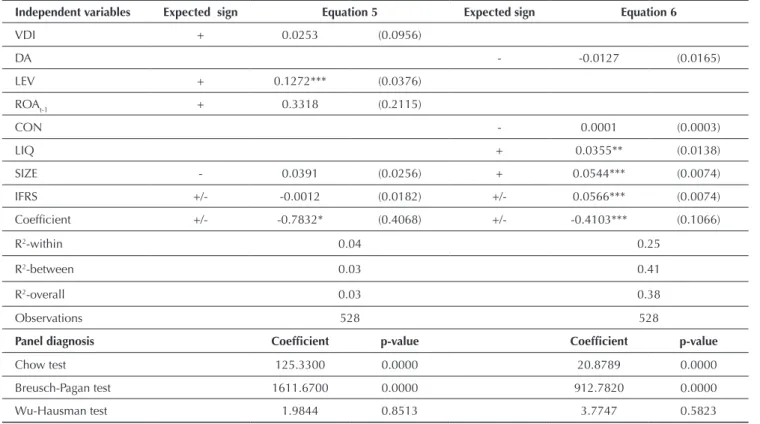
For the regression in which DA are the dependent variable, the only signii cant variable is LEV. h is positive and signii cant relationship suggests that companies with high debt ratios tend to manage their earnings to show higher proi t. Because it is a log-level function, all things being equal, a 10% increase in leverage has, on average, practically no ef ect on earnings management. h is result shows that, although signii cant, the economic ef ect is very small. h e other variables are not signii cant, nor do they show signii cant coeffi cients. h ese results contradict the theoretical assumption that these variables should be included in the model and, therefore, it is inferred that voluntary disclosure has no inl uence on variations in DA in the same time period. h e analysis of the results for the regression in which voluntary disclosure (VDI) is the dependent variable shows that, with the exception of the ownership concentration variable (CON), the other control variables are signii cant at the 1% or 5% level. h e relationship of these variables is consistent with that
which was expected.
Based on the results presented, a relationship between earnings management and voluntary disclosure in the 2005-2012 period is not found by the simultaneity test; even the regression analysis with panel data i nds no association between them. If a unidirectional relationship was found in the current period, then it may be inferred that a dependent relationship existed between the variables of interest; that is, the decision about whether to make voluntary disclosure would depend on the prior choice of accounting policy and vice versa.
To allow the analysis of the inl uence of the independent variables on the dependent variables over time, dummy variables are included to control this dimension. In this study, the dummies are presented for 2006 to 2012, given that 2005 is taken as the reference year. Only the year 2008 was found to be signii cant in both models, it was demonstrated that there is a dif erence between the periods before and after 2008. This difference
Table 4 Random effects model with panel data
Independent variables Expected sign Equation 5 Expected sign Equation 6
VDI + 0.0253 (0.0956)
DA - -0.0127 (0.0165)
LEV + 0.1272*** (0.0376)
ROAt-1 + 0.3318 (0.2115)
CON - 0.0001 (0.0003)
LIQ + 0.0355** (0.0138)
SIZE - 0.0391 (0.0256) + 0.0544*** (0.0074)
IFRS +/- -0.0012 (0.0182) +/- 0.0566*** (0.0074)
Coefi cient +/- -0.7832* (0.4068) +/- -0.4103*** (0.1066)
R2-within 0.04 0.25
R2-between 0.03 0.41
R2-overall 0.03 0.38
Observations 528 528
Panel diagnosis Coefi cient p-value Coefi cient p-value
Chow test 125.3300 0.0000 20.8789 0.0000
Breusch-Pagan test 1611.6700 0.0000 912.7820 0.0000
Wu-Hausman test 1.9844 0.8513 3.7747 0.5823
Equation 5: DAi,t = α0 + α1VDIi,t + α2ROAi,t-1 + α3LEVi,t + α4IFRSi,t + α5SIZEi,t + εi,t Equation 6: VDIi,t = α0 + α1DAi,t + α2CONi,t + α3LIQi,t + α4IFRSi,t + α5SIZEi,t + εi,t Note: standard error in parentheses.
DA = discretionary accruals; CON = stock concentration; IFRS = dummy for the period of alignment with international accounting standards; LEV = ln of the book leverage; LIQ = dummy for stock liquidity; ROAt-1 = ln of the fi rst asset profi tability lag; SIZE = ln of total assets; VDI = voluntary disclosure index.
may have occurred because many current accounting regulations went into ef ect that year as Brazil aligned with international accounting standards; 2008 was also the year of the subprime lending crisis.
Although it is found that the DA and VDI variables do not appear to be associated in the current period, this study seeks to determine whether the level of voluntary disclosure at t-1 af ects earnings management and whether earnings management at t-1 af ects voluntary disclosure. New tests are conducted to test the relationship between voluntary disclosure in the prior period and earnings management and vice versa. Tests to identify the most appropriate panel data approach are again performed. h e i rst two tests reject the null hypothesis that the pooled OLS model is appropriate, validating the alternative hypothesis that i xed or random ef ects models are appropriate. h e result of the Hausman test indicates the random ef ects model is the most appropriate. Overall, the results do not
dif er from those found when the variables were analyzed for the current period alone (Table 4).
h is i nding shows that the relationship between earnings management and voluntary disclosure is not signii cant. h us, there is no evidence that greater voluntary disclosure is rel ected in a lesser propensity to manage earnings in the methodological context of this study. h is i nding contradicts the underlying theoretical assumptions and dif ers from the empirical results presented by Iatridis and Kadorinis (2009), Jo and Kim (2007), and Lobo and Zhou (2001) in addition to the study of Brazil by Murcia and Wuerges (2011). h ese studies conclude that voluntary disclosure is one of the factors inhibiting the practice of earnings management. It is important to note that the dif erent methods and analyses used in each of these studies make it diffi cult to draw direct comparisons with the results found in this study.
5. CONCLUSION
h e theoretical assumptions of this study were that, when managers decide the level of voluntary disclosure, they may be inclined to practice earnings management to shape market actors’ perceptions to suit their plans, perhaps even acting in their own self-interest.
h is study is based on the idea that voluntary disclosure contributes to the reduction or elimination of information asymmetry and that lower information asymmetry makes it more diffi cult to engage in earnings management. h erefore, companies with a higher index of voluntary disclosure tend not to practice earnings management. It was hypothesized that there is a negative relationship between these variables.
In the inferential analysis performed, it is found that voluntary disclosure and earnings management do not appear to be simultaneously determined. Based on the procedures employed in this study, it is not possible to infer a signii cant relationship between the measures used. Accordingly, the results are inconclusive with regard to the ability of the voluntary disclosure variable to explain whether companies are likely to manage earnings. h e lack of a relationship between earnings management and voluntary disclosure suggests that disclosure decisions are not a determining factor in companies’ involvement in earnings management in Brazil.
Although it may seem that this result contrasts with the assumption that voluntary disclosure reduces information asymmetry and hence limits the opportunistic practice of earnings management, this study does not consider under
which conditions and at what time full disclosure is likely to occur. A market that values additional information may help raise the level of voluntary disclosure and improve the quality of information disclosed. h erefore, it is conceivable that the inl uence of voluntary disclosure on the extent of earnings management depends on the complex mix of companies’ characteristics and factors related to the institutional environment.
One possible explanation for the results obtained is the perception that, in Brazil, many companies may have no intention of making high-quality voluntary disclosures because their controlling shareholders are in a comfortable position, taking advantage of private benei ts that l ow from their preferential access to information. h is situation reduces the importance of the potential market demand for information, stratii es information asymmetry, and does not prevent opportunistic earnings management.
h e companies listed on the BM&FBOVESPA have gradually improved some aspects of corporate governance, but change has been very uneven. Brazilian companies are still marked by highly concentrated ownership and fragile corporate governance, with the concentration of control being made possible by the large number of non-voting (preferred) shares issued and the use of pyramidal structures (Silveira, Leal, Barros, & Carvalhal-da-Silva, 2009).
that the reported results should be interpreted with caution. With regard to the estimation of DA, there are still doubts concerning the models’ ability to measure earnings management, that is, to accurately distinguish between discretionary and non-discretionary components. h e choice of model used rel ects only the researcher’s choice because the study was not intended to prove its ef ectiveness.
Research into aspects of companies’ voluntary disclosure has diffi culty obtaining an appropriate measure of disclosure. For various reasons, many researchers choose to develop their own measures. Although the metric’s construction is grounded in previous studies and care is taken to identify the items whose disclosure has over time ceased to be voluntary, the process is not without subjectivity. Subjectivity can be present both in the selection of items and in the process by which they are coded.
It appears that several issues still need to be discussed in future studies. One should bear in mind that the literature on voluntary disclosure and earnings management is very
dispersed, at times resembling a puzzle. h is situation may be due to the dif erences in the conceptual understanding of each researcher, as well as their motivations. It is crucial to understand voluntary disclosure as a response to information asymmetry. As noted by Francis et al. (2008), the idea that voluntary disclosure is a determinant of earnings management ignores the fact that voluntary disclosure may also be based on poor information. h is aspect makes it particularly difficult to identify the interaction between earnings management and voluntary disclosure.
Moreover, one of the great challenges of empirical research into earnings management and voluntary disclosure is the question of causality. Due to the hypothesis of the endogenous nature of causality, it is diffi cult to establish and identify the exact ef ect that one mechanism may have on the other. In this sense, the present study is only an attempt to investigate the relationship between them. h e development or application of other methods can also make substantial contributions to this endeavor.
REFERENCES
Arya, A., Glover, J., & Sunder, S. (1998). Earnings management and h e Revelation Principle. Review Accounting Studies, 3, 7-34.
Beyer, A., Cohen, D. A., Lys, T. Z., & Walther, B. R. (2010). h e i nancial reporting environment: review of the recent literature. Journal of Accounting and Economics, 50, 296-343. Botosan, C. A. (1997). Disclosure level and cost of equity capital.
h e Accounting Review, 72, 323-349.
Botosan, C. A. (2004). Discussion of a framework for the analysis of a i rm risk communication. h e International Journal of Accounting, 39, 289-295.
Botosan, C. A. (2006). Disclosure and the cost of capital: what do we know? Accounting and Business Research, 36, 31-40. Burgstahler, D. C., Hail, L., & Leuz, C. (2006). h e importance of
reporting incentives: earnings management in Europe private and public i rms. h e Accounting Review, 81(5), 883-1016. Bushman, R. M., Engel, E., & Smith, A. (2006). An analysis of the relation between the stewardship and valuation roles of earnings. Journal of Accounting Research, 44(1), 53-83. Comissão de Valores Mobiliários/Normas Contábeis e Auditoria/
Superintendência de Relações com Empresas. 2007. Ofício-Circular n. 480, de 14 de fevereiro de 2007. Orientações gerais sobre procedimentos a serem observados pelas companhias abertas. Retrieved from http://sistemas.cvm.gov.br/port/atos/ oi cios/OFICIO-CIRCULAR-CVM-SNC-SEP-01_2007.asp. Consoni, S., & Colauto, R. D. (2016). Voluntary disclosure in
the context of convergence with International Accounting Standards in Brazil. Review of Business Management, 18(62), 658-677.
Core, J. (2001). A review of the empirical disclosure literature: discussion. Journal of Accounting and Economics, 31, 441-456. Dechow, P. M., & Dichev, I. D. (2002). h e quality of accruals and earnings: the role of accruals estimation errors. h e Accounting Review, 77(4), 35-59.
Dechow, P. M., & Skinner, D. (2000). Earnings management: reconciling the views of accounting academics, practitioners and regulators. Accounting Horizons, 14(2), 235-250. Dechow, P. M., Sloan, R. G., & Sweeney, A. P. (1995). Detecting
earnings management. h e Accounting Review, 70(2), 193-225. Dechow, P., Ge, W., & Schrand, C. (2010). Understanding earnings
quality: a review of the proxies, their determinants and their consequences. Journal of Accounting and Economics, 50, 344-401.
DeFond, M. (2010). Earnings quality research: advances, challenges and future research. Journal of Accounting and Economics, 50, 402-409.
Demsetz, H., & Lehn, K. (1985). h e structure of corporate ownership: cause and consequences. Journal of Political Economy, 93(6), 1155-1177.
Diamond, D., & Verrecchia, R. E. (1991). Disclosure, liquidity and the cost of capital. h e Journal of Finance, 46, 1325-1359. Dye, R. A. (1985). Strategic accounting choice and ef ects of alternative i nancial reporting requirements. Journal of Accounting Research, 23, 544-574.
Dye, R. A. (1986). Proprietary and nonproprietary disclosures. Journal of Business, 59, 331-366.
Dye, R. A. (2001). An evaluation of ‘‘essays on disclosure’’ and the disclosure literature in accounting. Journal of Accounting and Economics, 32, 181-235.
Fields, T., Lys, T., & Vincent, L. (2001). Empirical research on accounting choice. Journal of Accounting and Economics, 31 (1-3), 255-307.
Francis, J., Nanda, D., & Olsson, P. (2008). Voluntary disclosure, earnings quality e cost of capital. Journal of Accounting Research, 46(1), 53-99.
Glosten, L., & Milgrom, P. (1985). Bid, ask, and transaction prices in a specialist market with heterogeneously informed traders. Journal of Financial Economics, 26, 71-100.
Grossman, S. J. (1981). h e informational role of warranties and private disclosure about product quality. Journal of Law and Economics, 24, 461-484.
Guay, W. R., Kothari, S. P., & Watts, R. (1996). A market-based evaluation of discretionary accrual models. Journal of Accounting Research, 34(Supplement 3), 83-105.
Healy, P. M. (1996). Discussion of a market based evaluation of discretionary accrual models. Journal of Accounting Research, 34(3), 107-115.
Healy, P. M., & Wahlen, J. M. (1999). A review of earnings management literature and its implications for standard setting. Accounting Horizons, 13(4), 365-383.
Healy, P., & Palepu, K. (2001). Information asymmetry, corporate disclosure and capital markets: a review of empirical disclosure literature. Journal of Accounting and Economics, 31, 405-440.
Iatridis, G., & Kadorinis, G. (2009). Earnings management and i rm i nancial motives: a i nancial investigation of UK listed i rms. International Review of Financial Analysis, 18, 164-173. Jo, H., & Kim, Y. (2007). Disclosure frequency and earnings
management. Journal of Financial Economics, 84, 561-590. Kim, O., & Verrecchia, R. E. (1994). Market liquidity and volume
around earnings announcements. Journal of Accounting and Economics, 17, 41-68.
LaFond, R., & Watts, R. L. (2008). h e information role of conservatism. h e Accounting Review, 83, 447-478. Lambert, R. A. (2001). Contracting theory and accountings.
Journal of Accounting and Economics, 32, 3-87.
Lambert, R. C., Leuz, C., & Verrecchia, R. A. (2007). Accounting information, disclosure and de cost of capital. Journal of Accounting Research, 45, 385-420.
Levitt, A. (1998). h e importance of high quality accounting standards. Accounting Horizons, 12, 79-82.
Lo, K. (2008). Earnings management and earnings quality. Journal of Accounting and Economics, 45(2-3), 350-357.
Lobo, G. J., & Zhou, J. (2001). Disclosure quality and earnings management. Asia-Pacii c Journal of Accounting and Economics, 8(1), 1-20.
Lopes, A. B., & Alencar, R. C. (2010). Disclosure and cost of equity capital in emerging markets: the Brazilian case. he
International Journal of Accounting, 45, 443-464.
Lundholm, R. J. (2003). Historical accounting and the endogenous credibility of current disclosures. Journal of Accounting, Auditing and Finance, 18, 207-229.
Milgrom, P. (1981). Good news and bad news: representation theorems and applications. Bell Journal of Economics, 17, 18-32.
Milgrom, P., & Roberts, J. (1986). Relying on the information of interested parties. Rand Journal of Economics, 17, 18-32. Mulford, C. W., & Comiskey, E. E. (2002). h e i nancial numbers
games: detecting creative accounting practices. New York, NY: Wiley & Sons.
Murcia, F. D., & Wuerges, A. (2011). Escolhas contábeis no mercado brasileiro: divulgação voluntária de informações versus gerenciamento de resultados. Revista Universo Contábil, 7(2), 28-44.
Myerson, R. (1979). Incentive compatibility and the bargaining problem. Econometrica, 47, 61-74.
Richardson, V. F. (2000). Information asymmetry and earnings management: some evidence. Review of Quantitative Finance and Accounting, 15, 325-347.
Schipper, K. (1989). Commentary on earnings management. Accounting Horizons, 3, 91-102.
Scott, W. R. (2012). Financial accounting theory (6th ed.). Toronto: Pearson.
Silveira, A. M., Leal, R. P. C., Barros, L. B. C., Carvalhal-da-Silva, A. L. (2009). Evolution and determinants of i rm-level corporate governance quality in Brazil. Revista de Administração, 44(3), 173-189.
Subramanyam, K. R. (1996). h e pricing of discretionary accruals. Journal of Accounting and Economics, 22, 249-281.
h omas, J., & Zhang, X. (2000). Identifying unexpected accruals: a comparison of current approaches. Journal of Accounting and Public Policy, 19(4-5), 347-376.
Trueman, B., & Titman, S. (1988). An explanation for accounting income smoothing. Journal of Accounting Research, 26, 127-139.
Verrecchia, R. E. (1983). Discretionary disclosure. Journal of Accounting and Economics, 5, 365-380.
Verrecchia, R. E. (2001). Essays on disclosure. Journal of Accounting and Economics, 32(1-3), 97-180.
Watts, R., & Zimmerman, J. (1986). Positive accounting theory. Englewood Clif s, NJ: Prentice Hall.
Welker, M. (1995). Disclosure policy, information asymmetry, and liquidity in equity markets. Contemporary Accounting Research, 11, 801-827.
Wooldridge, J. M. (2003). Introductory Econometrics. A modern approach. 2 Ed. Ohio: USA, h omson South-Western. Young, S. (1999). Systematic measurement error in the estimation
of discretionary accruals: an evaluation of alternative modeling procedures. Journal of Business, Finance and Accounting, 26(7-8), 833-862.
Correspondence address:
Silvia Consoni
Universidade Federal do Paraná, Departamento de Ciências Contábeis