ECONOMIC POLICY UNCERTAINTY AND RETURN ON
FINANCIAL ASSETS – THE G7 CASE
Teresa Lopes de Carvalho
Dissertation submitted as partial requirement for the conferral of Master in Finance
Supervisor:
Professor Pedro Pires Ribeiro, Ph.D. ISCTE-Instituto Universitário de Lisboa
ECONOMIC POLICY UNCERTAINTY AND RETURN ON
FINANCIAL ASSETS – THE G7 CASE
Teresa Lopes de Carvalho
Dissertation submitted as partial requirement for the conferral of Master in Finance
Supervisor:
Professor Pedro Pires Ribeiro, Ph.D. ISCTE-Instituto Universitário de Lisboa
Acknowledgments
This section is reserved to those who have contributed to this dissertation realization. Without them, it would not have been possible. I want to express my sincere gratitude to all of them.
I would first like to thank you to my supervisor, Pedro Pires Ribeiro, for all the guidance and availability. His generosity and the fact of making everything look so simple was very important to make me feel capable of doing it even when I thought I could not. I would also like to thank you to one of the EPU Index authors, Steven J. Davis, for the help provided during the study and for his kindness. Without his participation, this dissertation would not have been accomplished.
To my family, a special thank you. Especially to my parents, brothers, sister and grandmother, for all the support, encouragement, enthusiasm and for all the good feelings they shared with me.
To my boyfriend, for all the support, for giving me strength, for dealing with all the not so good moments, for helping me with the software and for all his love and kindness. To my friends and colleagues from work, Carolina Pereira, Rafaela Rede, Carla Fonseca, Paula Franciscis, Nuno Godinho. Their tolerance and comprehension, their opinions and advices, their help and their friendship, were all very important.
Contents
Acronyms List ... i Table List ... ii Resumo ... iii Abstract ... iv 1. Introduction ... 1 2. Literature Review ... 53. Measuring Economic Policy Uncertainty ... 10
4. Econometric Methodology ... 11 5. Data ... 14 6. Empirical Results ... 17 6.1.1 United States ... 18 6.1.2 United Kingdom ... 20 6.1.3 France ... 22 6.1.4 Canada ... 24 6.1.5 Germany ... 26 6.1.6 Italy... 28 6.1.7 Japan ... 30 7. Conclusion ... 35 Bibliography ... 38 Annexes ... 41
EPU and the Return on Financial Assets
i
Acronyms List
ADF - Augmented Dickey-Fuller
ARCH - Autoregressive Conditional Heteroscedasticity EMH - Efficient Market Hypothesis
EPU - Economic Policy Uncertainty
GARCH - Generalized Autoregressive Conditional Heteroscedasticity G7 - Group of Seven
IGARCH - Integrated Generalized Autoregressive Conditional Heteroscedasticity KPSS - Kwiatkowski Philipps Schmidt Shin
P-Value - Probability Value SBC - Schwarz Bayesian Criterion U.K. - United Kingdom
EPU and the Return on Financial Assets
ii
Table List
Table 1 - U.S. stock market results. ... 18
Table 2 - U.S. zero-coupon bond results... 19
Table 3 - U.K. stock market results. ... 20
Table 4 - U.K. zero-coupon bond results ... 21
Table 5 - France stock market results ... 22
Table 6 - France zero-coupon bond results ... 23
Table 7 - Canada stock market results ... 24
Table 8 - Canada zero-coupon bond results ... 25
Table 9 - Germany stock market results ... 26
Table 10 - Germany zero-coupon bond results ... 27
Table 11 - Italy stock market results ... 28
Table 12 - Italy zero-coupon bond results ... 29
Table 13 - Japan stock market results ... 30
Table 14 - Japan zero-coupon bond results... 31
Table 15 - Results for the stock market ... 32
EPU and the Return on Financial Assets
iii
Resumo
Esta dissertação tem como objetivo compreender o impacto da incerteza económica nos retornos do mercado de ações e obrigações do grupo dos sete. Testamos a hipótese de que um maior nível de incerteza económica conduz à diminuição dos retornos destes ativos. Analisamos o impacto que o índice de incerteza económica e os retornos passados têm nos retornos atuais e se aumentos da incerteza económica se podem traduzir em aumentos da volatilidade condicional.
Esta pesquisa recai sobre o índice EPU, desenvolvido por Baker et al. (2016), e compreende dados diários transformados em séries temporais mensais para os mercados de ações e obrigações do G7, entre Janeiro de 2000 e Dezembro de 2016.
No que concerne ao mercado de ações, existe evidência de um impacto significativo da EPU nos retornos atuais, para a maioria países. Canadá e Itália são as excepções.
Relativamente à volatilidade condicional, informamos que a EPU tem impacto nos Estados Unidos, Reino Unido, Canadá, Alemanha e Japão. A EPU não apresenta resultados significativos para França e Itália.
No mercado das obrigações e ao contrário dos retornos passados, a EPU não apresenta impacto nos retornos atuais para a maioria dos países. No que respeita à volatilidade condicional, verifica-se que os retornos passados não têm influência nesta variável, ao contrário da EPU que apresenta valores significativos para os Estados Unidos, Canadá, Alemanha, Itália e Japão.
JEL No. C1, G15
EPU and the Return on Financial Assets
iv
Abstract
This dissertation aims at understanding the impact of economic policy uncertainty on the stock and bond market returns of the group of seven. We test the hypothesis that higher uncertainty levels cause decreases on these financial assets returns. We analyse the impact that the economic policy uncertainty index and previous returns have on current returns and if an increase of economic policy uncertainty lead to an increase of conditional volatility.
This research relies on the EPU Index, developed by Baker et al. (2016), and employs daily data averaged into monthly time series for G7 stock and bond markets, covering the period from January 2000 to December 2016.
Concerning the stock market, we find evidence of a significant impact of EPU on current returns for most of the countries. Canada and Italy are the exceptions.
Concerning conditional volatility, we report that the EPU has impact on United States (U.S.), United Kingdom (U.K.), Canada, Germany and Japan. EPU does not show significant results to France and Italy.
In the bond market and in contrast with previous returns, EPU does not have a great impact on the current returns for most of the countries. In what concerns conditional volatility, the previous returns have no influence for the entire sample and EPU presents significant results for U.S., Canada, Germany, Italy and Japan.
JEL No. C1, G15
EPU and the Return on Financial Assets
1
CHAPTER 1
Introduction
This dissertation investigates the impact that economic policy uncertainty (EPU) has on the financial assets returns of the seven most rich and developed economies in the world (G7 countries). We will also consider some other explanatory variables such as conditional volatility and previous returns.
We test the hypothesis that EPU has a negative impact on the financial assets returns. In addition, we analyse the conditional volatility equation and we estimate how the above-mentioned explanatory variables affect it.
EPU effects on financial assets has been the subject of several researches (Antonakakis et al. (2013), Beckert and Berghoff (2013), Brogaard and Detzel (2015), Dzielinski (2012), among others). Although there are a great number of empirical and theoretical studies on this subject, the majority relates to the U.S. and not so much about the other countries. This dissertation differs from other works by covering an ample data set, presenting empirical results of each country of the group of seven separately and allowing the demystification of EPU and its impact on stock and bond returns. We aim at understanding if EPU index influences current returns of stocks and bonds. In addition, we consider the conditional volatility, often ignored in the literature.
The contribution of this research is of special interest for different agents, namely policymakers, portfolio managers and risk managers.
The study of EPU is an important tool to the above stakeholders, as it seems to have a lot of impact on the economic and financial activity rise or decline.
Many events can contribute to increase EPU and consequently to change financial assets returns. In a macroeconomic perspective, terrorist attacks, natural disasters, political issues, news, financial crises and recessions are events that may cause instability, thereby affecting everyone and bringing a lot of uncertainty on a global perspective.
EPU and the Return on Financial Assets
2 One of the biggest increases in global uncertainty was triggered by the financial crises, started at 2007 with the subprime crises and later, with the Lehman Brothers. It showed how an increase in the EPU levels affects market behaviours.
Recent crises brought a new need of research about EPU in order to deepen the existing knowledge about the concept and to give answers to some questions about its existence, effects, consequences and ways to circumvent it. Recent crises also showed that economic policy is global and countries and their markets are increasingly dependent on each other in this matter. Financial market connects all countries so that bad events affect them all. This means that countries must cooperate in order to reach financial rules and agreements to reduce global EPU and to provide new growth opportunities. The countries that compose the G7 have a great responsibility concerning the financial stability worldwide. All of these countries, individually, represent the biggest and more developed economies in the world, a fact that makes their decisions have a major impact on the remaining countries and populations. Moreover, government and all the political news and processes, are sources of EPU (Davis, 2016).
Some recent events involving the G7 have contributed to an increase of global uncertainty in markets and in people’s confidence. Events like the Brexit, result from Britain’s referendum, U.S. presidential elections in November 2016, the referendum and the Italian elections, French presidential elections and all the terrorist attacks, helped that. These events have caused increases in the EPU levels for the affected countries and have impacted an even bigger range of countries.
The changes related to the government policy and government administration are known, among others, for conducing to changes in companies behaviour (Julio and Yook, 2012). This may generate greater EPU and consequently, a decrease in investment and hiring. Households and potential investors start re-evaluating their expenses and their decisions, thereby leading to decreases in demand and to several financial problems that slow the economy.
Some authors refer other sources of EPU. Bloom (2014) mentions three main explanations to EPU rises during recessions: events that provoke recessions are also responsible for generating more uncertainty, e.g. terrorist attacks, recessions are also responsible for causing uncertainty, slowing down economic growth and, during recessions policymakers try to find solutions, which, in their point of view, will lead to growth. However, these solutions may lead to more uncertainty.
EPU and the Return on Financial Assets
3 Bachmann et al. (2013) go further referring business uncertainty as the oxygen that make recessions happen and survive. According to these authors, high levels of uncertainty are responsible for causing dark times to economy.
As above-mentioned and based on several studies, it is possible to point out that EPU slows down the recovery from crises and this reflects the great impact it has on financial markets. In general, EPU may lead to financial crises that can bring many new challenges for policymakers and investors.
EPU also affects companies and those who are responsible for making decisions about their future. There is a risk to take during a decision-making period. The proximity between investment, growth and EPU concepts is the major reason of that risk. To circumvent EPU, it is important to anticipate its consequences. This prevent some risks and is an important advantage to policymakers and investors. Understanding EPU helps companies to predict future returns and to generate profit through smarter strategies. The way policymakers or investors act and the consequences of their decisions contribute to increase or decrease EPU (Davis, 2016). EPU estimation is the way these stakeholders have to support their decisions.
EPU is also one of the biggest drivers of stock and bond market returns volatility. Volatility is present in financial markets and, about financial assets returns, there is evidence of volatility when the prices become higher or lower. According to Fama (1970), prices are constantly changing through permanent information updates and are constantly adjusting to the most recent reality. Perry and Robertson (1998) reinforce these findings by mentioning that markets become information efficient, through absorbing all the political and financial information. In line with these findings, uncertainty is one of the factors that can also constrain markets efficiency (Williamson, 1984). If the future is uncertain, the prices may reflect that through volatility over time.
Bansal and Yaron (2004) refer the possibility of a decrease in the stock prices when EPU tends to increase. Largely, this price variation lead to greater volatility of returns. To avoid this pattern, investors need to collect information about prices volatility. A correct forecast may anticipate uncertainty shocks and provide time to develop strategies, mainly to prevent prices to vary in a large scale.
Regarding investment decisions in the financial markets, volatility is a concept that any economic agent should be aware of, to prevent the risk of losing money and to help to create an investment strategy. Although, as above-mentioned, volatility is not a constant
EPU and the Return on Financial Assets
4 and it cannot be totally predicted. It is important to consider past events and volatility fluctuations to understand its path.
In summary, EPU may affect financial and economic activities in several ways. As financial activity is developing from day to day, it brings the need to study financial time series, to predict future financial and economic market prices and conditions in order to generate more profit to companies and individual investors.
This dissertation seeks to explain EPU effects on stock and bond market returns of the G7. To proceed with the estimations, we will use the EPU index, developed by Baker et al. (2016) and build under a newspaper article component, the newspaper coverage of EPU, that consists of the frequency of words associated to uncertainty, that appear in some articles of the most important journals for each of the G7 countries.
In addition, we will use indexes of the stock market and 2-years zero-coupon sovereign bonds, which are available at Bloomberg. We will use Eviews software to proceed with the estimations.
This dissertation is organized as follows. Chapter 2 shows the literature review. Chapters 3 and 4 present the measuring of economic policy uncertainty and the econometric methodology, respectively. Chapter 5 outlines the data used to conduct the estimation of the results and chapter 6 focuses on the main empirical results. Chapter 7 presents the conclusions of this dissertation.
EPU and the Return on Financial Assets
5
CHAPTER 2
Literature Review
Uncertainty about economic, fiscal and monetary policies, among others, is the biggest concern to the financial area since the Great Recession (Baker et al., 2016).
As uncertainty is an omnibus concept, it is essential to understand its meaning. There are many definitions due to the existence of several studies with different objectives. Slovik (2011) points out uncertainty as everything that is unknown. This author assumes that this unknown part, that combines unavailable experiences and unavailable knowledge at some point in time, is responsible for generating market instability and considers that what is unknown is much embracing than what is known. In addition, to generate good outcomes, Slovik (2011) mention that market participants should be aware and consider that what is unknown is also important to design a strategy.
According to Knight (1921), uncertainty is the incapacity that people have to predict the probability of things that happen and Carvalho (2016) emphasizes that uncertainty about the return on financial assets is the business economics focus and that there is no possibility to eliminate it.
Broadly, Toma et al. (2012) distinguish uncertainty and risk concepts. These authors refer uncertainty as the situation of insufficient knowledge, impossible to eliminate and risk as the variable that can be identified and quantified. In the view of these authors, risk and uncertainty are important components in the decision-making process because in any uncertain or risky circumstances, the outcomes for a company may not be the same as in an uncertainty free environment.
Slovik (2011) also contributes to the literature by distinguishing market uncertainty and market risks. Market risks as the known risks, making them useful on the market prices establishment and market uncertainty as the unknown component, the uncertainty about what is known and its veracity. Uncertainty is part of financial markets and its study is an important tool when countries want to reach financial stability.
EPU and the Return on Financial Assets
6 Moreover, Larson and Resutek (2017) focus their investigation on the future stock returns and how investor uncertainty affects them. These authors define the uncertainty variables as the conditional volatilities implied in investor prospects about future performances and divide investor uncertainty as, first, the cash flow uncertainty, that considers the future cash flows and second, the information quality uncertainty that captures the uncertainty about the future company value. Their findings point to a negative correlation between cash flow uncertainty and future returns and an almost non-existing relationship between information quality uncertainty and future returns.
In addition, Leippold and Matthys (2017) emphasize that the EPU index combines the government policy uncertainty and monetary policy uncertainty. According to their findings, government policy uncertainty contributes to decline yields and to increase bond yields volatility. Nevertheless, their results show that depending on the type of uncertainty, yields behaviour may be different. Although government policy uncertainty can cause decreases in bond yields, the same does not happen with the monetary policy uncertainty that has an almost insignificant impact on the bond yields and their volatility. To understand the EPU concept, some authors explore the variables that can potentially increase or decrease it or, at least, generate it. Bloom (2014) points exogenous shocks as wars, recessions and financial panics, among others and endogenous shocks, like an economy slowdown and consequent higher micro and macro volatility, as responsible for increase EPU and broadly, to cause recessions. Because of these shocks, volatility can rise and fall rapidly. Bloom (2014) also argues that the EPU effects can appear at the households, consumption, investment and hiring level. Generally, increases in EPU occur due to bad news, as news are one of the most powerful variables that contribute to increase uncertainty.
Antonakakis et al. (2013) refer that volatility is also a great concern to the stock returns since its increase lead to more uncertainty and consequently to less returns. This is in line with Amengual and Xiu (2017) that argue that volatility of asset prices relates to the policy uncertainty as it decreases may lead to the policy uncertainty resolution. Therefore, volatility can be up due to some bad events and some unexpected announcements and, due to some new and good events, it can automatically move downwards (Amengual and Xiu, 2017). If the financial markets are in an ascending period, volatility tends to decline and when markets are falling and risk or uncertainty increases, volatility tends to rise.
EPU and the Return on Financial Assets
7 However, following Amengual and Xiu (2017) conclusions, uncertainty affects the short-term volatility in a much bigger way than it affects the long-short-term volatility.
Cermeño and Suleman (2014) study the connection between political risk and the volatility of stock market returns in emergent markets. In line with their findings, political news and political uncertainty not only can cause increases or decreases in stock market volatility but they also affect business, financial markets and their efficiency. Stock markets are also sensitive to news regarding political and governmental decisions. These should be assimilated by the stock markets in order to anticipate and avoid political uncertainty outcomes.
Beckert and Berghoff (2013) point uncertainty as one of the universal characteristics of the economic activity. In addition, the authors refer asymmetric information, unknown qualities of some assets and the free cooperation between the people as some variables that make uncertainty rise.
Another variable that can increase or decrease EPU levels is the news. Unforeseen and uncertain news generate sudden reactions. Due to this fact, the information that news provide must be considered by decision-makers because, through it, they can manage their decisions based on a more realistic scenario and change their initial ideas (Uusitalo et al., 2015).
According to Jones and Fabozzi (1992), unexpected factors have great impact in the financial assets values and returns and may lead to the demand of bigger rates of return to avoid declines in the bond yields and losses to the investors. On the grounds of the findings reported by these authors, the volatility concerning inflation is also responsible for the higher yields investors demand in order to avoid uncertainty and hedge against it. Davis (2016) argues that EPU affects consumption, asset prices, investment and growth. Baker at al. (2016) reinforce this idea considering EPU as a concept that contributes to retard growth in many sectors, e.g. finance and healthcare. According to their findings, most of the companies wait and are cautious in regards to investment in some projects, because they are aware that probably they will not be able to recover their money and that is more expensive to reverse some investments than to wait for better times.
As above-mentioned, investment decisions must consider the political risk and uncertainty (Cermeño and Suleman, 2014). Moreover, Pindick (1991) emphasizes that many investments cannot be dissolved. In some cases, investments can be potentially irreversible. That irreversibility, the consequent cautious attitude of investors and
EPU and the Return on Financial Assets
8 uncertainty, are all factors that delay investment projects and, this waiting period, may lead to a non-investing decision. The author mentions that this waiting time, together with the irreversibility of investments, may lead to an explanation similar to the call option concept. This gives to the investor the opportunity to invest some money, the investment cost (or exercise price in a call option), in a certain moment, to have an asset, in return. The exercise price will not return to the investor, because it was the payment for the opportunity, or not, to spend money in another period. In other words, the exercise price or investment cost is irreversible. The investor must decide between an immediate commitment and a delayed commitment. This may lead to an increase in investment costs and to some outcome losses. Nevertheless, the decision to postpone an investment allows more information, which will be useful and, sometimes, reveals that may be better not to invest (Bernanke, 1983). This is in line with Gulen and Ion (2016) findings since both authors mention that, in order to have more information and to reduce uncertainty levels, managers should postpone their investments.
Dzielinski (2012) argues that uncertainty itself may retard any type of investment. The bigger the uncertainty an investor perceives the bigger should be his willing to search for more information.
There are some ways to circumvent uncertainty. Slovik (2011) claims that decision-makers, investors, management responsible and everyone with decision power should deal with assets exposed to uncertainty, by having much more caution and by requesting adequate premiums. The increase of these premiums is, according to the author, a limitation to these assets growth. Moreover, to all financial institutions exposed to high uncertainty levels, there should be an increase of credit costs, to prevent them from being more exposed than they already are.
The above noted wait-and-see effect is another way to circumvent uncertainty and it starts due to uncertain periods (Gulen and Ion, 2016). These authors findings show that due to EPU increases, sometimes is better to delay investments. Another reason to do that is government and some other institutions decisions that cause modifications at the atmosphere where some companies act. These companies are often surrounded by great uncertainty. This make them do some efforts to do more research about the consequences EPU may bring (Gulen and Ion, 2016).
EPU affects company decisions at the investment and hiring levels and brings new challenges to the households (Baker at al., 2012). According to these authors, people are
EPU and the Return on Financial Assets
9 not sure about their incomes and this leads to a decrease in their purchasing power. People stop spending to start saving. Broadly, Baker et al. (2012) mention that EPU weakens the economic growth. Companies delay their investment decisions, households delay their own investments, especially when it means to invest a big amount of money, and managers become more cautious in order to avoid more costs. Largely, these authors conclude that, if policymakers could live in an environment where uncertainty does not exist, they would be able to help improving the macroeconomic performance of their country.
To enforce any institution for financial stability, the experience, the knowledge about the financial and economic environment, past practices and assets behaviour must be considered in the uncertainty estimation and analysis. This is also true to any investment or management strategy (Slovik, 2011).
EPU and the Return on Financial Assets
10
CHAPTER 3
Measuring Economic Policy Uncertainty
EPU is not easy to measure due to the fact of being unobservable. However, Baker et al. (2016) developed an index that aims at gauging uncertainty. Accordingly, they developed the EPU Index in 2012 (Baker et al., 2016). 1
The authors built the EPU index under a newspaper coverage of EPU. This is about the volume of EPU articles in the most important newspapers for each country. To fulfil the necessary conditions and to be able to be a component for this index, these articles need to contain three term categories: economy or economic, uncertain or uncertainty and one or more policy related terms such as policy, tax, regulation, among others.2
Although this index relies on the biggest newspapers in each country, the number of newspapers differs from country to country. Regarding the G7, for the U.S., the index relies on ten of the major newspapers, including USA Today and Wall Street Journal.3
For Canada the authors use five of the biggest newspapers, for Japan, the four more important and for Italy, France, U.K. and Germany the authors use two of the biggest newspapers for each country.
According to Baker et al. (2016), 2007 was the year from which uncertainty began to increase, due to the financial crises and, in 2016, global uncertainty reached levels never seen, due to events like the Brexit, U.S. presidential elections, the refugee crises, among others.
[Annex 1 here]
1The index was updated in August 2017. However, our research employs the EPU index updated in March
2016 and Japan data updated in May 2017.
2 More details available at www.policyuncertainty.com. This website was developed by Baker et al. (2016)
to present their EPU index.
3There is another EPU index to the U.S. It was built under three components: the newspaper coverage of
EPU, the number of federal tax code provisions that are going to expire in 10 years and the disagreement about economic forecasts. However, it is not used in our research to ensure the comparability of results.
EPU and the Return on Financial Assets
11
CHAPTER 4
Econometric Methodology
The main objective of this research is to grasp how much EPU affects stock and bond market returns of the G7 countries. Importantly, we will explore this linkage but also accounting for the conditional volatility.
Conditional volatility is a variable that contributes, among others, to predict prices evolution and to help in risk management. Conditional volatility also allows understanding the return fluctuations.
In order to achieve the main goal of this research, we will estimate the current stock and bond returns and their conditional volatility. We are going to construct our estimation based, not only on EPU but also on the previous returns and conditional volatility, as explanatory variables. Returns are volatile and not constant over time. We want to understand the causes of that volatility. To do that, besides the EPU effects, we will also test if our explanatory variables impinge on the conditional volatility of asset returns. Engle (1982) proposes the Autoregressive Conditional Heteroscedastic (ARCH) model. This model answers to those who want to calculate the volatility, based on the previous returns, considering that variance (𝜎2) is not constant over time. However, ARCH model
requires the estimation of many parameters. Hence, later, Bollerslev (1986) developes the Generalized Autoregressive Conditional Heteroscedasticity (GARCH) model, which provides an additional component, the conditional volatility in the past period. In addition, the number of parameters is no longer a problem.
In GARCH model, generalized denote that it is possible to combine ARCH and GARCH models. In other words, there is a certain error in the past period and a certain volatility, in that same past period that affect conditional volatility. It is an autoregressive model because the results will always depend on a certain error and volatility in the past period. It is also conditional because the results are conditional on the assumptions taken. GARCH is a heteroscedastic model because conditional volatility changes over time. That
EPU and the Return on Financial Assets
12 is also valid to the error that this model considers which has no constant volatility. It varies over time and it can be larger or smaller in some periods.
We will use the GARCH model. GARCH is the model that fits better in our research, to obtain the expected results and to estimate conditional volatility. GARCH is also an adequate model to entertain volatility forecasts and to study financial time series that vary over the time.
This model allows the estimation of the conditional volatility and is well suited to perceive how the past values of a variable can affect the current values on the same variable, e.g., how previous returns affect the current returns. In this sense, it is indispensable to understand what happens to a variable when another variable change. Conditional volatility modelisation is imperative in our research and through GARCH model we will capture it for both markets.
GARCH (𝑟 , 𝑝) is a standard model. 𝑟 refers to the number of ARCH terms and 𝑝 relates to the number of GARCH terms. There are many versions of GARCH model and, to proceed with this research, we use GARCH (1,1).
As for the conditional mean, we use the following equation, to each country of the G7 countries:
𝒓𝒊,𝒕 = 𝜷𝟎𝒊 + 𝜷𝟏 𝒓𝒊,𝒕−𝟏+ 𝜷𝟐 𝑬𝑷𝑼𝒊,𝒕+ 𝜷𝟑 𝝈𝒊,𝒕+ 𝜺𝒊,𝒕 (1)
Here, 𝑟𝑖,𝑡 refers to the returns in a certain country (𝑖), in a certain time (𝑡). This equation
allows perceiving how previous returns, EPU index and conditional volatility affect asset returns.
Once having characterized the conditional mean, it is necessary to define the conditional volatility equation, such as:
𝝈𝒊,𝒕𝟐 = 𝜷
𝟒 𝒊+ 𝜷𝟓 𝜺𝒊,𝒕−𝟏𝟐 + 𝜷𝟔 𝝈𝟐𝒊,𝒕−𝟏+ 𝜷𝟕 𝒓𝒊,𝒕−𝟏+ 𝜷𝟖 𝑬𝑷𝑼𝒊,𝒕 (2)
This equation is valid to each of the G7 countries and gives the effect of 𝐸𝑃𝑈𝑖,𝑡 on the conditional volatility as well as the previous returns effect. The bigger the beta
EPU and the Return on Financial Assets
13 coefficients, the higher the impact of the correspondent variable on the conditional volatility and the lower the beta coefficients, the lower the impact.
The point is to comprehend how previous returns and EPU index affect conditional volatility and how EPU index and conditional volatility affect the current stock and bond market returns. Previous returns, EPU and conditional volatility are the explanatory variables that will provide the estimation results and will lead to predictions close to markets reality.
ARCH and GARCH effects should respect the condition 0 < 𝛽5 + 𝛽6 < 1 for the conditional volatility equation. In the cases that this condition is violated, 𝛽5 + 𝛽6 > 1,
the conditional volatility exhibits an explosive behaviour. To circumvent this fact, Engle and Bollerslev (1993) proposed the integrated GARCH (IGARCH) model that forces 𝛽5 + 𝛽6 = 1.
EPU and the Return on Financial Assets
14
CHAPTER 5
Data
In this section, we present the sample under inspection in this research.
The G7 hold most of the global wealth. U.S., U.K., France, Canada, Germany, Italy and Japan are the seven most developed economies in the world. Due to this fact, the representatives of each country of the group are responsible for leading the international efforts with the aim at combating the negative effects resulting from events that could potentially increase uncertainty.
According to the G7 summit in May of 2016, which occurred in Japan, new efforts are essential to reinforce the global growth. The growth levels are below their full potential and it is time to achieve a sustainable growth. 4
We choose this group as the sample for this research because it consists of the biggest economies that together have a major influence on the decisions made worldwide. In addition, we choose it because many studies consider emergent markets and not so many the developed countries.
The political instability among these countries and their influence make them an interesting case study to understand how EPU affects their way of management and decisions as well as their markets and returns. The link between the G7 countries and the others, make these last ones vulnerable to the decisions of the G7.
To carry on with this research we need two main data inputs: EPU data, which consists of EPU Index, available at www.policyuncertainty.com and prices of bonds and equity indexes. As regards stock market, we collected daily prices of shareholder indexes from Bloomberg. The indexes are S&P 500 for U.S., FTSE 100 for U.K., DAX 30 for Germany, Nikkei 225 for Japan, S&P/TSX 60 for Canada, CAC 40 for France and FTSE
4 More information available in the G7 Ise-Shima Leaders’ Declaration G7 Ise-Shima Summit, 26-27 May
EPU and the Return on Financial Assets
15 MIB for Italy. Regarding bond market, we collected 2-years zero-coupon sovereign daily spot rates for the same countries. The data set underpinning the empirical results covers daily data averaged into monthly time series, spanning from January 2000 to December 2016.
In the context of financial time series data, standard econometric practice typically begins with the examination of unit roots. Accordingly, we start by evaluating the nature of integer unit roots in the time series by performing the ADF (Dickey and Fuller, 1981) test (with the optimal lag length determined by the SBC) and the KPSS (Kwiatkowski et al., 1992) test. Given that these tests reveal a number of variables that are non-stationary, the prices of bonds and equity indexes are transformed into returns and the EPU indexes are converted into first differences, which is in the spirit of Li et al. (2015) who argue that is preferable to deal with changes in, rather than levels of, the EPU index because the former is a more precise metric of policy uncertainty shocks than the latter. Next, having repeated the stationarity tests, we find ample evidence that the series under inspection are I(0). Looking to the stock market, we collected daily prices from Bloomberg and averaged them into monthly prices for all the sample countries.
Moving on to the bond market and with historical data of zero-coupon spot rates for different tenors, we get historical series and zero-coupon bond prices, such that:
𝒑𝒊 = (𝟏+𝒓𝟏𝟎𝟎
𝒊(𝟎,𝒕))𝑻 (3)
In equation (3), 𝑝 is the 2-years zero-coupon bond price, 𝑟 respects to the interest rate and T to the time to maturity, in years. In our research, we choose to study the short-term zero-coupon bonds, with a 2-years yield and, for that, on the previous equation, the time to maturity (𝑇) will be 2.
The procedure we follow considers the fact that the return of interest rate securities involves a more elaborated treatment than equities: i) these instruments tend to comprise a set of cash flows due to the regular payment of coupons, ii) bond maturity decreases with time and iii) it is easier to obtain historical series of yields with constant maturity than series of returns.
EPU and the Return on Financial Assets
16 After calculate the monthly average prices (𝑝) for both markets, we move on to the stock and zero-coupon market returns (𝑟𝑖,𝑡). We proceed with the following equation (returns
logarithm), in which, “𝑖” describes the country and “𝑡”, the time:
𝒓𝒊,𝒕 = 𝒍𝒏 (𝒑𝒑𝒊,𝒕
EPU and the Return on Financial Assets
17
CHAPTER 6
Empirical Results
In this section, we present the empirical results of our analysis. First, we present the stock market results followed by the bond market results.
To cognize the impact that EPU and the previous returns have on G7 current returns and their conditional volatility, we answer four main questions: Does EPU affect the stock and bond market returns? Does EPU affect the conditional volatility of both markets? Greater volatility of returns leads to higher current returns? Greater returns lead to higher volatility?
In this research, we find evidence that, for the stock market, EPU has great influence on the current returns and conditional volatility, for most of the countries of our sample. In addition, previous returns are also significant to the current returns estimation, excepting for U.S. and U.K. This is not in line with Fama (1970) and the efficient market hypothesis (EMH). However, our findings point in another direction for these two of the set of seven countries. For U.S. and U.K., previous returns do not have influence on the current returns estimation.
Regarding the bond market, more specifically, 2-years zero-coupon bonds and their returns estimation, the results are more consistent when compared with the stock market. Excluding U.S. and Italy, EPU has no influence on the returns estimation for the other countries of our sample. In addition, previous returns have a great impact on the current returns, for all the countries concerned.
Next, we present the results for each of the G7 for the stock and bond markets. It is worth emphasizing that we estimate the U.S., France and Japan’s results for the stock market through the IGARCH model since these three countries were not respecting the condition 0 < 𝛽5 + 𝛽6 < 1.
EPU and the Return on Financial Assets
18
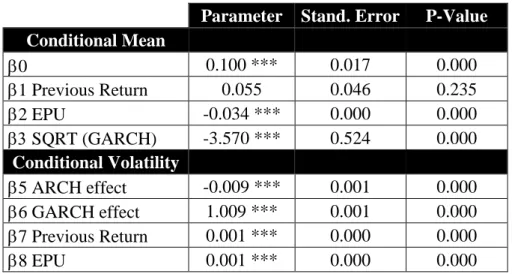
6.1.1 United States
Parameter Stand. Error P-Value
Conditional Mean 0 0.100 *** 0.017 0.000 1 Previous Return 0.055 0.046 0.235 2 EPU -0.034 *** 0.000 0.000 SQRT (GARCH) -3.570 *** 0.524 0.000 Conditional Volatility 5 ARCH effect -0.009 *** 0.001 0.000 6 GARCH effect 1.009 *** 0.001 0.000 7 Previous Return 0.001 *** 0.000 0.000 8 EPU 0.001 *** 0.000 0.000
For the U.S. stock market, we estimate the results through the IGARCH model. As regards table 1, there is resounding evidence that previous S&P returns are not able to explain the current returns of S&P500 since the corresponding parameter is not statistically significant at the conventional levels. We confirm the view that higher uncertainty surrounding stock market returns, measured by means of the GARCH effect, fuels the dynamics of current returns once the estimate associated with this variable is statistically significant. Thusly, the volatility of stock returns seems to affect the behaviour of stock returns in the U.S. market.
There is also evidence that EPU plays a significant role in explaining current returns in the U.S. equity market. More specifically, an increase of the EPU may lead to lower equity returns, which is in line with the evidence claimed by Brogaard and Detzel (2015). In fact, these authors voice that when EPU increases, returns fall and volatility gets higher. Moving on to the conditional volatility equation, both ARCH and GARCH effects are statistically significant at the conventional levels. Moreover, there is overwhelming evidence that higher previous returns generate higher stock market volatility. Lastly, EPU
Table 1 - U.S. stock market results. EPU parameter value multiplied by 100
EPU and the Return on Financial Assets
19 impinges on conditional volatility. Yet, it is worth mentioning that the estimated parameter is close to zero so that the above-mentioned impact is quite marginal.
Parameter Stand. Error P-Value
Conditional Mean 0 -0.001 0.000 0.390 1 Previous Return 0.239 *** 0.077 0.002 2 EPU 0.001*** 0.000 0.000 SQRT (GARCH) 0.253 0.135 0.355 Conditional Volatility 4 0.000 0.000 0.746 5 ARCH effect 0.150 *** 0.059 0.002 6 GARCH effect 0.833 *** 0.049 0.000 7 Previous Return 0.000 0.000 0.179 8 EPU 0.000 ** 0.000 0.047
As for the U.S. bond market, there is strong evidence of a statistically significant impact of the previous returns on current returns. EPU also has significant impact on current returns explanation. Both explanatory variables have a great impact on the current bond market returns, at the 1% significance level. Previous returns and EPU rises generate an increase of the current returns. Lam el al. (2017) go further mentioning that government instability significantly affects the equity returns for developed countries.
The volatility measured by GARCH effect is not an important component for the current returns estimation for the bond market.
Regarding the conditional volatility equation, we find that previous returns do not have a statistically significant impact. By contrast, EPU plays a significant role. This is in line with Leippold and Matthys (2017) findings that show that increases in EPU are responsible for bond volatility and with Haldrup et al. (2014) that found evidence that higher uncertainty levels lead to higher volatility, even though their study focuses on the 10-year government bonds.
Table 2 - U.S. zero-coupon bond results EPU parameter value multiplied by 100
EPU and the Return on Financial Assets
20 The short and long-run shocks, measured by ARCH and GARCH effects have also a great impact in the conditional volatility evolution through time. Increases in both ARCH and GARCH effects lead to increases in the zero-coupon bonds conditional volatility.
6.1.2 United Kingdom
Parameter Stand. Error P-Value
Conditional Mean 0 0.109*** 0.014 0.000 1 Previous Return 0.123 0.192 0.521 2 EPU -0.007 *** 0.000 0.000 SQRT (GARCH) 2.020 *** 0.067 0.000 Conditional Volatility 4 0.000*** 0.000 0.000 5 ARCH effect 0.152 *** 0.037 0.000 6 GARCH effect 0.603 *** 0.098 0.000 7 Previous Return 0.003 0.015 0.860 8 EPU 0.000 * 0.000 0.073
As concerns table 3, some remarks come into play. As for the estimate for the GARCH effect, it is statistically significant at 1% level. Therefore, the volatility of FTSE100 returns directly affect the current stock market returns. More specifically, an increase in the volatility of stock returns tends to generate higher stock returns in the U.K. stock market. Likewise, there is evidence of the great EPU impact on the current stock returns. In case of an increase in EPU, stock returns may decrease. This is consistent with the findings claimed by Verma and Verma (2016) who postulate that EPU has a negative and statistically significant impact on U.K. stock returns. This evidence is also valid for U.S., France, Germany and Japan. Nevertheless, our findings and the estimation result for EPU in the returns equation are close to zero, which points towards the inexistence of a nexus between the variables under inspection. On the other hand, previous returns are not
Table 3 - U.K. stock market results. EPU parameter value multiplied by 100
EPU and the Return on Financial Assets
21 significant enough to explain current stock returns. Largely, this evidence is in line with the EMH proposed by Fama (1970), that postulates that prices only change because they immediately reflect new information and that there are three levels of market efficiency: “weak-form, semi-strong and strong form”. On the weak form level, Fama (1970) argues that it is not possible to predict the future stock prices based on the previous stock prices since the current stock prices already reflect the past stock price changes.
In regards to the conditional volatility equation, there is strong evidence that both, ARCH and GARCH effects are statistically significant. Equally, EPU influences the conditional volatility of stock market at 10% significance level but this variable has a parameter value close to zero, giving evidence of an almost null relationship between the variables. By contrast, previous returns do not have a significant impact on stock market conditional volatility.
Parameter Stand. Error P-Value
Conditional Mean 0 -0.001 0.001 0.257 1 Previous Return 0.400 *** 0.060 0.000 2 EPU 0.000 0.000 0.725 SQRT (GARCH) 0.319 0.231 0.167 Conditional Volatility 4 0.000 0.000 0.318 5 ARCH effect 0.252 ** 0.106 0.017 6 GARCH effect 0.730 *** 0.110 0.000 7 Previous Return 0.000 0.000 0.552 8 EPU 0.000 0.000 0.701
Moving on to the zero-coupon bond current returns, table 4 shows that, regarding U.K., the previous returns are the only explanatory variable with statistically significant impact. This variable has influence on current returns at the 1% significance level. EPU and conditional volatility do not have a significant influence on the bond current returns.
Table 4 - U.K. zero-coupon bond results EPU parameter value multiplied by 100
EPU and the Return on Financial Assets
22 Regarding the conditional volatility equation, only ARCH and GARCH effects can lead to an increase. This means that short and long-run shocks can increase the conditional volatility in U.K. zero-coupon bonds. Once these variables become higher, the conditional volatility tends to rise. Previous returns and the EPU are not statistically significant to the conditional volatility estimation.
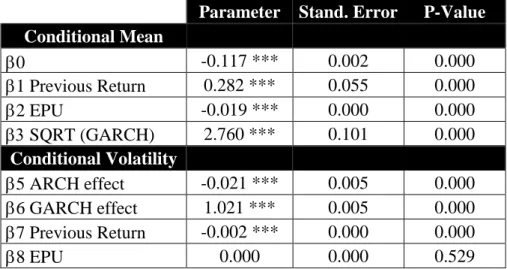
6.1.3 France
Parameter Stand. Error P-Value
Conditional Mean 0 -0.117 *** 0.002 0.000 1 Previous Return 0.282 *** 0.055 0.000 2 EPU -0.019 *** 0.000 0.000 SQRT (GARCH) 2.760 *** 0.101 0.000 Conditional Volatility 5 ARCH effect -0.021 *** 0.005 0.000 6 GARCH effect 1.021 *** 0.005 0.000 7 Previous Return -0.002 *** 0.000 0.000 8 EPU 0.000 0.000 0.529
French stock returns were, as the U.S. results, estimated using the IGARCH model. Accordingly, table 5 shows that there is strong evidence of the impact that EPU has on the stock market returns at 1% level. Increases on this variable generate lower stock returns, as shown by the parameter value. This is in line with Verma and Verma (2016) findings. These authors refer that EPU has a statistically significant impact on the stock returns and that both variables follow a negative correlation. Once EPU increases, current stock returns decrease. Previous returns and conditional volatility, measured by GARCH effect, also affect the current returns evolution, as these parameters are statistically significant. This goes, on the one hand, against the EMH (Fama, 1970) and, on the other
Table 5 - France stock market results EPU parameter value multiplied by 100
EPU and the Return on Financial Assets
23 hand, against Theodossiou and Lee (1995) findings. These authors find evidence of a non-existing correlation between conditional volatility and French stock returns. In fact, these authors findings are also valid to all the other G7 countries.
On the conditional volatility equation, there is evidence that both ARCH and GARCH effects are statistically significant at 1% level. Previous returns of CAC 40 are also significant enough to explain the stock market conditional volatility. Although all these variables significantly affect the conditional volatility, GARCH effect shows a positive correlation with this variable. Increases in GARCH effect generate increases in the conditional volatility. The same does not happen with the ARCH effect and the previous returns. An increase in one of these variables generates a decrease in the conditional volatility. EPU does not influence the conditional volatility for the French stock market.
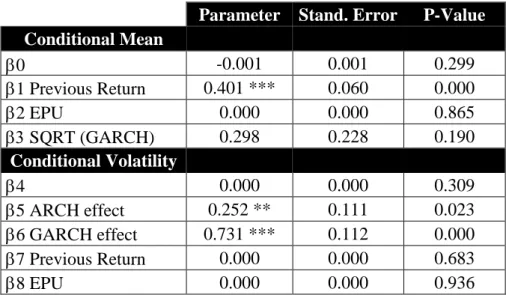
Parameter Stand. Error P-Value
Conditional Mean 0 -0.001 0.001 0.299 1 Previous Return 0.401 *** 0.060 0.000 2 EPU 0.000 0.000 0.865 SQRT (GARCH) 0.298 0.228 0.190 Conditional Volatility 4 0.000 0.000 0.309 5 ARCH effect 0.252 ** 0.111 0.023 6 GARCH effect 0.731 *** 0.112 0.000 7 Previous Return 0.000 0.000 0.683 8 EPU 0.000 0.000 0.936
Table 6 presents the results for French 2-years zero-coupon bonds. In what concerns the conditional mean equation, there is a statistically significant impact of French previous returns on the current returns estimation at the 1% significance level. Once this explanatory variable gets higher, current returns tend to increase. Conditional volatility, measured by GARCH effect, has no impact on the current returns and the same happens with EPU.
Table 6 - France zero-coupon bond results EPU parameter value multiplied by 100
EPU and the Return on Financial Assets
24 Regarding the conditional volatility equation, EPU and previous returns do not show statistically significant results in the conditional volatility estimation. Regarding the French bond market, Haldrup et al. (2014) findings are not in line with ours. These authors document that higher uncertainty makes volatility rise.
Furthermore, ARCH and GARCH effects show a significant impact on the conditional volatility estimation, at the 5% and 1% significance levels, respectively. Both variables are responsible for increasing the conditional volatility once they get higher.
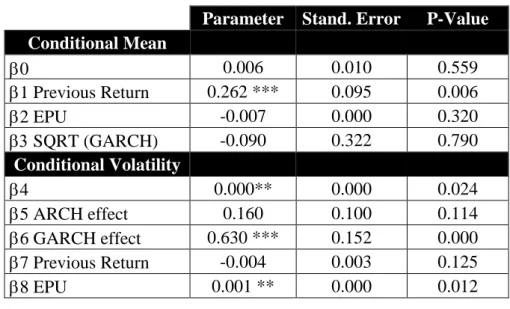
6.1.4 Canada
Parameter Stand. Error P-Value
Conditional Mean 0 0.006 0.010 0.559 1 Previous Return 0.262 *** 0.095 0.006 2 EPU -0.007 0.000 0.320 SQRT (GARCH) -0.090 0.322 0.790 Conditional Volatility 4 0.000** 0.000 0.024 5 ARCH effect 0.160 0.100 0.114 6 GARCH effect 0.630 *** 0.152 0.000 7 Previous Return -0.004 0.003 0.125 8 EPU 0.001 ** 0.000 0.012
Table 7 shows the results for Canada stock market. Regarding the conditional mean equation and against what was expected, none of the explanatory variables is statistically significant, excepting the previous returns. This may entail a fail of the EMH theory. Notwithstanding this non-obvious result, many authors find that market is not always efficient, contradicting Fama (1970). Grossman and Stiglitz (1980) refer that there is no market efficiency due to the cost of information, since it could be bigger than the investment return. According to Fama (1970), the markets are efficient and that requires
Table 7 - Canada stock market results EPU parameter value multiplied by 100
EPU and the Return on Financial Assets
25 “fully” reflection of the new information. Sewell (2011) claims that it is impossible for a real market “fully” reflect information due to the “fully” to be an exact requirement. Slovik (2011) findings show that market prices do not reflect the unknown information. Broadly, Bondt and Thaler (1985) mention excess volatility as another reason for markets inefficiency.
In what concerns EPU effect on equity returns, our findings suggest that EPU is not statistically significant at the conventional levels.
Moving on to the conditional volatility equation, ARCH effect and previous returns are not statistically significant to the volatility estimation. By contrast, GARCH effect plays an important role and EPU impinges on conditional volatility, even though with a result close to zero, presupposing an almost null impact. Beaulieu et al. (2005) find evidence of a strong effect of political risk in the Canadian volatility of stock returns. Despite that, the authors report that there is no relation between EPU and the stock returns in the mean equation.
Parameter Stand. Error P-Value
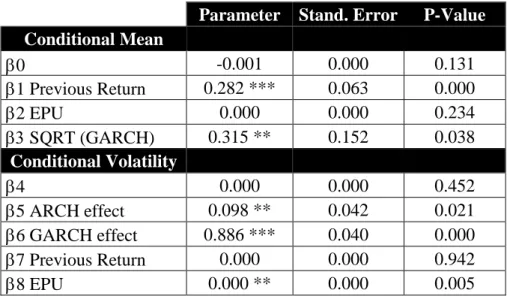
Conditional Mean 0 -0.001 0.000 0.131 1 Previous Return 0.282 *** 0.063 0.000 2 EPU 0.000 0.000 0.234 SQRT (GARCH) 0.315 ** 0.152 0.038 Conditional Volatility 4 0.000 0.000 0.452 5 ARCH effect 0.098 ** 0.042 0.021 6 GARCH effect 0.886 *** 0.040 0.000 7 Previous Return 0.000 0.000 0.942 8 EPU 0.000 ** 0.000 0.005
For Canada, not only previous returns directly affect the current zero-coupon bond returns but also the conditional volatility, measured by the GARCH effect. As table 8 shows, these explanatory variables are statistically significant at the 1% and 5% levels,
Table 8 - Canada zero-coupon bond results EPU parameter value multiplied by 100
EPU and the Return on Financial Assets
26 respectively. Once each of these variables suffer an increase, the current zero-coupon bond returns will also increase.
EPU does not show significant impact on current zero-coupon bond returns estimation. However, it has impact on the conditional volatility estimation. It is a statistically significant variable at the 5% level and according to its parameter value, when EPU rises the conditional volatility tends to rise. Nevertheless, the parameter value is close to zero, which may mean that EPU only has a marginal impact on the conditional volatility. The estimates for the ARCH and GARCH parameters also demonstrate that these variables have impact on conditional volatility estimation. Short and long-run shocks also generate higher conditional volatility. The only explanatory variable that cannot explain the conditional volatility evolution is the previous return.
6.1.5 Germany
Parameter Stand. Error P-Value
Conditional Mean 0 0.024 ** 0.011 0.028 1 Previous Return 0.160 ** 0.065 0.015 2 EPU -0.031 *** 0.000 0.000 SQRT (GARCH) -0.521 ** 0.264 0.048 Conditional Volatility 4 0.000 *** 0.000 0.000 5 ARCH effect 0.032 0.070 0.630 6 GARCH effect 0.751 *** 0.114 0.000 7 Previous Return -0.010 *** 0.002 0.000 8 EPU 0.002 *** 0.000 0.000
In table 9 mean equation results, all the explanatory variables are statistically significant to the stock returns estimation at the 1% and 5% significance levels. Nevertheless, increases in EPU may jeopardize the stock returns. Although EPU probability value is
Table 9 - Germany stock market results EPU parameter value multiplied by 100
EPU and the Return on Financial Assets
27 close to zero, presupposing a marginal impact, an increase in this variable may lead to lower DAX 30 returns. Su et al. (2016) do not corroborate this idea. Although these authors are focusing on the housing returns for the German market, their findings suggest that there is no impact of EPU on the returns due to German’s market stability.
The negative correlation we find is similar in the conditional volatility of stock returns, measured by the GARCH effect. If an increase happens in this explanatory variable, the current stock returns may decrease.
As occurred in Canada stock returns estimation, previous returns seem to have a considerable influence on the current stock returns for Germany. This goes against Fama (1970) and the EMH.
In what concerns the conditional volatility equation, GARCH effect, previous returns and EPU, are all statistically significant at the 1% level. Although, EPU parameter value is close to zero and previous returns lead to decreases in the conditional volatility. To contrast with these variables, ARCH effect does not have a significant influence in the conditional volatility estimation.
Parameter Stand. Error P-Value
Conditional Mean 0 0.000 0.000 0.353 1 Previous Return 0.369 *** 0.069 0.000 2 EPU 0.000 0.000 0.243 SQRT (GARCH) 0.288 * 0.156 0.065 Conditional Volatility 4 0.000 0.000 0.505 5 ARCH effect 0.135 *** 0.043 0.002 6 GARCH effect 0.847 *** 0.039 0.000 7 Previous Return 0.000 0.000 0.909 8 EPU 0.000 ** 0.000 0.030
Table 10 shows the results for the German bond market. EPU has not significant impact on German 2-year zero-coupon bond current returns and this means that even though bad
Table 10 - Germany zero-coupon bond results EPU parameter value multiplied by 100
EPU and the Return on Financial Assets
28 news or new information can appear, they will not influence these assets. In addition, previous returns have a considerable and statistically significant influence on the German current returns at the 1% level. Once this variable increases, current returns become higher. Conditional volatility of bond market is also an important variable in the current returns estimation. Although less significant than previous returns, changes in this variable may mean an increase in zero-coupon bond returns for Germany.
Moving on to the conditional volatility equation, the previous returns are the only variable that do not have any influence. All the other explanatory variables, EPU, ARCH and GARCH effects, have a significant impact on the conditional volatility estimation and, for all these variables, an increase lead also to an increase in the conditional volatility. Once more, this is line with what Haldrup et al. (2014) postulate. These authors refer that increases in the uncertainty level fuel increases in bond market volatility. These results are consistent in all the bond series that are part of these authors research (U.S., Germany and France). Nevertheless, EPU parameter value is close to zero, leading to a quite null impact of this variable in the conditional volatility for the bond market.
6.1.6 Italy
Parameter Stand. Error P-Value
Conditional Mean 0 0.005 0.013 0.687 1 Previous Return 0.162 * 0.090 0.060 2 EPU -0.012 0.000 0.290 SQRT (GARCH) -0.172 0.284 0.545 Conditional Volatility 4 0.000*** 0.000 0.012 5 ARCH effect 0.051 0.044 0.250 6 GARCH effect 0.852 *** 0.070 0.000 7 Previous Return -0.010 *** 0.003 0.000 8 EPU 0.001 0.000 0.370
Table 11 - Italy stock market results EPU parameter value multiplied by 100
EPU and the Return on Financial Assets
29 Table 11 gives the estimation of Italy stock market returns and stock market conditional volatility. In the mean equation, the previous returns are the only variable playing a significant role in the current stock returns estimation at 10% level. As said before, this should not happen if the model agrees with the EMH. It is worth emphasizing that this theory assumes that the prices automatically absorb the new information, some of them faster than others do. Our results show that previous returns directly affect the current stock returns and this goes against the EMH. Nevertheless, according to Grossman and Stiglitz, (1980), Sewell (2011), Bondt and Thaler (1985), among others, some market behaviours and some financial and economic variables point towards fails of the EMH. Both GARCH effect and EPU do not have a significant influence in the current Italian stock returns.
Moving on to the conditional volatility equation, ARCH effect and EPU are not statistically significant at the conventional levels. An increase at the EPU level does not mean that stock market will become more volatile. This variable does not have a significant influence on the stock market conditional volatility estimation. Contrariwise, GARCH effect and previous returns have. If an increase occurs in previous returns, this will reflect a decrease in the stock market conditional volatility. Changes in the GARCH effect may generate higher conditional volatility.
Parameter Stand. Error P-Value
Conditional Mean 0 0.000 0.001 0.518 1 Previous Return 0.433 *** 0.063 0.000 2 EPU 0.001 *** 0.000 0.005 SQRT (GARCH) 0.262 0.246 0.286 Conditional Volatility 4 0.000 0.000 0.111 5 ARCH effect 0.215 ** 0.091 0.019 6 GARCH effect 0.712 *** 0.106 0.000 7 Previous Return 0.000 0.000 0.825 8 EPU 0.000 ** 0.000 0.010
Table 12 - Italy zero-coupon bond results EPU parameter value multiplied by 100
EPU and the Return on Financial Assets
30 Regarding the bond market, there is strong evidence of the Italian previous returns and EPU influence in the current zero-coupon bond returns at the 1% significance level. This is in line with Lam et al. (2017) findings, showing that EPU has a statistically significant impact on equity returns, at the 1% significance level. However, our results show that both, EPU and previous returns increase current zero-coupon bond returns. Nevertheless, the EPU parameter value is close to zero, a fact that represent only a marginal impact for this market, tending to zero.
Regarding the conditional volatility equation, there is strong evidence of the influence of ARCH and GARCH effects as their parameter values are statistically significant at the 5% and 1% significance levels. These variables parameter values show that both lead to increases in the conditional volatility. EPU also points to a significant impact but, once again, EPU parameter value is close to zero, thereby leading to an almost non-existing impact. Previous returns have no significant impact on zero-coupon bond conditional volatility for Italy as the parameter value shows.
6.1.7 Japan
Parameter Stand. Error P-Value
Conditional Mean 0 0.046 *** 0.013 0.000 1 Previous Return 0.139 ** 0.056 0.013 2 EPU -0.039 *** 0.000 0.004 SQRT (GARCH) -1.056 *** 0.307 0.001 Conditional Volatility 5 ARCH effect -0.021 *** 0.009 0.019 6 GARCH effect 1.021 *** 0.009 0.000 7 Previous Return 0.001 * 0.000 0.067 8 EPU 0.004 *** 0.000 0.000
Table 13 - Japan stock market results EPU parameter value multiplied by 100
EPU and the Return on Financial Assets
31 Japanese stock market results were accomplished through IGARCH and are shown on table 13.
Regarding the mean equation, that provides the stock returns estimation, all the set of explanatory variables significantly affect the current returns. Christou et al. (2017) emphasize that EPU has a significant and negative influence on the stock returns and this is in line with our findings.
The effect that previous returns have on the stock returns goes, on the one hand, against the EMH and, on the other hand, against Mishra and Rahman (2010) findings, in which these authors claim that previous returns do not influence the Japanese current returns. According to these authors findings, Japan stock market follows a random path.
In what respect to the conditional volatility equation, all variables play a statistically significant role. GARCH effect, EPU and previous returns are statistically significant at 1% and 10% levels and all these variables follow a positive correlation with the stock market conditional volatility. Indeed, if these variables increase, the conditional volatility of returns may also increase. Although ARCH effect also has a significant impact in the conditional volatility, an increase in this variable result in a decrease on conditional volatility.
Parameter Stand. Error P-Value
Conditional Mean 0 0.000 0.000 0.491 1 Previous Return 0.187 ** 0.086 0.029 2 EPU 0.000 0.000 0.295 SQRT (GARCH) 0.179 0.156 0.249 Conditional Volatility 4 0.000 *** 0.000 0.006 5 ARCH effect 0.266 *** 0.088 0.002 6 GARCH effect 0.718 *** 0.071 0.000 7 Previous Return 0.000 0.000 0.837 8 EPU 0.000 *** 0.000 0.000
Table 14 - Japan zero-coupon bond results EPU parameter value multiplied by 100
EPU and the Return on Financial Assets
32 Table 14 presents the results for the Japanese bond market. In what concerns the current zero-coupon bond returns, neither EPU nor conditional volatility of the bond market present significant results at the conventional levels.
By contrast, previous returns have a significant impact at the 5% level and when this variable becomes higher, the zero-coupon bond returns tend to increase.
There is strong evidence of the ARCH and GARCH effects as well as EPU strong influence in the conditional volatility, at the 1% significance level. These explanatory variables generate higher conditional volatility once they become higher. However, and as above-mentioned, EPU has a quite marginal impact, as shown by the parameter value, close to zero. Previous returns do not have impact as shown by the non-significant parameter value. There is no significant impact from this variable on the conditional volatility.
In order to compare both market results we present two summary tables for the stock and bond markets:
U.S. U.K. France Canada Germany Italy Japan
Conditional mean 0 0.100 *** 0.109*** -0.117 *** - 0.024 ** - 0.046 *** 1 Previous Return - - 0.282 *** 0.262 *** 0.160 ** 0.162 * 0.139 ** 2 EPU -0.034 *** -0.007 *** -0.019 *** - -0.031 *** - -0.039 *** 3 Conditional St. Dev. -3.570 *** 2.020 *** 2.760 *** - -0.521 ** - -1.056 *** Conditional volatility 4 - 0.000 *** - 0.000 ** 0.000 *** 0.000 *** - 5 ARCH effect -0.009 *** 0.152 *** -0.021 *** - - - -0.021 *** 6 GARCH effect 1.009 *** 0.603 *** 1.021 *** 0.630 *** 0.751 *** 0.852 *** 1.021 *** 7 Previous Return 0.001 *** - -0.002 *** - -0 .010 *** -0.010 *** 0.001 * 8 EPU 0.001 *** 0.000 * - 0.001 ** 0.002 *** - 0.004 ***