Cesar Augusto Galvão Arrais(a) Marcelo Tavares de Oliveira(b) Donald Mettenburg(c)
Frederick Allen Rueggeberg(c) Marcelo Giannini(d)
(a)Department of Operative Dentistry, Univ
Estadual de Ponta Grossa - UEPG, Ponta Grossa, PR, Brazil.
(b)Department of Biophotonics Applied to
Health Sciences, Univ Nove de Julho - Uninove, São Paulo, SP, Brazil.
(c)Dental Materials Section, Department of
Oral Rehabilitation, School of Dentistry, Georgia Health Science Univ, Augusta, GA, USA.
(d)Department of Restorative Dentistry,
Piracicaba School of Dentistry, Univ Estadual de Campinas - Unicamp, Piracicaba, SP, Brazil.
Corresponding Author: Cesar Augusto Galvão Arrais E-mail: [email protected]
Silorane- and high filled-based
“low-shrinkage” resin composites: shrinkage,
flexural strength and modulus
Abstract: This study compared the volumetric shrinkage (VS), lexural strength (FS) and lexural modulus (FM) properties of the low-shrinkage resin composite Aelite LS (Bisco) to those of Filtek LS (3M ESPE) and two regular dimethacrylate-based resin composites, the microilled He-liomolar (Ivoclar Vivadent) and the microhybrid Aelite Universal (Bisco). The composites (n = 5) were placed on the Telon pedestal of a video-imaging device, and VS was recorded every minute for 5 min after 40 s of light exposure. For the FS and FM tests, resin discs (0.6 mm in thickness and 6.0 mm in diameter) were obtained (n = 12) and submitted to a pis-ton-ring biaxial test in a universal testing machine. VS, FS, and FM data were submitted to two-way repeated measures and one-way ANOVA, re-spectively, followed by Tukey’s post-hoc test (α = 5%). Filtek LS showed lower VS than did Aelite LS, which in turn showed lower shrinkage than did the other composites. Aelite Universal and Filtek LS exhibited higher FS than did Heliomolar and Aelite LS, both of which exhibited the high-est FM. No signiicant difference in FM was noted between Filtek LS and Aelite Universal, while Heliomolar exhibited the lowest values. Aelite LS was not as effective as Filtek LS regarding shrinkage, although both low-shrinkage composites showed lower VS than did the other composites. Only Filtek LS exhibited FS and FM comparable to those of the regular microhybrid dimethacrylate-based resin composite.
Descriptors: Dental Materials; Composite Resins; Polymerization.
Introduction
Despite improvements in the mechanical properties of resin compos-ites (RCs), polymerization shrinkage still remains a challenge and im-poses limitations on the clinical use of RCs.1 Shrinkage is caused by an
exchange of van der Waals spaces for shorter covalent bond spaces when monomer molecules are converted into a polymer network.2 The
result-ing composite shrinkage of 2%–5%3,4 generates stress at the
dentin/adhe-sive interface,5,6 causing cusp delection7,8 or de-bonding, marginal
stain-ing, enamel crackstain-ing, and/or post-operative sensitivity.9
Many strategies have been proposed to reduce the shrinkage stress created during the polymerization of RCs into the prepared tooth cavity. Some of these techniques include the use of liners and the incremental placement of composites to allow them to shrink freely toward the ad-hesive interface.10 Other strategies focus on slowing down the polymer-Declaration of Interests: The authors
certify that they have no commercial or associative interest that represents a conflict of interest in connection with the manuscript.
Submitted: Sep 02, 2012
ization rate to extend the pre-gel phase,5,11 allowing
enough plastic deformation (low) to compensate for the reduction in RC volume. Such a controlled po-lymerization can be achieved by initial light expo-sure with low light intensity followed by a inal cure at high intensity (soft-start polymerization)11 by
ap-plying short pulses of light energy (pulse-delay tech-nique)12 or a combination of both techniques.
Another approach to reduce shrinkage stress is the use of the so-called “low-shrinkage” RCs (LSRCs). To develop LSRCs, manufacturers have replaced monomers such as TEGDMA with mono-mers with increased molecular weights.10 As a
con-sequence, RCs have fewer double bonds per unit of weight, leading to less shrinkage during polym-erization.3,13 Another monomer known as silorane
has been added to the composition of some RCs.14
In that system, the ring-opening chemistry of the monomer starts with the cleavage and opening of the ring systems to gain space and to counteract the volume reduction that occurs when the chemi-cal bonds are formed.14 Most recently, some authors
have observed lower shrinkage stress created by the polymerization of a resin composite with nanogel-modiied monomer added to its composition.15
As another alternative to LSRCs, manufacturers have incorporated high levels of illers into the res-in matrix, resultres-ing res-in a low resres-in matrix fraction. Once the resin matrix determines the reduction in volume when the dense cross-linked polymer net-work is created,16 these RCs are expected to develop
low shrinkage during polymerization. While the silorane-based RC has been exhaustively evaluated regarding its shrinkage values14,17 and mechanical
properties,18,19 little information is available in the
literature concerning the shrinkage and mechanical properties of these highly illed LSRCs.17
The analysis of lexural strength (FS) and lex-ural modulus (FM), along with volumetric shrink-age (VS), is crucial in predicting the clinical success of composites. Review studies have demonstrated that RC fracture is one of the main reasons for res-toration failures,10,20 as LSRCs with low FS are
ex-pected to fail prematurely, compromising restora-tion longevity. Similarly, FM is also closely related to the durability of restorative procedures with RCs
because products with low FM show severe elastic deformity under functional stresses, leading to the clinical failure of restorations.21
Thus, the aim of the current study was to com-pare the VS, FS, and FM of one highly illed LSRC with those of a silorane-based LSRC and two regu-lar dimethacrylate-based RCs. The research hypoth-esis was that the highly illed LSRC presents similar VS as the silorane-based LSRC, with FM and FS comparable to those observed in a regular-dimeth-acrylate microhybrid RC.
Methodology
Volumetric shrinkage analysis
The VS values of two microhybrid LSRCs and two regular dimethacrylate-based resin compos-ites, one microilled and another microhybrid RC (Table 1), were measured using a video-imaging de-vice (AccuVol; Bisco Inc., Schaumburg, USA) in the single-view mode. Since the microhybrid dimethac-rylate-based RC is recommended for posterior teeth, its mechanical properties were used as a reference for comparison with the mechanical properties of both LSRCs. Conversely, a microilled RC was se-lected because manufacturers do not recommend its use on posterior teeth. Therefore, any results from both LSRCs that are close to those from the micro-illed RC indicates that their use on posterior teeth should be avoided.
Each specimen (n = 5) was shaped into a semi-sphere (with volumes averaging approximately 5 µL) and placed on the Telon pedestal along the light path. The RC was allowed to rest for 1 min and was later exposed to 40 s of light curing (Astrallis 10, power output: 950 mW/cm2; Ivoclar Vivadent,
Schaan, Liechtenstein), with the curing unit tip po-sitioned 8 mm from the specimen. The curing light intensity was constantly measured with a radiometer (Optilux Radiometer model-100 SDS; Demetron Kerr, Danbury, USA). VS (%) was recorded every minute for 5 min after the initiation of light activa-tion, the period during which most shrinkage oc-curs.3
Flexural strength and modulus
where
σ is the maximum center tensile stress (megapas-cals),
P is the total load causing fracture (newtons),
X = (1 + v)ln(r2 /r3)2 + [(1 − v) / 2](r 2 /r3)
2,
Y = (1 + v)[1 + ln(r1 /r3)2] + [(1 − v)(r 1 /r3)
2] and
b is the specimen thickness at fracture origin (millimeters),
in which
v is Poisson’s ratio (used v = 0.25),
r1is the radius of the support circle (millimeters),
r2 is the radius of the loaded area (millimeters) and
r3is the radius of the specimen (millimeters).
The FS and FM were calculated using SRS Biaxial Testing Software (Instron Corp., Canton, USA) and were expressed in MPa and GPa, respectively. The FS and FM data were normal and homocedastic.
Statistical analysis
The VS values were submitted to two-way re-peated measures ANOVA, while the FS and FM data were submitted to one-way ANOVA. Signiicant dif-ferences among the groups of VS, FS, and FM analy-ses were detected using Tukey’s post-hoc test (pre-set alpha of 0.05). All of the testing was performed us-ing personal statistical software (SAS 8.0 for Win-to create disc-shaped specimens with dimensions of
approximately 0.6 mm thickness and 6.0 mm diam-eter. Each specimen was covered with a Mylar strip and a microscope glass slide, after which manual pressure was applied to force the material to low into the mold. The RCs were exposed to light from the same light-curing unit for 20 s on both sides, resulting in a 40-s light exposure. Excess material was removed, and the specimen surfaces were wet ground with 1200- and 2000-grit SiC papers to cre-ate lat surfaces and adjust specimen dimensions. As such, the dimensions of all of the specimens were measured with a digital caliper (MDC-Lite, Mitu-toyo Corporation; Kanagawa, Japan) after these procedures. The discs (n = 12) were dark-stored in relative humidity for 24 h before the biaxial lexural test was performed.
The discs were individually placed into a cus-tom-made testing jig and tested for biaxial lexure strength using the piston-ring biaxial test on a uni-versal testing machine (Instron 5844, Instron Corp., Canton, USA) at 1.27 mm/min until failure. The maximum load was recorded for each specimen, and the elastic modulus was determined from the linear portion of each stress/strain curve. The fol-lowing formula for the biaxial lexural strength (σ) was used:
σ = −0.238 × 7P(X – Y) / b2,
Table 1 - Materials used in this study.
Product Composition (batch number) Composite type / filler content (volume)
Aelite LS (ALS, Bisco Inc., Schaumburg, USA) Bis-EMA; dental glass; amorphous silica (0600008366) Microhybrid / 74% Aelite Universal (AU, Bisco Inc., Schaumburg, USA) Bis-EMA; TEGDMA; glass filler; amorphous silica
(0600009124) Microhybrid / 53%
Filtek LS (3MLS, 3M ESPE, St. Paul, USA) Silane treated quartz; yttrium trifluoride; bis-3,4-epoxycyclohexylethyl-phenyl-methylsilane; 3,4-epoxycyclohexylcyclopolymethylsiloxane; mixture of epoxy-mono-silanole by-products; mixture of
epoxyfunctional di- and oligo-siloxane byproducts; mixture of alpha-substituted by-products (7AC)
Microhybrid / 55%
Heliomolar (HEL, Ivoclar Vivadent, Schaan, Liechtenstein) Bis-GMA, UDMA, decamethylendimethacrylate,
silicondioxide; ytterbiumtrifluoride, catalysts, stabilizers and pigments (H29947)
Microfilled / 46%
dows; SAS Institute Inc., Cary, USA). Post-hoc power analysis was performed to analyze the VS, FS, and FM data using additional software (Statistics 19, SPSS Inc., IBM Company, Armonk, USA).
Results
Post-hoc power analysis demonstrated a statis-tical power greater than 95% at a pre-set alpha of 0.05 for all tested variables. The LSRCs showed the lowest VS among all of the products (Table 2), while the VS of 3MLS was lower than that of ALS regard-less of the time interval (p < 0.0001). AU exhibited the highest VS values among all of the products (p < 0.0001). For all of the products, most VS oc-curred within the irst minute, followed by a signii-cant increase from 1- to 2-min intervals (p < 0.001). No signiicant difference in VS was observed be-tween 2- and 5-min intervals for any of the products, except for 3MLS, which showed further increase in VS values from 3- to 5-minute intervals (p = 0.0130).
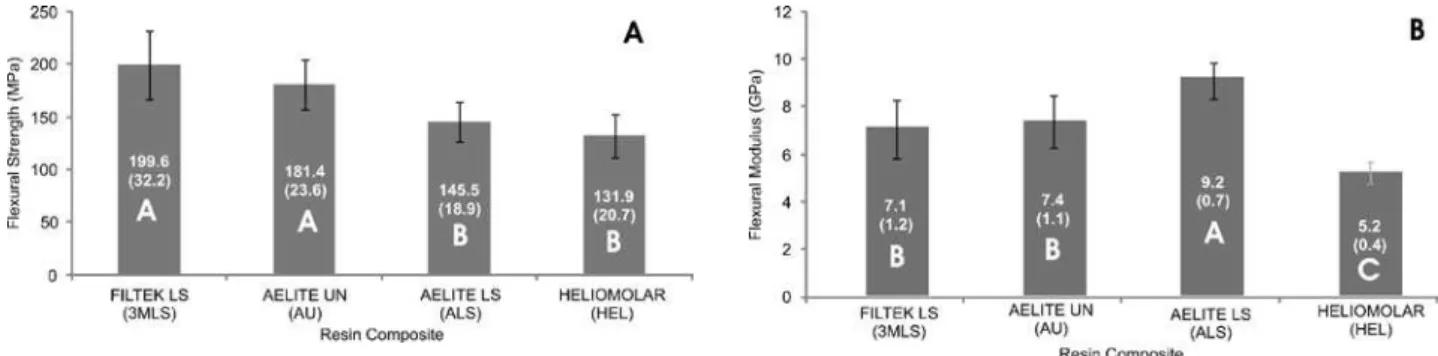
Figure 1 exhibits the FS (A) and FM (B) of all of the products. The 3MLS and AU products showed the highest FS values, while the HEL and ALS prod-ucts showed the lowest values (p < 0.0001). ALS
showed the highest FM values, while HEL exhib-ited the lowest FM values. No signiicant difference in FM was noted between 3MLS and AU, which showed FM values signiicantly higher than that of HEL and lower than that of ALS (p < 0.0001).
Discussion
The current results conirmed that the evaluated LSRCs have lower VS values than do the other RCs, although ALS exhibited higher VS than did 3MLS. Furthermore, only 3MLS exhibited similar mechani-cal properties to those observed for the regular di-methacrylate-based microhybrid composite, while ALS showed lower FS than did the microhybrid di-methacrylate-based RC. Therefore, the research hy-pothesis that ALS presents VS similar to that of the silorane-based LSRC, with FM and FS comparable to those of the regular-dimethacrylate microhybrid RC, was rejected.
With regard to the VS of both LSRCs, increased iller content in ALS was not as effective as the in-clusion of silorane monomer in 3MLS. Notably, af-ter exposure of 3MLS to light, the polymerization eficiency of the cationic ring-opening monomers
Table 2 - Means and standard deviations of the volumetric shrinkage (%) of RCs based on a 5-min analysis.
1 min 2 min 3 min 4 min 5 min
Aelite Universal (AU) 2.70 (0.14) Aa 2.97 (0.09) Ab 3.01 (0.10) Ab 3.04 (0.10) Ab 3.04 (0.12) Ab Heliomolar (HEL) 1.98 (0.09) Ba 2.27 (0.07) Bb 2.32 (0.07) Bb 2.35 (0.07) Bb 2.35 (0.09) Bb Aelite LS (ALS) 1.45 (0.11) Ca 1.60 (0.08) Cb 1.63 (0.05) Cb 1.65 (0.05) Cb 1.65 (0.10) Cb Filtek LS (3MLS) 1.02 (0.08) Da 1.27 (0.06) Db 1.33 (0.06) Dbc 1.36 (0.06) Dcd 1.36 (0.07) Dd
Means followed by different letters (capital letters within column; lower case letters within row) are significantly different.
Figure 1 - Bar graphs showing the FS (A) and FM (B) of the RCs. Different upper case letters within the bars represent
increased only after longer periods.8 As a
conse-quence, silorane-based composites achieved lower monomer conversion than did other RCs within the irst minutes after light exposure.8 These slower
po-lymerization kinetics may have also contributed to the lowest VS observed in 3MLS and also explain why only 3MLS showed continued shrinkage from 3- to 5-minute intervals after light-activation.
ALS exhibited the lowest FS among the values obtained from microilled HEL, despite its high iller fraction (88% by weight according to the manufac-turer). Composites with iller contents greater than 80% by weight have reduced fatigue resistance.22
Based on Soderholm’s theoretical determination of shrinkage stresses in composites,23 a crack will not
form as easily in an RC with low iller content as it will in a highly illed composite because the former displays higher tangential tensile stress. Moreover, in-creased iller content results in dein-creased interparticle spacing.24 Although the stress intensiication factor
(Kc) increases with a decrease in space until critical spacing is reached, Kc decreases with further iller addition after the critical volume fraction is exceed-ed,24 as stress is dissipated on the iller rather than on
the resin matrix.25 As a consequence, some
mechani-cal properties, such as tensile strength, may be com-promised, as was observed in the current study.
On the other hand, 3MLS, along with AU, also exhibited the highest FS values among all compos-ites. FS is related to the polymer type and iller con-tent regarding iller distribution and orientation.26
3MLS has quartz particles, whose spatial orienta-tion can be described as a crystalline solid network of interconnected SiO4 tetrahedra and classiied as tectosilicate. Conversely, the other tested materials consisted predominantly of glass, whose silica (SiO2) structures have an amorphous (non-crystalline) ori-entation.27 Such differences in iller composition do
not allow a reliable analysis of the effects of iller
size and shape on mechanical properties of com-mercial RCs. Moreover, because of the differences in iller composition among the products, it was not possible to distinguish the inluence of silorane monomer from the inluence of the iller particle fea-tures on the FS observed in 3MLS.
The current study evaluated the VS of LSRCs and RCs over a 5-min period. Although most of the com-posite shrinkage was observed within this interval,3
further shrinkage is expected as monomer conversion continues over a period of 24 h.28 For this reason,
the VS values reported in this study may not repre-sent the total shrinkage of each RC. Moreover, all of the mechanical properties observed in the evaluated LSRCs cannot be extrapolated to other commercially available LSRCs, as differences in monomer and ill-er composition among products may result in bettill-er or worse mechanical properties than those observed in the evaluated LSRCs. Therefore, further studies evaluating LSRCs with other compositions, as well as with different total shrinkage, are required.
Conclusion
Within the limitation of this study, and despite its lower VS than those of regular dimethacrylate based-resin composites, ALS exhibited higher volumetric shrinkage than did 3MLS. Only 3MLS showed me-chanical properties comparable to those of regular dimethacrylate-based microhybrid composite.
Acknowledgments
The authors are indebted to 3M ESPE, Bisco Inc., and Ivoclar Vivadent, for providing all of the study materials. The authors are also indebted to Cindy Oxford for her technical support and to Georgia Health Sciences University for allowing the use of the research facilities. This study was supported by grants from CNPq (474670/2006−6) and FAEPEX – UNICAMP (101/08), Brazil.
References
1. Ferracane JL. Resin-based composite performance: are there some things we can’t predict?. Dent Mater. 2013 Jan;29(1):51-8. 2. Peutzfeldt A. Resin composites in dentistry: the monomer
systems. Eur J Oral Sci. 1997 Apr;105(2):97-116.
4. Lee IB, Cho BH, Son HH, Um CM. A new method to measure the polymerization shrinkage kinetics of light cured compos-ites. J Oral Rehabil. 2005 Apr;32(4):304-14.
5. Feilzer AJ, De Gee AJ, Davidson CL. Quantitative determi-nation of stress reduction by flow in composite restorations. Dent Mater. 1990 Jul;6(3):167-71.
6. Boaro LC, Goncalves F, Braga RR. Influence of the bonding substrate in dental composite polymerization stress testing. Acta Biomater. 2010 Feb;6(2):547-51.
7. Lee MR, Cho BH, Son HH, Um CM, Lee IB. Influence of cavity dimension and restoration methods on the cusp deflec-tion of premolars in composite restoradeflec-tion. Dent Mater. 2007 Mar;23(3):288-95.
8. Palin WM, Fleming GJ, Nathwani H, Burke FJ, Randall RC. In vitro cuspal deflection and microleakage of maxillary pre-molars restored with novel low-shrink dental composites. Dent Mater. 2005 Apr;21(4):324-35.
9. Gaengler P, Hoyer I, Montag R, Gaebler P. Micromorphologi-cal evaluation of posterior composite restorations - a 10-year report. J Oral Rehabil. 2004 Oct;31(10):991-1000.
10. Ferracane JL. Resin composite--state of the art. Dent Mater. 2011 Jan;27(1):29-38.
11. Silikas N, Eliades G, Watts DC. Light intensity effects on resin-composite degree of conversion and shrinkage strain. Dent Mater. 2000 Jul;16(4):292-6.
12. Kanca J, 3rd, Suh BI. Pulse activation: reducing resin-based composite contraction stresses at the enamel cavosurface mar-gins. Am J Dent. 1999 Jun;12(3):107-12.
13. Yap AU, Soh MS. Post-gel polymerization contraction of “low shrinkage” composite restoratives. Oper Dent. 2004 Mar-Apr;29(2):182-7.
14. Weinmann W, Thalacker C, Guggenberger R. Siloranes in dental composites. Dent Mater. 2005 Jan;21(1):68-74. 15. Moraes RR, Garcia JW, Barros MD, Lewis SH, Pfeifer CS,
Liu J, et al. Control of polymerization shrinkage and stress in nanogel-modified monomer and composite materials. Dent Mater. 2011 Jun;27(6):509-19.
16. Kleverlaan CJ, Feilzer AJ. Polymerization shrinkage and con-traction stress of dental resin composites. Dent Mater. 2005 Dec;21(12):1150-7.
17. Boaro LC, Goncalves F, Guimaraes TC, Ferracane JL, Versluis A, Braga RR. Polymerization stress, shrinkage and elastic modulus of current low-shrinkage restorative composites. Dent Mater. 2010 Dec;26(12):1144-50.
18. Papadogiannis D, Tolidis K, Lakes R, Papadogiannis Y. Visco-elastic properties of low-shrinking composite resins compared to packable composite resins. Dent Mater J. 2011 30(3):350-7. 19. Leprince J, Palin WM, Mullier T, Devaux J, Vreven J, Leloup
G. Investigating filler morphology and mechanical properties of new low-shrinkage resin composite types. J Oral Rehabil. 2010 May 1;37(5):364-76.
20. Sarrett DC. Clinical challenges and the relevance of materi-als testing for posterior composite restorations. Dent Mater. 2005 Jan;21(1):9-20.
21. Ilie N, Hickel R. Investigations on mechanical behaviour of dental composites. Clin Oral Investig. 2009 Dec;13(4):427-38. 22. Htang A, Ohsawa M, Matsumoto H. Fatigue resistance of
composite restorations: effect of filler content. Dent Mater. 1995 Jan;11(1):7-13.
23. Soderholm KJ. Influence of silane treatment and filler fraction on thermal expansion of composite resins. J Dent Res. 1984 Nov;63(11):1321-6.
24. Lloyd CH, Iannetta RV. The fracture toughness of dental com-posites. I. The development of strength and fracture toughness. J Oral Rehabil. 1982 Jan;9(1):55-66.
25. Cross M, Douglas WH, Fields RP. The relationship between filler loading and particle size distribution in composite resin technology. J Dent Res. 1983 Jul;62(7):850-2.
26. Masouras K, Silikas N, Watts DC. Correlation of filler con-tent and elastic properties of resin-composites. Dent Mater. 2008 Jul;24(7):932-9.