Use of Experimental Design to Evaluate the Effect of the Incorporation of Quartzite
Residues in Ceramic Mass for Porcelain Tile Production
Karina Ruiz Silvaa* , Liszandra Fernanda Araújo Camposb, Lisiane Navarro de Lima Santanaa
Received: May 31, 2018; Revised: September 13, 2018; Accepted: October 08, 2018
The potential of using quartzite residues in the composition of an industrial ceramic mass for porcelain tile production was investigated through experimental design. Chemical, physical and microstructural analyses were accomplished to understand how the incorporation of quartzite residues
affects the material, before and after sintering. Central composite design was used to analyze the effects of firing temperature (1143; 1160; 1200; 1240; 1257ºC) and residue content (1.76; 3; 6; 9; 10.24 wt.%)
on the physical-mechanical properties of the material, and regression models correlating these factors
to the response variables linear shrinkage, water absorption, apparent density and flexural strength were adjusted. Firing temperature had statistically significant effect on the response variables, so that
the elevation of its levels contributed to the properties improvement. Residue content presented
non-significant effect. In conclusion, specimens containing quartzite residues, up to 10.24 wt.%, sintered at 1240 and 1257ºC, fulfil the ISO 13006 requirements for porcelain tiles.
Keywords: Ceramics, porcelain tile, quartzite residue, central composite design.
*e-mail: [email protected]
1. Introduction
The ornamental rock industry is based mainly on the extraction, cutting and polishing of rocks as granite, marble, slate, gneiss, quartzite and others. This type of industry produces large amounts of mineral wastes worldwide, which
are usually disposed in landfills or discarded directly into
the environment without previous treatment1-3.
The inadequate disposal of rock residues puts serious environmental and health concerns, creating necrotic conditions
for flora and fauna while, after drying, fine particles can be
deposited in the lungs of mammals via breath3.
Considering that some natural raw materials used in traditional ceramic industry derive from the decomposition of rocks, a similar mineralogical composition between them
and rock wastes should be expected. It means that residues
from ornamental rock extractive activity are good substitutes for high added-value raw materials used in the production of traditional ceramics3,4. The use of mineral wastes, after
detection of their potentialities, contributes to the diversification
of products and reduction of manufacturing costs, besides representing the conservation of non-renewable resources, energy saving and improvement in population health4,5.
Quartzite is geologically classified as a metamorphic rock,
composed almost entirely of quartz grains. The techniques used in the extraction and processing of quartzite result in
high generation of coarse and fine residues, which are non-toxic and non-hazardous, but are classified as non-inert.
Chemically, it is composed mostly of silicon oxide (SiO2),
but also of aluminum oxide (Al2O3), calcium oxide (CaO)
and alkaline oxides (K2O and Na2O) 3,6.
In recent years, the use of quartzite residues as an alternative
raw material in the production of ceramic products has been investigated. Carreiro et al.6 demonstrated the feasibility of incorporating quartzite residue in a mass that is used in the manufacture of structural ceramic products. Studies performed by Medeiros et al.7 showed that the quartzite residue can be considered as an alternative raw material for use in sanitary ware industry. Barros et al.8 demonstrated the technical
viability of the use of quartzite residues as raw materials in mortar. Torres et al.3 showed that the incorporation of quartzite
residue as a main component in red-clay-based stoneware tiles allows to obtain semi-porous ceramic bodies. However, the introduction of this type of residue in compositions used to produce porcelain tiles need to be further analyzed.
One way of analyzing the effects of introducing quartzite
residues into ceramic masses is through statistical design of experiments, which has many advantages over classical methods where one parameter is optimized at each time9.
In statistical designs, all experiments are carried out in a
planned way and the results can be evaluated systematically by means of the variance analysis10. The central composite
design comprise of integrated factorial design, group of star points for the estimation of curvature, and center points for the determination of experimental reproducibility11. The
difference in relation to the other factorial design methods is the usage of axial points defined as α values12. This tool
is widely used to establish a second-order response surface
aUnidade Acadêmica de Engenharia de Materiais, Universidade Federal de Campina Grande - UFCG,
58429-900, Campina Grande, PB, Brasil
bDepartamento de Engenharia de Materiais, Universidade Federal da Paraíba - UFPB, 58051-900,
model in process optimization studies13, and enables to gather
more data with lower number of experiments14.
The main objective of this work was to apply the
experimental design, more specifically the central composite design, to evaluate the effect of the incorporation of quartzite
residues in a ceramic mass for porcelain tile production. Using
this tool, it was studied how the factors - firing temperature and residue content - influence the physical-mechanical
properties of the material, and it was adjusted regression models correlating these factors to the response variables linear shrinkage, water absorption, apparent density and
flexural strength.
2. Experimental Procedures
The raw materials used in this study were: an industrial ceramic mass for porcelain tile production and quartzite
residues of fine and coarse particles. The mass was supplied
by a ceramic tiles company, and residues were supplied by a quartzite processing unit, both located in the State of Paraiba, Brazil.
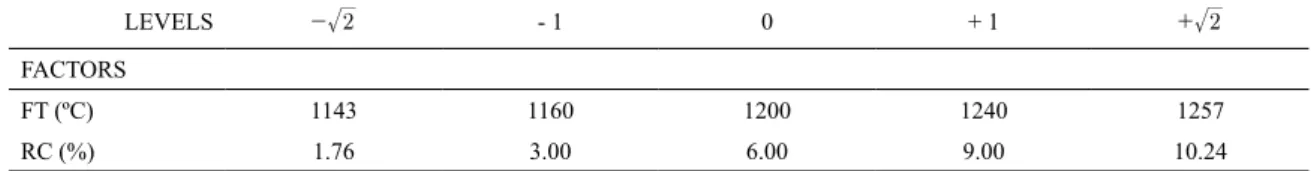
In order to evaluate the effect of firing temperature (FT) and residue content (RC) on the physical-mechanical
properties of the material, it was used factorial design 22
with 4 axial points and 2 experiments at the central point (central composite design). Table 1 presents the factors, their
levels and coded values.
The design of experiments was performed twice. At the
first time, it was studied the incorporation of fine quartzite
residue in the ceramic mass for porcelain tile production. At the second time, it was analyzed the incorporation of coarse quartzite residue, after milling process.
Initially, the coarse quartzite residue was ground in a
ball mill to reduce its particles size. All the raw materials
were sieved through an ABNT No. 200 sieve (0.075 mm)
and then subjected to chemical characterization by X-ray
fluorescence (XRF), using a Shimadzu EDX-720 energy dispersive X-ray fluorescence spectrometer.
In order to verify the changes in the mineralogical, physical and thermal profiles of the porcelain ceramic
mass, caused by the incorporation of quartzite, the pure
mass and selected mixtures containing up to 10.24 wt.% of fine residue and milled coarse residue were characterized by the following techniques: X-ray diffraction (XRD), using a Shimadzu Lab XRD-6000 X-ray diffractometer equipped with a CuKα radiation tube, operating at a 2θ scan angle of 5-40º, scan speed of 2º/min and step size of
0,02º; particle size analysis (PSA), using a Cilas 1064-LD particle size analyzer; differential thermal analysis (DTA) and thermogravimetric analysis (TGA), using a TA Instruments SDT thermal analyzer, at a maximum temperature of 1270ºC and heating rate of 12.5ºC/min.
After complete homogenization via dry process, the
mixtures had the adjust of their moisture contents (~ 6%), and then were passed through an ABNT No. 40 sieve (0.425 mm) and remained at rest for 24 hours. The porcelain formulations were pressed into rectangular test specimens (approximate dimensions of 20 mm x 7 mm x 60 mm), under a pressure of 50 MPa, using a Marcon MPH-30 uniaxial hydraulic press. The resulting test specimens were oven-dried at 110ºC for 24 hours and then heat-treated in an INTI electric furnace, equipped with a Flyever FE50RPN temperature controller (accuracy of ± 2ºC), applying a heating rate of 49ºC/min and a 2-min hold time at the maximum firing temperature. The cooling rate was 50ºC/min. Chosen parameters for laboratory-scale firing cycle were adapted from parameters
used in industry.
The following physical-mecanical properties were evaluated: linear shrinkage, water absorption, apparent density and mechanical strength. Linear shrinkage values were determined from the linear dimensional variation of sintered specimens. Water absorption and apparent density values were determined according to the Archimedes method, using water at room temperature as immersion
fluid. Lastly, 3-point flexural strength tests were performed using a Shimadzu AG-X universal test machine, equipped
with a Shimadzu load cell, type SPL - 10 kN, with a capacity
of 10 kN, operating at 0.5 mm/min speed of applied force. The crystalline phases of selected fired samples were analyzed by XRD technique and identified using the Untitled XRD search/match tool for Qualitative Analysis, and the JCPDS powder diffraction files contained in the PCPDFWIN database of the Shimadzu XRD-6000 software. The fracture surfaces
of the same samples was morphologically characterized by
scanning electron microscopy (SEM) using a Shimadzu SSX
microscope, in the secondary electrons mode.
3. Results and Discussion
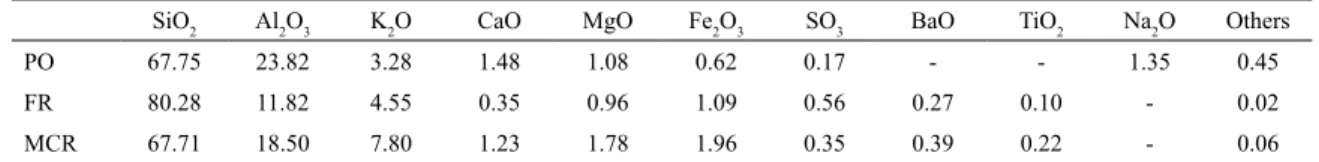
Table 2 describes the chemical composition of the raw
materials: ceramic mass for porcelain tile production (PO), fine quartzite residue (FR) and milled coarse quartzite residue (MCR). The ceramic mass is composed mostly of silica (SiO2) and alumina (Al2O3), which together correspond
Table 1. Analyzed factors (FT – Firing temperature; RC – Residue content), their levels and coded values.
LEVELS - 2 - 1 0 + 1 + 2
FACTORS
FT (ºC) 1143 1160 1200 1240 1257
to approximately 91.57%, but also presents a significant amount of fluxing oxides (K2O, Na2O) and auxiliary fluxing
oxides (CaO, MgO, Fe2O3). Silica is commonly found in
several mineralogical clayey and non-clayey phases, such as kaolinite, mica, feldspar and quartz, which corresponds to its purest natural form. Alumina is also usually associated with some of these mineralogical phases6. Potassium (K2O) and
sodium (Na2O) oxides generally come from feldspars and
micas, while calcium (CaO) and magnesium (MgO) oxides
may be associated with minerals such as dolomite. The small
content found for iron oxide (Fe2O3) is an essential factor
for the production of white ceramics, since it can develop a reddish colour in products during sintering15. The chemical composition of the quartzite residues, FR and MCR, indicates that silica is the predominant oxide in both, followed by alumina. The high SiO2 and Al2O3 contents (80.28% SiO2
and 11.82% Al2O3 for FR; 67.71% SiO2 and 18.50% Al2O3
for MCR) are typical of ornamental metamorphic rocks16.
In smaller proportions, there are fluxing oxides, normally
present in quartzite residues as impurities in the form of feldspar and micaceous mineral16. Both residues come from
the sawing of the quartzite blocks. However, the difference
in their chemical compositions, mainly for SiO2 contents, is probably related to the sieving process that occurred
during the preparation of the raw materials. The entire fine
fraction passed through the 200 mesh sieve. On the other hand, the coarse fraction, even after being subjected to the milling process, did not completely pass through the 200 mesh sieve, so that the harder and coarser particles were retained. Other researchers who studied the incorporation
of different types of ornamental rock residues into ceramic
masses detected silica and alumina contents similar to those found in this work3,6,16,17.
Fig. 1 shows the XRD spectra of the porcelain ceramic mass and compositions with 10.24 wt.% of the quartzite
residues, FR and MCR. These compositions were selected since they present the highest residue content studied in this
work. For the pure ceramic mass, it is verified the presence of the following mineralogical phases: kaolinite (JCPDS: 89-6538), dolomite (JCPDS: 89-5862), feldspar (JCPDS: 89-8574), mica (JCPDS: 83-1808) and quartz (JCPDS: 46-1045). For compositions containing quartzite residues,
these same crystalline phases are observed, in addition to the
microcline (JCPDS: 19-0932), which is a potassic feldspar. It can also be seen that the incorporation of both residues, up to 10.24 wt.%, caused an increase in the intensity of the
quartz peaks, mainly for the composition with fine residue. For the other crystalline phases, only small differences in intensity of the diffraction peaks are observed.
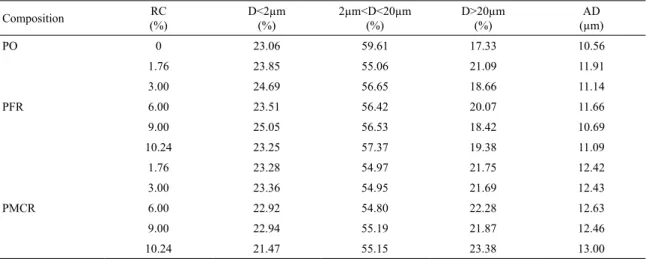
Table 3 shows the particle size distribution of the porcelain
ceramic mass and compositions with fine quartzite residue (PFR) and milled coarse quartzite residue (PMCR). For each composition, it is presented the average diameter (AD) and the volumetric fraction for diameters (D) below 2 µm, between 2 and 20 µm and above 20 µm. The clay fraction (D < 2 µm) present in the porcelain ceramic mass is 23.06%, while the silt (2 µm < D < 20 µm) and sand (D > 20 µm) fractions correspond respectively to 59.61 and 17.33%. For
all studied compositions, it is observed that clay fractions are similar to each other and quite close to the value found for the pure ceramic mass. However, the introduction of residues in the mass caused a decrease in the values of the silt fraction
(ranging from 55.06 to 57.37% for compositions with fine residue; and from 54.80 to 55.19% for compositions with milled coarse residue) and increase in the values of the sand fraction (ranging from 18.42 to 21.09% for compositions with fine residue; and from 21.69 to 23.38% for compositions with milled coarse residue). The correlation between AD values
of the porcelain ceramic mass and of the other compositions
reveals that the incorporation of fine residue contributed to an average increase of approximately 7.00% in the mass AD,
whereas the incorporation of milled coarse residue caused
a much more significant average elevation on it, which was approximately 19.20%.
Fig. 2 shows the thermal analysis (TGA - thermogravimetric analysis and DTA - differential thermal analysis) of the porcelain ceramic mass and compositions with 10.24 wt.% of
the quartzite residues, FR and MCR. These compositions were chosen since they present the highest residue content studied
in this work. The DTA curve of the ceramic mass presents
four endothermic peaks and two discrete exothermic peaks.
The first endothermic peak occurs at ~50ºC and corresponds
to the release of the free and adsorbed water, resulting in a
mass loss of approximately 1.08 wt.%. The second occurs at ~512ºC and is attributed to the dehydroxylation of clay
minerals present in the sample, such as kaolinite, resulting
in a mass loss of approximately 4.73 wt.%. The removal
of the structural hydroxyls from kaolinite occurs through reorganization of its octahedral layer in a tetrahedral
configuration, giving rise to metakaolinite18. Other researchers
observed the same event at ~448.8ºC19, ~520ºC3, ~528.7ºC20,
and at ~553ºC18. The small endothermic peak at ~576ºC
Table 2. Chemical composition of the raw materials (%): Ceramic mass for porcelain tile (PO); Fine quartzite residue (FR); Milled coarse quartzite residue (MCR).
SiO2 Al2O3 K2O CaO MgO Fe2O3 SO3 BaO TiO2 Na2O Others
PO 67.75 23.82 3.28 1.48 1.08 0.62 0.17 - - 1.35 0.45
FR 80.28 11.82 4.55 0.35 0.96 1.09 0.56 0.27 0.10 - 0.02
Figure 1. XRD spectra of the porcelain ceramic mass and compositions with 10.24 wt.% of quartzite residues, FR and MCR. D - Dolomite; F - Feldspar; K - Kaolinite; M - Mica; R - Microcline; Q - Quartz.
Table 3. Average diameter (AD) and volumetric fraction for diameters (D) below 2 µm, between 2 and 20 µm and above 20 µm, for the porcelain ceramic mass (PO) and compositions with fine quartzite residue (PFR) and milled coarse quartzite residue (PMCR).
Composition (%)RC D<2µm (%) 2µm<D<20µm (%) D>20µm (%) (µm)AD
PO 0 23.06 59.61 17.33 10.56
PFR
1.76 23.85 55.06 21.09 11.91
3.00 24.69 56.65 18.66 11.14
6.00 23.51 56.42 20.07 11.66
9.00 25.05 56.53 18.42 10.69
10.24 23.25 57.37 19.38 11.09
PMCR
1.76 23.28 54.97 21.75 12.42
3.00 23.36 54.95 21.69 12.43
6.00 22.92 54.80 22.28 12.63
9.00 22.94 55.19 21.87 12.46
10.24 21.47 55.15 23.38 13.00
Figure 2. Thermogravimetric analysis (TGA) and differential thermal analysis (DTA) of the porcelain ceramic mass and compositions with 10.24 wt.% of quartzite residues,
FR and MCR.
is attributed to the polymorphic transformation of α - β
quartz19,20. The fourth and last endothermic peak, at ~670ºC, is ascribed to a rapid transition reaction probably triggered by the onset of clay sintering and changes in the crystalline structure21. The two discrete exothermic peaks, at ~990ºC
and ~1055ºC, are associated with spinel phase formation
and mullite nucleation. These results are in agreement with
previous studies, which suggest the spinel formation and/or mullite nucleation at ~980ºC3, ~989.9ºC19 and ~999.6ºC18.
The DTA curve of the composition with 10.24 wt.% of fine residue follows exactly the same behavior presented by
peaks at temperatures of ~45ºC, ~508ºC, ~580ºC and ~660ºC, and a discrete exothermic peak at ~995ºC. In this case, the
release of the free and adsorbed water resulted in a mass
loss of approximately 0.88 wt.% while the dehydroxylation
of clay minerals present in the sample resulted in a mass
loss of approximately 4.47 wt.%. In relation to the DTA curve of the composition containing 10.24 wt.% of milled
coarse residue, it also follows the same behavior of the pure ceramic mass, presenting endothermic peaks at
temperatures of ~50ºC, ~520ºC, ~580ºC and ~700ºC, and a small exothermic peak at ~990ºC. The release of the free
and adsorbed water resulted in a mass loss of approximately
1.10 wt.% and the dehydroxylation of clay minerals, in a mass loss of approximately 4.51 wt.%. These results indicate
that the elevation of quartz content in the compositions with quartzite residues caused a slight decrease in the mass loss
of them, mainly for PO + 10.24 wt.% FR, which presented the quartz peaks with greater intensity (Fig. 1). This happens
because the elevation in quartz content leads to a proportional decrease in the content of clay minerals.
Table 4 lists the values of the dependent variables: linear shrinkage (LS), water absorption (WA), apparent density (AD) and 3-point flexural strength (FS) of porcelain specimens containing fine quartzite residue (PFR) and milled coarse quartzite residue (PMCR). All of them were prepared
according to the experimental planning matrix, obtained with the aid of the software Statistica 7.0.
With the results observed for LS, WA, AD and FS, it
was possible to obtain regression equations correlating these
dependent variables with the firing temperature (FT) factor. In
order to build the mathematical models, only the factors that
had statistically significant effects on the studied variables, at the level of 95% confidence, were considered. Therefore, the residue content (RC) factor was not added in the equations since it did not present statistically significant effects. The mathematical models are presented by Equations (1) to (8).
(1) (2) (3) (4) (5) (6) (7) (8)
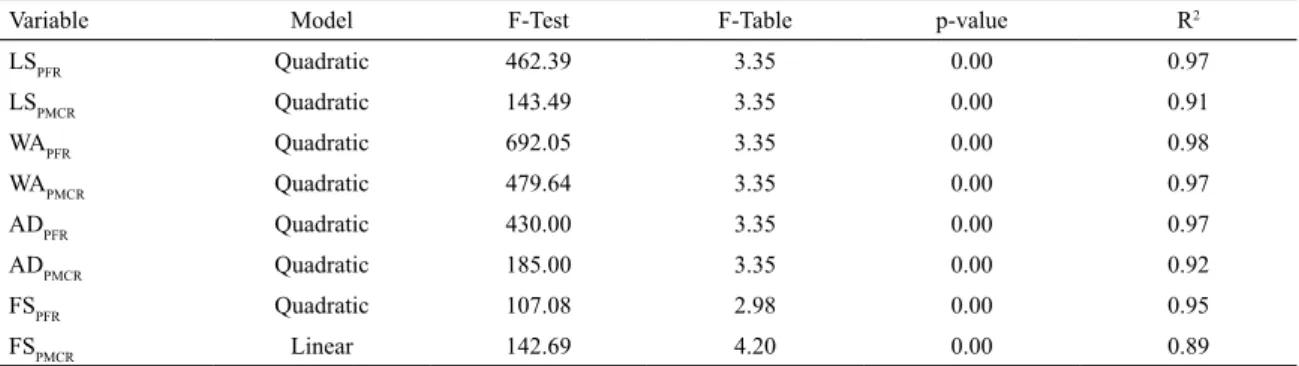
Table 5 shows the main statistical parameters of mathematical models: F-test, p-value and coefficient of
determination R2. It is verified that all proposed models have
statistical significance, at the 95% confidence level, since the p-value < 0.05 and F-test > F-table for each of them22.
The high values of R2 indicate that the adjusted models do
not present considerable variability.
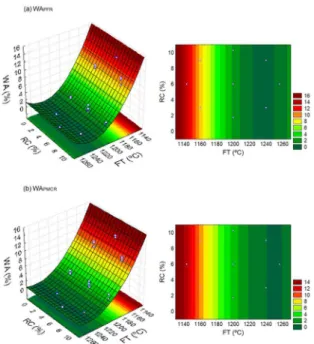
Fig. 3 to 6 show, respectively, the response surfaces of the variables LS, WA, AD and FS, obtained from Equations (1) to (8). Basically, they are the graphical representation of
the mathematical models proposed for each of the studied variables.
The linear shrinkage indicates the degree of densification
during sintering, and is very important for the dimensional
control of the finished ceramic products16. In Fig. 3, it can
be noticed a progressive increase in the linear shrinkage values as the sintering temperature is increased. For both compositions, PFR and PMCR, it is observed an increase of
approximately 6% in the linear shrinkage values when the firing temperature is elevated from 1143 to 1240ºC. Above 1240ºC, no more changes were observed in the values of the LS variable. During firing, at temperatures of about 900-1000ºC, an important quantity of liquid phase begins to
form23. As firing temperature rises, especially from 1170ºC, a
greater amount of liquid phase is produced and liquid-phase viscosity decreases. This facilitates the elimination of pores, thereby increasing shrinkage24.
Water absorption is an important physical property, since it is related to the microstructure of the sintered ceramic matrix and determines the open porosity level of the pieces19.
In Fig. 4, it is verified that the increase of firing temperature up to 1240ºC caused a reduction of approximately 12% in
the water absorption for the PFR and PMCR compositions, making its values very close to zero. By the capillary action and surface tension, the glassy phase formed during
sintering infiltrates the open pores of the structure and causes densification of the ceramic pieces16. According to the
international standard ISO 1300625, porcelain tiles are ceramic
tiles with water absorption equal to or less than 0.5% (WA ≤ 0,5%). Thus, in the present study, compositions with up to 10.24 wt.% of quartzite residues, FR and MCR, which were sintered at 1240ºC and 1257ºC, are classified as porcelain
tiles. According to the same standard, the compositions
sintered at 1200ºC can be classified as stoneware (0.5% < WA ≤ 3.0%), those sintered at 1160ºC can be classified as semi-porous (6.0% < WA ≤ 10,0% ), and those sintered at 1143ºC as porous (AA > 10.0%).
% . .
.
LS FT
FT
1064 6263 1 7253
0 0007
. .
.
PFR 93 3737 0 1557
0 0001 2 = - + -! ! ! Q Q Q Q Q Q V V V V V V % . . . LS FT FT
702 1958 1 1221
0 0004
. .
.
PMCR 153 5375 0 2560
0 0001 2 = - + -! ! ! Q Q Q Q Q Q V V V V V V % . . . WA FT FT
2317 7587 3 7478
0 0015
. .
.
PFR 141 6561 0 2362
0 0001 2 = -+ ! ! ! Q Q Q Q Q Q V V V V V V % . . . WA FT FT
1691 7703 2 7060
0 0011
. .
.
PMCR 160 2797 0 2673
0 0001 2 = -+ ! ! ! Q Q Q Q Q Q V V V V V V . . .
AD g cm FT
FT
76 8864 0 1276
0 0001
. .
.
PFR
3
6 9570 0 0116
0 0000 2 = - + -! ! ! R Q Q Q Q Q V W V V V V . . .
AD g cm FT
FT
52 8866 0 0878
0 0003
. .
.
PMCR
3
10 6955 0 0178
0 0000 2 = - + -! ! ! R Q Q Q Q Q V W V V V V . . .
FS MPa FT
FT
3700 4440 5 8330
0 0023
. .
.
PFR 1261 3290 2 1035
0 0009 2 = - + -! ! ! Q Q Q Q Q Q V V V V V V . .
Apparent density is a physical property that permits to evaluate the sintering status of the material and anticipates the
microstructure of the final product3. In Fig. 5, it can be seen
the great evolution of the apparent density values, which tend
to systematically increase with firing temperature increasing.
For both compositions, PFR and PMCR, the elevation of
firing temperature from 1143 to 1240ºC caused an increase of approximately 0.5 g/cm3 in the apparent density of the
material. Above 1240ºC, no more changes were observed in the values of the AD variable. Therefore, at this temperature, was reached the maximum densification (~2.4 g/cm3). This
behavior is in good agreement with the observed linear
shrinkage and water absorption values (Fig. 3 and Fig. 4).
Table 4. Values of linear shrinkage (LS), water absorption (WA), apparent density (AD) and 3-point flexural strength (FS), obtained for compositions with fine quartzite residue (PFR) and compositions with milled coarse quartzite residue (PMCR).
Factors Dependent variables
Samples (ºC)FT (%)RC (%)LS WA (%) (g/cmAD3)
FS
(MPa)
PFR1 1160 3.00 3.67; 3.43; 3.83 8.37; 9.11; 8.52 2.06; 2.03; 2.05 32.29; 32.00
PFR2 1160 9.00 3.53; 3.34; 4.29 10.15; 10.50; 8.43 2.00; 1.99; 2.05 29.03; 29.40
PFR3 1240 3.00 8.56; 8.92; 8.56 0.08; 0.08; 0.00 2.40; 2.41; 2.42 71.52; 67.04
PFR4 1240 9.00 9.05; 9.42; 9.17 0.08; 0.08; 0.00 2.41; 2.41; 2.41 70.83; 70.39
PFR5 1143 6.00 2.26; 2.20; 2.26 12.22; 12.68; 12.56 1.94; 1.93; 1.93 25.48; 25.66
PFR6 1257 6.00 8.50; 8.68; 9.03 0.08; 0.00; 0.00 2.38; 2.39; 2.40 65.31; 66.38
PFR7 1200 1.76 7.81; 7.61; 7.73 1.30; 1.54; 1.16 2.34; 2.33; 2.35 49.01; 51.86
PFR8 1200 10.24 7.57; 6.86; 7.75 1.53; 2.01; 1.22 2.32; 2.29; 2.34 44.07; 49.37
PFR9 1200 6.00 8.33; 7.40; 8.42 1.07; 1.98; 0.84 2.36; 2.29; 2.37 62.34; 57.03
PFR10 1200 6.00 7.64; 7.68; 6.83 1.77; 1.96; 2.88 2.31; 2.30; 2.24 54.46; 57.22
PMCR1 1160 3.00 2.39; 2.78; 3.15 8.19; 9.69; 9.36 2.12; 2.02; 2.03 31.05; 32.39
PMCR2 1160 9.00 2.54; 2.83; 2.87 10.03; 9.29; 9.78 2.01; 2.03; 2.02 28.60; 28.66
PMCR3 1240 3.00 8.26; 8.33; 8.58 0.23; 0.08; 0.00 2.01; 1.94; 1.95 70.99; 70.03
PMCR4 1240 9.00 8.15; 8.17; 8.20 0.16; 0.00; 0.01 2.37; 2.36; 2.33 68.62; 65.16
PMCR5 1143 6.00 2.71; 1.69; 1.92 10.15; 12.49; 12.00 2.27; 2.28; 2.26 24.35; 21.18
PMCR6 1257 6.00 7.60; 7.71; 7.41 0.00; 0.00; 0.00 2.28; 2.31; 2.28 61.35; 60.54
PMCR7 1200 1.76 6.84; 6.90; 4.33 2.51; 2.14; 3.10 2.28; 2.31; 2.24 48.68; 43.78
PMCR8 1200 10.24 6.57; 6.85; 5.23 2.24; 1.79; 3.55 2.28; 2.31; 2.22 40.22; 40.29
PMCR9 1200 6.00 6.37; 7.02; 5.82 2.30; 1.79; 2.88 2.01; 1.94; 1.95 39.58; 36.97
PMCR10 1200 6.00 6.57; 7.01; 5.50 2.18; 1.74; 3.59 2.37; 2.36; 2.33 46.39; 49.92
Table 5. Relevant statistics for the analysis of variance of the mathematical models that describe the variables LS, WA, AD and FS, for
PFR and PMCR compositions.
Variable Model F-Test F-Table p-value R2
LSPFR Quadratic 462.39 3.35 0.00 0.97
LSPMCR Quadratic 143.49 3.35 0.00 0.91
WAPFR Quadratic 692.05 3.35 0.00 0.98
WAPMCR Quadratic 479.64 3.35 0.00 0.97
ADPFR Quadratic 430.00 3.35 0.00 0.97
ADPMCR Quadratic 185.00 3.35 0.00 0.92
FSPFR Quadratic 107.08 2.98 0.00 0.95
FSPMCR Linear 142.69 4.20 0.00 0.89
From the careful observation of the Fig. 3 to 5, it is
possible to notice that PFR compositions presented slightly
better LS, WA and AD values for the firing temperatures of 1143, 1160 and 1200ºC, in comparison to the PMCR
compositions. The chemical composition of the milled coarse
quartzite residue (Table 2) reveals appreciable contents of alkaline fluxes, which tends to accelerate the formation of a viscous liquid phase that fills the pores and promotes the densification of the material16. However, its particle
size distribution disfavors this process. Coarser particles
participate in chemical reactions with greater difficulty, due to the smaller specific surface area presented by them,
tiles depends on the factors that affect the amount and size of mullite needles, like the firing temperature29. In addition,
it can also be observed that the compositions with fine
residue presented a slightly better mechanical performance in relation to those with milled coarse residue. Considering that the quartzite residues are composed mostly of quartz, the described behavior can be explained by Bragança et al.26. According to the researchers, the size of quartz particles is
a factor of great influence on the mechanical strength of
Figure 3. Response surface of the variable LS, for the compositions:
(a) PFR and (b) PMCR.
Figure 4. Response surface of the variable WA, for the compositions:
(a) PFR and (b) PMCR.
In Fig. 6, it is verified that the flexural strength of both
compositions, PFR and PMCR, increased approximately
50 MPa with the elevation of the firing temperature from 1143 to 1257ºC. Studies carried out by Martín-Marquez et
al.27 and Martín-Marquez et al.28 suggest that the mechanical
strength of porcelain tiles is related to the decrease in porosity of the material, but also to the formation of mullite during
sintering. Specifically, the higher the mullite content and the
higher the interlocking of mullite needles, the higher is the
flexural strength. Hence, the flexural strength of porcelain
Figure 5. Response surface of the variable AD, for the compositions: (a) PFR and (b) PMCR.
Figure 6. Response surface of the variable FS, for the compositions:
porcelain tiles. These particles should be dissolved into the liquid phase during sintering until a saturation limit is reached, so that the dissolution comes to end. However, the dissolution rate of quartz is size-dependent. Thus, it is
expected that fine particles be dissolved at a higher rate and disappear faster than coarse particles, which often only suffer
size reduction but not dissolve. Moreover, larger particles that do not completely dissolve in the liquid phase can act as defects in the microstructure of the porcelain tile and, in this way, favor its fracture when it is under tension. Besides that, the presence of residual quartz particles in the sintered ceramic pieces can be detrimental to their resistance due
to the polymorphic transformation of α - β quartz during
cooling29. The international standard ISO 1300625 establishes
that porcelain tiles must present flexural strength equal to or greater than 35 MPa. This criteria was satisfied for
compositions with up to 10.24 wt.% of the quartzite residues, FR and MCR, sintered at temperatures higher than 1200ºC.
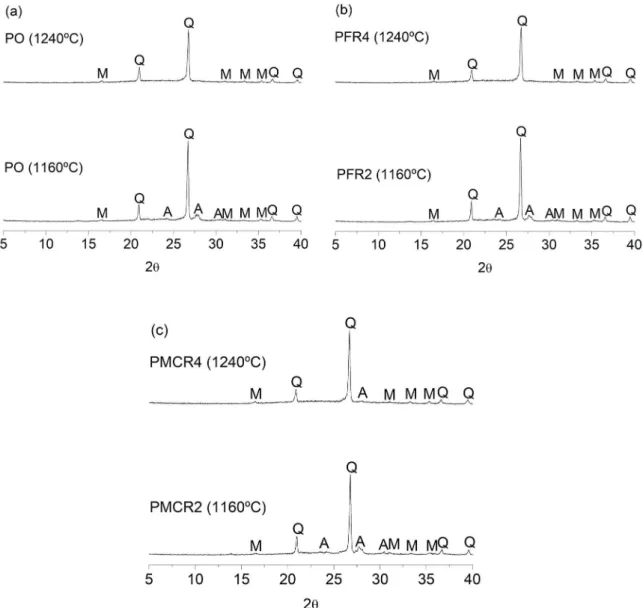
Fig. 7 shows the XRD spectra of the pieces produced from the pure ceramic mass (PO) and from the compositions with 9 wt.% of fine residue (PFR2 and PFR4) and 9 wt.% of milled coarse residue (PMCR2 and PMCR4), sintered at temperatures of 1160 and 1240ºC. For the pure porcelain tile sintered at 1160ºC, it is verified the presence of the following mineralogical phases: anorthite (JCPDS: 89-1462), mullite (JCPDS: 79-1275) and quartz (JCPDS: 46-1045),
predominantly the two last. The presence of anorthite is due to the rapid and favorable chemical reaction that occurs
between calcium oxide (CaO), present in all raw materials,
and the metakaolinite resulting from the dehydroxylation of kaolinite30. However, when the firing temperature was raised
to 1240ºC, this crystalline phase disappeared completely,
Figure 7. XRD spectra of pieces produced from: (a) ceramic mass for porcelain tile (PO); (b) composition with 9 wt.% of fine quartzite
residue (PFR2, PFR4); (c) composition with 9 wt.% of milled coarse quartzite residue (PMCR2, PMCR4); sintered at 1160 and 1240ºC.
remaining the mullite and the quartz. The persistent presence of quartz, even at higher temperatures, is the result of its slow dissolution kinetics31.
It is observed that the XRD spectra of the pieces PFR2 and PFR4 exhibit peaks of the same crystalline phases
which were presented by the pure porcelain tile, sintered at
the temperatures of 1160 and 1240ºC, respectively. There is also great similarity in peaks intensity. It means that the incorporation of fine quartzite residue in the ceramic mass did not affect the mineralogical profile of the sintered material. In relation to the composition with milled coarse residue, it is verified that PMCR2 presents the same mineralogical phases as pure porcelain tile sintered at 1160ºC. However,
the anorthite phase does not completely disappear when
the material is sintered at 1240ºC (PMCR4). In this case,
the presence of anorthite at higher temperatures is due to the chemical composition of the coarse quartzite residue, which presents a higher CaO content when compared to
the fine residue, resulting in a higher production of this crystalline phase and, consequently, in a greater difficulty in dissolving it completely. In addition, it can be noticed that the quartz peaks presented by the piece PMCR4 are more intense than those presented by the PRF4 and by the pure porcelain sintered at 1240ºC. This behavior is attributed to
the dissolution kinetics of coarser quartz particles, which
is even slower than for finer particles.
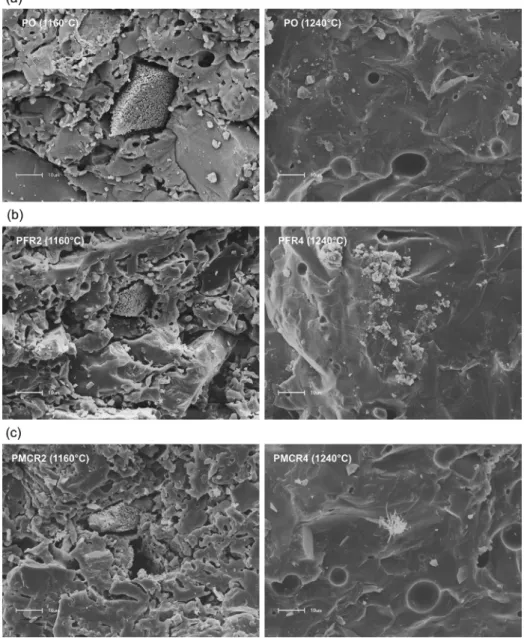
Fig. 8 shows SEM micrographs of the fracture surfaces
of pieces produced from the pure porcelain ceramic mass
(PO) and from the compositions with 9 wt.% of fine quartzite residue (PFR2 and PFR4) and 9 wt.% of milled coarse quartzite
Figure 8. SEM micrographs of the fracture surface of pieces produced from: (a) ceramic mass for porcelain
residue (PMCR2 and PMCR4), sintered at temperatures of 1160 and 1240ºC. All the ceramic pieces that were sintered at 1160ºC have microstructures very similar to each other, totally
irregular and highly porous, containing cracks and particles
of different sizes and shapes. It is observed the existence of
some agglomerates that stand out in the middle of the matrix due to its rougher aspect. They can be associated with the
anorthite phase, previously revealed by XRD analyzes. Other
researchers found structures very similar to these, present in
porcelain stoneware bodies sintered at 1100ºC28. The pieces
sintered at 1240ºC present microstructures with high degree of densification, containing some closed pores, which are
characterized by the spherical shape, large and isolated32.
The great similarity observed between the microstructures of pure porcelain tile and of compositions with quartzite residues, FR and MCR, indicates that the incorporation of
these two types of residue did not affect the morphological profile of the material when it was submitted to different firing temperatures.
4. Conclusions
The quartzite residues, FR and MCR, present adequate chemical and mineralogical properties so that they can be incorporated in a ceramic mass for porcelain tile production.
The incorporation of both residues, up to 10.24 wt.%, did not cause significant changes in the particle size distribution and in the thermal profile of the ceramic mass.
The use of central composite design to evaluate the
effects of firing temperature and residue content on the
physical-mechanical properties of the material, was adequate for ceramic mass for porcelain tile, and it was possible to
obtain statistically significant mathematical models, which
correlate the factors FT and RC with the dependent variables
LS, WA, AD and FS.
The firing temperature had statistically significant effect on all the investigated response variables, so that the
elevation of its levels contributed to the improvement of the studied properties: linear shrinkage, water absorption,
apparent density and 3-point flexural strength. On the other
hand, the residue content, in the studied range, did not
generate significant effects. It means that the incorporation of quartzite residues, with different particle sizes, did not affect the physical-mechanical properties of the material,
making possible its use as a non-plastic raw material in porcelain tile production.
The compositions with fine quartzite residue presented
a slightly better performance than those with milled coarse residue.
Considering that the international standard ISO 1300616
classifies porcelain tiles as ceramic tiles that present water absorption equal to or less than 0.5% and flexural strength equal to or greater than 35 MPa, fall into this category the
compositions with up to 10.24 wt.% of fine and milled coarse quartzite residues, which were sintered at 1240ºC and 1257ºC.
The experimental results showed that the incorporation of residues from the extraction and processing of quartzite in ceramic mass for porcelain tile production presents itself as an environmental and technological solution.
5. Acknowledgments
Authors acknowledge financial support received from CAPES and CNPq (proc. 447881/2014-0 and 308912/2016-0),
Brazil.
6. References
1. Raupp-Pereira F, Hotza D, Segadães AM, Labrincha JA.
Ceramic formulations prepared with industrial wastes and natural sub-products. Ceramics International.
2006;32(2):173-179.
2. Silva MA, Paes HF Jr, Holanda JNF. Reuse of ornamental
rock-cutting waste in aluminous porcelain. Journal of Environmental Management. 2011;92(3):936-940.
3. Torres P, Manjate RS, Quaresma S, Fernandes HR, Ferreira
JMF. Development of ceramic floor tile compositions based
on quartzite and granite sludges. Journal of the European Ceramic Society. 2007;27(16):4649-4655.
4. Junkes JA, Prates PB, Hotza D, Segadães AM. Combining
mineral and clay-based wastes to produce porcelain-like ceramics: An exploratory study. Applied Clay Science.
2012;69:50-57.
5. Pinheiro BCA, Holanda JNF. Obtainment of porcelain floor
tiles added with petroleum oily sludge. Ceramics International.
2013;39(1):57-63.
6. Carreiro MEA, Santos RC, Silva VJ, Lira HL, Neves GA, Menezes RR, et al. Residue of quartzite - alternative
raw material for use in structural ceramics. Cerâmica.
2016;62(362):170-178.
7. de Medeiros PSS, Santana LNL, Silva VJ, Neves GA, Lira HL. Evaluation of the Potential of Using Quartzite Residue
in Mass for the Production of Sanitary Ware. Materials Science Forum. 2016;869:181-185.
8. Barros SVA, Marciano JEA, Ferreira HC, Menezes RR, Neves GA. Addition of quartzite residues on mortars: Analysis of
the alkali aggregate reaction and the mechanical behavior.
Construction and Building Materials. 2016;118:344-351.
9. Montgomery DC. Design and Analysis of Experiments. New
York: John Wiley & Sons; 1991.
10. Naik PK, Reddy PSR, Misra VN. Optimization of coal flotation
using statistical technique. Fuel Processing Technology.
2004;85(13):1473-1485.
11. Lamarra J, Rivero S, Pinotti A. Design of chitosan-based
nanoparticles functionalized with gallic acid. Materials Science
and Engineering: C. Materials for Biological Applications.
12. Jensen DR. Efficiency comparisons of central composite
designs. Journal of Statistical Computation and Simulation.
1995;52(2):177-183.
13. Mehrabani JV, Noaparast M, Mousavi SM, Dehghan R, Ghorbani A. Process optimization and modelling of sphalerite flotation
from a low-grade Zn-Pb ore using response surface methodology.
Separation and Purification Technology. 2010;72(3):242-249.
14. Aslan N. Application of response surface methodology and central composite rotatable design for modeling the influence of some operating variables of a Multi-Gravity Separator for
coal cleaning. Fuel. 2007;86(5-6):769-776.
15. Torres P, Fernandes HR, Olhero S, Ferreira JMF. Incorporation
of wastes from granite rock cutting and polishing industries to produce roof tiles. Journal of the European Ceramic Society.
2009;29(1):23-30.
16. Moreira JMS, Manhães JPVT, Holanda JNF. Processing of
red ceramic using ornamental rock powder waste. Journal of Materials Processing Technology. 2008;196(1-3):88-93. 17. Taguchi SP, Santos JC, Gomes TM, Cunha NA. Evaluation
of technological properties of red ceramics incorporated with dimension stone waste from diamond wire loom. Cerâmica.
2014;60(354):291-296.
18. da Silva VJ, da Silva MF, Gonçalves WP, de Menezes RR, Neves GA, Lira HL, et al. Porous mullite blocks with compositions
containing kaolin and alumina waste. Ceramics International.
2016;42(14):15471-15478.
19. Ke S, Wang Y, Pan Z, Ning C, Zheng S. Recycling of polished
tile waste as a main raw material in porcelain tiles. Journal of Cleaner Production. 2016;115:238-244.
20. Lerdprom W, Chinnam RK, Jayaseelan DD, Lee WE. Porcelain
production by direct sintering. Journal of the European Ceramic Society. 2016;36(16):4319-4325.
21. Gonçalves WP, Silva VJ, Menezes RR, Neves GA, Lira HL,
Santana LNL. Microstructural, physical and mechanical behavior of pastes containing clays and alumina waste. Applied Clay Science. 2017;137:259-265.
22. Campos LFA, Menezes RR, Lisboa D, Santana LNL, Neves GA, Ferreira HC. Experimental design to maximize the waste content
in ceramic bricks and tiles. Cerâmica. 2007;53(328):373-380.
23. Amorós JL, Orts MJ, García-Ten J, Gozalbo A, Sánchez E. Effect of the green porous texture on porcelain tile properties. Journal of the European Ceramic Society.
2007;27(5):2295-2301.
24. Gültekin EE, Topates G, Kurama S. The effects of sintering
temperature on phase and pore evolution in porcelain tiles.
Ceramics International. 2017;43(14):11511-11515.
25. International Organization for Standardization (ISO). ISO 13006 - Ceramic tiles - Definitions, classification, characteristics and marking. Geneva: ISO; 1998.
26. Bragança SR, Bergmann CP. Production of bone porcelain
and characterization of its technical properties. Cerâmica.
2006;52(322):205-212.
27. Martín-Márquez J, Rincón JM, Romero M. Effect of microstructure
on mechanical properties of porcelain stoneware. Journal of the European Ceramic Society. 2010;30(15):3063-3069. 28. Martín-Márquez J, Rincón JM, Romero M. Mullite development
on firing in porcelain stoneware bodies. Journal of the European Ceramic Society. 2010;30(7):1599-1607.
29. Stathis G, Ekonomakou A, Stournaras CJ, Ftikos C. Effect of firing conditions, filler grain size and quartz content on bending
strength and physical properties of sanitaryware porcelain. Journal of the European Ceramic Society. 2004;24(8):2357-2366.
30. Bragança SR, Bergmann CP, Hübner H. Effect of quartz particle
size on the strength of triaxial porcelain. Journal of the European Ceramic Society. 2006;26(16):3761-3768.
31. Santana LNL, Gomes J, Menezes RR, Neves GA, Lira HL, Segadães AM. Microstructure development in clays upon heat treatment: Kinetics and equilibrium. Applied Clay Science.
2017;135:325-332.
32. Martín-Márquez J, Rincón JM, Romero M. Effect of firing