*Corresponding author: Kanakapura Basavaiah. Department of Chemis-try, University of Mysore, Manasagangotri, Mysore-570006, India. E-mail: [email protected]
A
rti
Pharmaceutical Sciences vol. 47, n. 2, apr./jun., 2011
Rapid titrimetric and spectrophotometric determination of
oloxacin in pharmaceuticals using
N
-bromosuccinimide
Kanakapura Basavaiah Vinay, Hosakere Doddarevanna Revanasiddappa, Okram Zenita Devi,
Pavagada Jagannathamurthy Ramesh, Kanakapura Basavaiah
*Department of Chemistry, University of Mysore, Manasagangothri, India
One titrimetric and two spectrophotometric methods have been described for the determination of oloxacin (OFX) in bulk drug and in tablets, employing N-Bromosuccinimide as an analytical reagent. The proposed methods involve the addition of a known excess of NBS to OFX in acid medium, followed by determination of unreacted NBS. In titrimetry, the unreacted NBS is determined iodometrically, and in spectrophotometry, unreacted NBS is determined by reacting with a ixed amount of either indigo carmine (Method A) or metanil yellow (Method B). In all the methods, the amount of NBS reacted corresponds to the amount of OFX. Titrimetry allows the determination of 1-8 mg of OFX and the calculations are based on a 1:5 (OFX:NBS) reaction stoichiometry. In spectrophotometry, Beer’s law is obeyed in the concentration ranges 0.5-5.0 µg/mL for method A and 0.3-3.0 µg/mL for method B. The molar absorptivities are calculated to be 5.53x10⁴ and 9.24x10⁴ L/mol/cm for method A and method B,
respectively. The methods developed were applied to the assay of OFX in tablets, and results compared statistically with those of a reference method. The accuracy and reliability of the methods were further ascertained by performing recovery tests via thestandard-addition method.
Uniterms:Oloxacin/determination. Titrimetry/quantitative analysis. Spectrophotometry/quantitative analysis. N-Bromosuccinimide. Tablets/quantitative analysis.
Descrevem-se métodos, um titulométrico e dois espectrofotométricos, para a determinação de oloxacino (OFX) na matéria-prima e em comprimidos, empregando a N-bromossuccinimida (NBS) como reagente analítico. Os métodos propostos envolvem a adição de excesso conhecido de NBS ao OFX, em meio ácido, seguida de determinação do NBS que não reagiu. Na titulometria, o NBS que não reagiu é determinado iodometricamente e na espectrofotometria, o NBS que não reagiu é determinado pela reação com quantidade ixa de índigo carmim (Método A) ou amarelo de metanila (Método B). Em todos os métodos, a quantidade de NBS que reagiu corresponde à quantidade de OFX. A titulometria permite a determinação de 1-8 mg de OFX e os cálculos se baseiam na estequiometria de reação de 1:5 (OFX:NBS). Na espectrofotometria, a Lei de Beer é obedecida nas faixas de concentração de 0,5-5,0 μg/mL, para o método A, e de 0,3-3,0 μg/mL, para o método B, respectivamente. Os métodos desenvolvidos foram aplicados para o teste de OFX em comprimidos e os resultados foram comparados estatisticamente com aqueles do método de referência. A precisão e a coniabilidade dos métodos foram, posteriormente, veriicadas por meio dos testes de recuperação via método de adição de padrão.
Unitermos: Oloxacino/determinação. Titulometria/análise quantitativa. Espectrofotometria/análise quantitativa. N-Bromossuccinimida. Comprimidos/análise quantitativa.
INTRODUCTION
Oloxacin (OFX), (RS) -7-luoro-2-methyl-6-(4-me-thylpiperazine-1-yl)-10-oxo-4-oxa-1-azatricyclo[7.3.1.05,13]
cell division. This drug is oficial in the United States Phar-macopoeia (USP, 2004) and the British PharPhar-macopoeia (BP, 2003), which recommend non-aqueous titrimetry (USP, 2004; BP, 2003) and HPLC (USP, 2004) techniques for its assay in bulk and dosage forms.
A review of the literature revealed that various analytical methods for the determination of OFX in bulk and pharmaceutical dosage forms have been reported. These include spectroluorometry (Salem, 2005), ato-mic absorption spectrometry (Salem, 2005), capillary electrophoresis (Abdalla et al., 2008; Sun, Wu, 1999), HPLC (Arjekar et al., 1996; Carlucci et al., 1993; Kalta, Sharma, Chaturvedi, 2008; Sinde, Desai, Tendolkar, 1998), HPTLC (Srividya, Cardoza, Amin, 2003), chemi-luminescence (Francis, Paul, Adcock, 2005), as well as electroanalytical (Tamer, 1990; Tuncel, Atkosar, 1992; Zhou, Pan, 1995) and microbiological methods (Silveria, Schapoval, 2002). Some of these methods have suficient sensitivity to determine lower concentrations of the drug. However, these methods involve several manipu-lation steps which are not simple for routine analysis of pharmaceutical formulations and require sophisticated instruments.
Titrimetry and visible spectrophotometry may serve as useful alternatives to many of the aforesaid sophistica-ted techniques because of their cost-effectiveness, ease of operation, sensitivity, remarkable accuracy, precision and wide applicability. The literature search revealed that no titrimetric methods have yet been reported for the deter-mination of OFX.
Visible spectrophotometric methods based on diverse reaction chemistry have been proposed for the assay of OFX in pharmaceuticals. The method based on the formation of pink colored chromogen by the reaction between OFX and citric acid-acetic anhydride (Patel et al., 2007) has been reported. Extractive spectrophotometric procedures based on the formation of yellow colored ion pair complex (Issa, 1997) with bromophenol blue (BPB), bromothymol blue (BTB) and bromocresol purple (BCP); and red colored ion-pair complex (Sastry, Rama, Siva Prasad, 1995) with tropaeolin and supracene violet 3B, have been used for the assay of OFX. Other visible
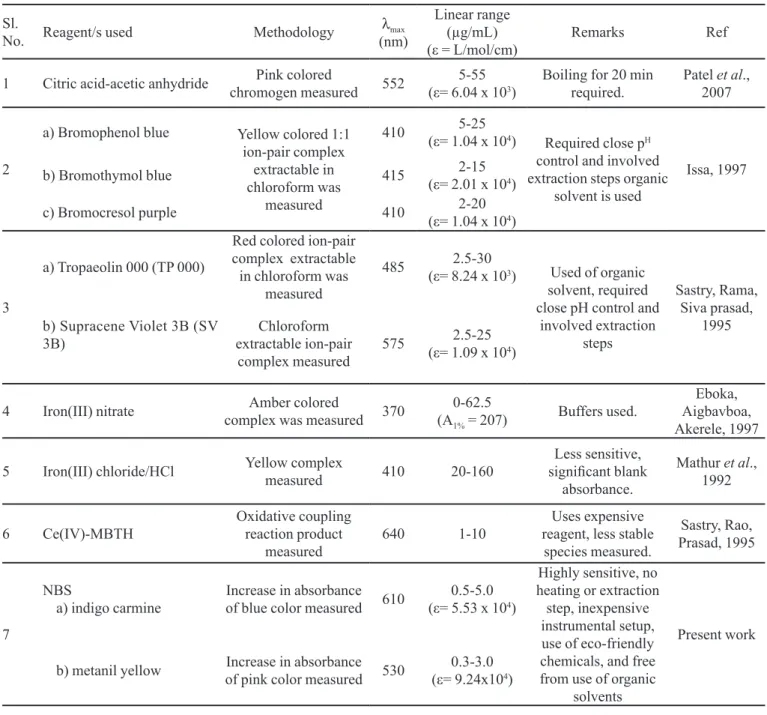
spec-trophotometric methods based on reactions such as com-plex formation reaction with Fe (III) nitrate nonahydrate (Eboka, Aigbavboa, Akerele, 1997), yellow complex with iron (III) chloride in HCl medium (Mathur et al., 1992); and oxidative coupling reaction with Ce(IV)-MBTH (Sastry, Rama, Siva Prasad, 1995), were reported for the assay of OFX. Most of the visible spectrophotometric methods above have one or more inherent disadvantages such as use of heating step, use of organic solvents, close pH control, poor sensitivity and use of expensive reagents, as indicated in Table I.
The aim of the present investigation was to deve-lop simple, sensitive and cost-effective methods for the determination of OFX in pure and dosage forms using titrimetric and spectrophotometric techniques. The me-thods utilized NBS, indigo carmine and metanil yellow as reagents. The methods developed offer the advantages of simplicity, sensitivity, speed, accuracy and precision without the need for costly equipment/chemicals.
MATERIAL AND METHODS
Apparatus
All absorbance measurements were taken on a Systro-nics model 106 digital single beam spectrophotometer (Ah-medabad, India) equipped with 1-cm matched quartz cells.
Material and reagents
All chemicals and reagents used were of analytical or pharmaceutical grade and distilled water was used to prepare the solutions.
• Standard OFX Solution
Pharmaceutical grade OFX, certiied to be 99.98% pure, was received as a gift from Cipla India Ltd, Mum-bai, India, and used as received. Standard OFX solutions (1 mg/mL, 10 and 6 µg/mL) were prepared by dissolving a calculated quantity of pure drug in 0.1 M HCl.
Two brands of tablets containing OFX, Zenlox-400 (Mankind Pharma Pvt Ltd., New Delhi, India) and Olo-xin-400 (J. B. Chemicals and Pharmaceuticals Ltd, Mum-bai, India), used in the investigation were purchased from local commercial sources.
N-Bromosuccinimide (NBS): an approximately 0.02 M NBS solution was prepared, standardized (Berka, Vulterin, Zyoka, 1965) and used in titrimetry. The NBS solution (0.02 M) was further diluted to a concentration of 150 and 100 µg/mL for spectrophotometric method A and method B, respectively.
TABLE I - Comparison of performance characteristics of present methods with published methods
Sl.
No. Reagent/s used Methodology (nm)λmax
Linear range (µg/mL)
(ε = L/mol/cm) Remarks Ref
1 Citric acid-acetic anhydride chromogen measuredPink colored 552 (ε= 6.04 x 10⁵-55 3) Boiling for 20 min required. Patel 2007et al.,
2
a) Bromophenol blue Yellow colored 1:1
ion-pair complex extractable in chloroform was
measured
410 (ε= 1.04 x 10⁵-25 4) Required close pH
control and involved extraction steps organic
solvent is used
Issa, 1997
b) Bromothymol blue 415 (ε= 2.01 x 10²-15 4)
c) Bromocresol purple 410 (ε= 1.04 x 10²-20 4)
3
a) Tropaeolin 000 (TP 000)
Red colored ion-pair complex extractable in chloroform was
measured
485 (ε= 8.24 x 102.5-30 3) Used of organic
solvent, required close pH control and
involved extraction steps
Sastry, Rama, Siva prasad,
1995 b) Supracene Violet 3B (SV
3B) extractable ion-pair Chloroform
complex measured 575
2.5-25 (ε= 1.09 x 10⁴)
4 Iron(III) nitrate complex was measured 370Amber colored (A0-62.5
1% = 207) Buffers used.
Eboka, Aigbavboa, Akerele, 1997
5 Iron(III) chloride/HCl Yellow complex measured 410 20-160 signiicant blank Less sensitive,
absorbance.
Mathur et al., 1992
6 Ce(IV)-MBTH Oxidative coupling reaction product
measured 640 1-10
Uses expensive reagent, less stable
species measured.
Sastry, Rao, Prasad, 1995
7
NBS
a) indigo carmine of blue color measuredIncrease in absorbance 610 (ε= 5.53 x 100.5-5.0 4)
Highly sensitive, no heating or extraction step, inexpensive instrumental setup, use of eco-friendly chemicals, and free from use of organic
solvents
Present work
b) metanil yellow of pink color measured 530Increase in absorbance (ε= 9.24x100.3-3.0 4)
• Sodium thiosulphate (0.04 M)
This was prepared by dissolving 9.93g of chemical (S. d. Fine Chem. Ltd., Mumbai, India) in one liter of water for use in titrimetry.
• HCl (1 M, 2 M and 5 M)
Concentrated HCl (S. D. Fine Chem, Mumbai, India, sp. gr. 1.18) were appropriately diluted with water to attain the required concentrations.
• Potassium iodide (10%)
This was prepared by dissolving 10 g of the chemical
(Merck, Mumbai, India) in 100 mL of water and used in titrimetry.
• Starch indicator (1%)
One g of the reagent (Merck, Mumbai, India) was made into a paste and poured into 100 mL of boiling water, boiled for 1 min, cooled and used for titrimetry.
• Indigo carmine (200 µg/mL) and metanil yellow (50 µg/mL)
General procedure
• Titrimetry
Different volumes (1-8 mL) of standard solution containing 1 mg/mL OFX were accurately measured and transferred into a 100 mL titration lask and the volume was made up to 10 mL with 0.1 M HCl. Two mL of 2 M HCl and 10 mL of NBS (0.02 M) were pipetted into the lask, the content mixed and set aside for 10 min. Sub-sequently, 5 mL of 10% potassium iodide solution was added, and the liberated iodine was titrated against sodium thiosulphate (0.04 M) using starch indicator. A blank titra-tion was performed under identical condititra-tions.
The amount of OFX in the aliquot was computed from the following formula:
Amount (mg) = VMwS/n (1)
where V = mL of NBS reacted; Mw = relative molecular
mass of drug; S = concentration of NBS, moles/L; n = number of moles of NBS reacting with each mole of OFX.
Spectrophotometry
• Method A
Different aliquots, 0.5, 1.0, 2.0, 3.0, 4.0 and 5.0 mL of standard OFX solution (10 µg/mL) were transferred into a series of 10 mL standard volumetric lasks and the total volume in each lask was adjusted to 5 mL with 0.1 M HCl. To each lask, 1 mL of 1M HCl followed by 1 mL of 150 µg/mL NBSwere added. The content of each lask was mixed well and set aside for 15 minutes with occasio-nal shaking. Fioccasio-nally, 1 mL of 200 µg/mL indigo carmine was added and the volume was made up to the mark with distilled water after 5 min. The absorbance was measured at 610 nm Vs reagent blank prepared in a similar manner.
• Method B
Different aliquots (0.5, 1.0, 2.0, 3.0, 4.0 and 5.0) mL of standard 6 µg/mL OFX solution were accurately measu-red and transfermeasu-red into a series of 10 mL calibrated lasks by means of a microburette and total volume adjusted to 5 mL with 0.1 M HCl. To each lask, 1 mL of 5 M HCl followed by 1 mL of 100 µg/mL NBS, was added using a microburette. The content of each lask was mixed well and set aside for 10 minutes. Lastly, 1 mL of 50 µg/mL metanil yellow was added to each lask and mixed well. The volume was made up to the mark with distilled water after 5 min and the absorbance was measured at 530 nm Vs reagent blank prepared in a similar manner.
Calibration graphs were prepared by plotting the
increasing absorbance values versus concentrations of OFX. The concentration of the unknown was read from the respective calibration graph or deduced from the re-gression equation derived using the Beer’s law data.
Procedure for the assay of oloxacin in pharmaceutical preparations
Twenty tablets were weighed accurately and ground into a ine powder. A quantity of the powder containing 100 mg of OFX was accurately weighed into a 100 mL calibrated lask and 60 mL of 0.1 M HCl was added. The content was shaken for about 20 min; volume diluted to the mark with 0.1 M HCl and mixed, and iltered using a Whatman No. 42 ilter paper. The irst 10 mL portion of the iltrate was discarded, and a convenient aliquot was taken and the assay completed according to the titrimetric procedure described earlier. The tablet extract containing OFX at a concentration of 1 mg/mL was then diluted ste-pwise with 0.1 M HCl to obtain working concentrations of 10 μg/mL and 6 μg/mL in OFX for spectrophotometric methods A and B, respectively. A convenient aliquot was then subjected to analysis by the spectrophotometric pro-cedures described above.
Placebo blank analysis
Based on the approximate composition of excipients normally added in the tablet, a placebo blank of the com-position: talc (5 mg), starch (5 mg), acacia (5 mg), methyl cellulose (10 mg), sodium citrate (5 mg), magnesium stearate (5 mg) and sodium alginate (5 mg) was made and its solution prepared as described under ‘Procedure for the assay of OFX in pharmaceutical preparations’, and then subjected to analysis using the procedures described above.
Procedure for the determination of OFX in synthetic mixture
RESULTS AND DISCUSSION
A close examination of the literature search pre-sented in the introduction reveals that NBS has not yet been used for the spectrophotometric determination of OFX. NBSis a strong oxidizing agent and perhaps the most important positive bromine containing organic compound; it is used for the speciic purpose of bromi-nating alkenes at the allylic position(Morrison, Boyd, 2007). The present work involves the bromination of OFX by NBS followed by determination of surplus
NBS after allowing the bromination reaction to com-plete. In titrimetry, the unreacted NBS is determined iodometrically, while in spectrophotometric methods, it is determined by reacting with a fixed amount of either indigo carmine and measured at 610 nm (Fi-gure 2) or metanil yellow and measured at 530 nm (Figure 2). The spectrophotometric methods make use of the bleaching action of NBS on either of the two dyes, where the discoloration is caused by oxidative destruc-tion of the dye. The tentative reacdestruc-tion scheme of titrime-tric and spectrophotometitrime-tric methods methods is shown in FIGURE 2 - Absorption spectra (4.0 µg/mL OFX in method A and 2.4 µg/mL in method B).
Scheme 1. The bromination of OFX will take place in position α to the carbonyl group (Hassan et al., 2007).
Titrimetry
Direct titration of OFX with NBS in acid medium was not successful. However, a back titrimetric assay was found to be possible when the reactants were allowed to stand for some time in acid medium. The reaction stoi-chiometry was found to be 1:5 (OFX: NBS). Reproduci-ble and stoichiometric results were obtained when HCl medium was employed. A two mL volume of 2M HCl in a total volume of 22 mL (0.18 M) was found optimal; although the stoichiometry reaction was unaffected in the concentration range of 0.09-0.27 M HCl. The bromination reaction was found to be complete and quantitative in 10 min and contact time up to 20 min had no effect on the stoichiometry or the results. Hence, the reaction time of 10 min was established. A 10 mL aliquot of 0.02 M NBS solution was found adequate for quantitative bromination of OFX in the range determined of 1-8 mg.
Spectrophotometric methods
The ability of NBS to brominate OFX and bleach the colors of indigo carmine and metanil yellow dyes has been used for the indirect spectrophotometric assay of the drug. Preliminary experiments were performed to determine the maximum concentration of indigo carmine or metanil yellow in the acid medium employed where this was found to be 20 µg/mL and 5 µg/mL for indigo carmine and metanil yellow, respectively. An NBS concentration of 15 µg/mL was found optimum to bleach the blue color produced by 20 µg/mL indigo carmine, whereas in the case of metanil yellow, 10 µg/mL NBS was suficient to destroy the pink color of 5 µg/mL metanil yellow. Hence, different amounts of OFX reacted with 15 µg/mL NBS in method A, and 10 µg/mL NBS in method B.
Hydrochloric acid was found to be the ideal me-dium for the bromination of OFX by NBS as well as the latter’s determination employing either dye. In both the methods, the reaction between OFX and NBS was unaffected when 0.5-3.0 mL each of 1 M HCl (method A) and 5M HCl (method B) in a total volume of 10 mL was used. Hence, 1 mL each of 1 M HCl in method A and 5M HCl in method B was used for both the steps. For a quantitative reaction between OFX and NBS, con-tact times of 15 min and 10 min were found necessary in method A and method B, respectively, and constant absorbance readings were obtained when contact times were extended up to 45 min in method A, and 30 min in
method B. A standing time of 5 min was necessary in both the methods for the bleaching of the dye color by the residual NBS. The measured color was found to be stable for several hours in the presence of the reaction products in both methods.
Method validation procedures
The proposed methods have been validated for linearity, sensitivity, precision, accuracy, selectivity and recovery.
Linearity and Sensitivity
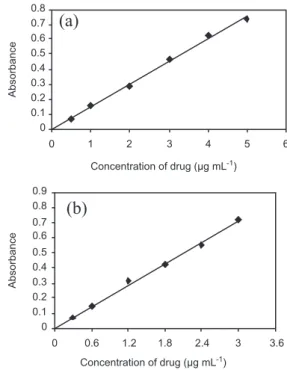
Over the range investigated (1-8 mg), ixed stoichio-metry of 1:5 (OFX: NBS) was obtained in titristoichio-metry, which served as the basis for calculations. In spectrophotometry, under optimum conditions a linear relation was obtained between absorbance and concentration of OFX in the range of 0.5-5.0 µg/mL (method A) and 0.3-3.0 µg/mL (method B) (Figure 3). The calibration graph is described by the equation:
Y = a + b X (2)
(where Y = absorbance, a = intercept, b = slope and X = concentration in µg/mL) obtained by the method of least squares. Correlation coeficient, intercept and slope for the calibration data are summarized in Table II. Sensiti-vity parameters such as apparent molar absorptiSensiti-vity and
TABLE II - Sensitivity and Regression Parameters
Parameter Method A Method B
λmax, nm 610 530
Linear range, µg/mL 0.5-5.0 0.3-3.0
Molar absorptivity(ε), L /mol/cm 5.534 x 10⁴ 9.242 x 10⁴
Sandell sensitivity*, µg/cm2 0.007 0.004
Limit of detection (LOD), µg/mL 0.03 0.03
Limit of quantiication (LOQ), µg/mL 0.09 0.08
Regression equation, Y**
Intercept (a) 0.003 0.003
Slope (b) 0.152 0.237
Standard deviation of a (Sa) 0.0104 0.0774
Standard deviation of b (Sb) 0.004 0.046
Regression coeficient (r) 0.998 0.999
*Limit of determination as the weight in µg per ml of solution, which corresponds to an absorbance of A = 0.001 measured in
a cuvette of cross-sectional area 1 cm2 and l = 1 cm. **Y=a+bX, Where Y is the absorbance, X is concentration in µg/mL, a is
intercept, b is slope.
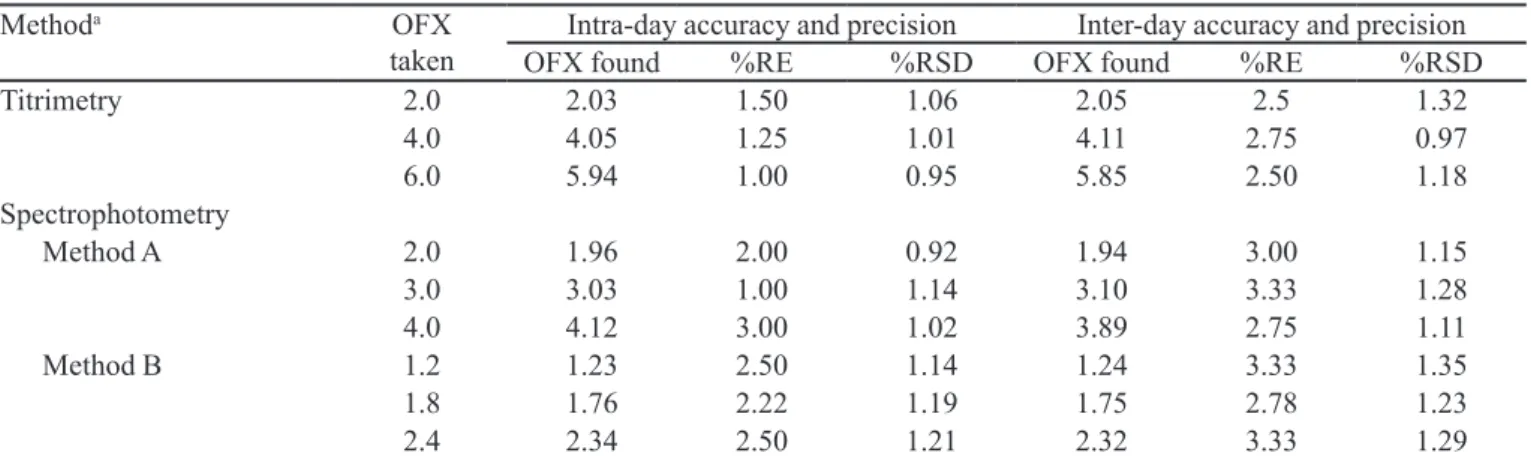
TABLE III - Evaluation of intra-day and inter-day accuracy and precision
Methoda OFX
taken OFX foundIntra-day accuracy and precision%RE %RSD OFX foundInter-day accuracy and precision%RE %RSD
Titrimetry 2.0 2.03 1.50 1.06 2.05 2.5 1.32
4.0 4.05 1.25 1.01 4.11 2.75 0.97
6.0 5.94 1.00 0.95 5.85 2.50 1.18
Spectrophotometry
Method A 2.0 1.96 2.00 0.92 1.94 3.00 1.15
3.0 3.03 1.00 1.14 3.10 3.33 1.28
4.0 4.12 3.00 1.02 3.89 2.75 1.11
Method B 1.2 1.23 2.50 1.14 1.24 3.33 1.35
1.8 1.76 2.22 1.19 1.75 2.78 1.23
2.4 2.34 2.50 1.21 2.32 3.33 1.29
RE. Relative error and RSD. Relative standard deviation. aIn titrimetry, OFX taken/found are in mg, whereas for spectrophotometry
values are µg/mL.
Sandell’s sensitivity values, as well as the limits of detec-tion and quantiicadetec-tion, were calculated as per the current ICH guidelines(ICH guidelines, 2005)and compiled in Table II. The results attest to the sensitivity of the proposed method. The limits of detection (LOD) and quantiication (LOQ) were calculated according to the same guidelines using the formulae:
LOD=3.3σ/s and LOQ=10σ/s (3)
where σ is the standard deviation of ive reagent blank determinations, and s is the slope of the calibration curve.
Precision and accuracy
In order to evaluate the precision of the proposed methods, solutions containing three different
concen-trations of the OFX were prepared and analyzed in ive replicates. The analytical results obtained from this inves-tigation are summarized in Table III. The low values of the relative standard deviation (% R.S.D) and percentage relative error (% R.E) indicate the precision and accuracy of the proposed methods. The percentage relative error is calculated using the following equation:
(4)
diffe-rent days to evaluate intermediate precision (inter-day precision).
Selectivity
The proposed methods were tested for selectivity by placebo blank and synthetic mixture analyses. A con-venient aliquot of the placebo blank solution, prepared as described earlier, was subjected to analysis by titrimetry and spectrophotometry according to the recommended procedures. In all the cases, there was no interference by the inactive ingredients present in the placebo mixture.
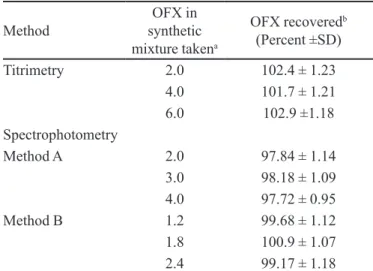
A separate experiment was performed with the syn-thetic mixture. The analysis of synsyn-thetic mixture solution prepared above yielded percent recoveries which ranged from 97.72-102.9 with standard deviation of 0.95-1.23 in all the cases. The results of this study shown in Table IV indicate that the inactive ingredients present in the
syn-thetic mixture did not interfere in the assay. These results further demonstrate the accuracy, as well as the precision, of the proposed methods.
Application to formulations
In order to evaluate the analytical applicability of the proposed methods to the quantiication of OFX in commercial tablets, the results obtained by the proposed methods were compared to those of the reference method (BP, 2003) by applying Student’s t-test for accuracy and the F-test for precision. The reference method involved the titration of OFX in anhydrous acetic acid with acetous perchloric acid to potentiometric end point detection. The results (see Table V) show that the Student’s t- and F-values at a 95 % conidence level are lower than the tabulated values, thereby conirming good agreement between the results obtained by the proposed methods and the reference method, with respect to accuracy and precision.
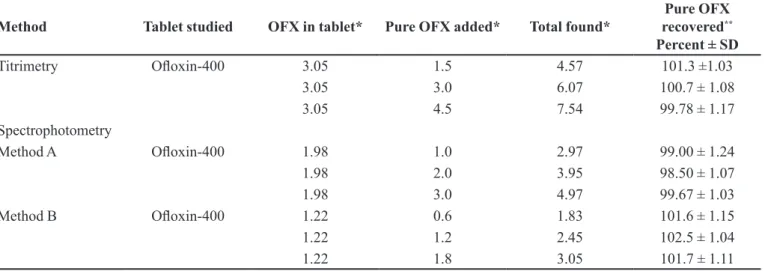
Recovery studies
The accuracy and validity of the proposed methods were further ascertained by performing recovery studies. Pre-analysed tablet powder was spiked with pure OFX at three concentration levels (50, 100 and 150% of that in tablet powder) and totals then determined by the proposed methods. In all cases, the added OFX recovery percentage values ranged from 98.50-102.5% with a standard devia-tion of 1.03-1.24 (Table VI), indicating good recovery and absence of interference from the co-formulated substance in the determination.
CONCLUSIONS
The proposed titrimetric method is a irst report on the application of titrimetry for the assay of OFX. The TABLE IV - Recovery of drug from synthetic mixture
Method synthetic OFX in
mixture takena
OFX recoveredb
(Percent ±SD)
Titrimetry 2.0 102.4 ± 1.23
4.0 101.7 ± 1.21
6.0 102.9 ±1.18
Spectrophotometry
Method A 2.0 97.84 ± 1.14
3.0 98.18 ± 1.09
4.0 97.72 ± 0.95
Method B 1.2 99.68 ± 1.12
1.8 100.9 ± 1.07
2.4 99.17 ± 1.18
amg in titrimetry and µg/mLin spectrophotometry. bMean value
of ive determinations
TABLE V - Results of analysis of tablets by proposed methods
Tablet Brand
name Label claim,mg/tablet
Found* (Percent of label claim ± SD) Reference
method Titrimetry Method ASpectrophotometryMethod B
Zenlox-400** 20 100.12 ± 1.09 102.0 ± 1.17t= 2.62
F= 1.15
98.12 ±1.29
t=2.65
F= 1.40
98.87 ± 1.15
t=1.76
F= 1.11
Oloxin-400*** 20 100.4 ± 1.02 101.7 ± 1.04t= 1.99
F= 1.04
98.95 ± 1.32
t=1.96
F=1.67
102.1 ± 1.13
t=2.49
F=1.23
*Mean value of ive determinations. ** Mankind Pharma Pvt Ltd., New Delhi, India;*** J. B. Chemicals and Pharmaceuticals Ltd,
TABLE VI - Accuracy assessment by recovery experiments
Method Tablet studied OFX in tablet* Pure OFX added* Total found* recoveredPure OFX **
Percent ± SD
Titrimetry Oloxin-400 3.05 1.5 4.57 101.3 ±1.03
3.05 3.0 6.07 100.7 ± 1.08
3.05 4.5 7.54 99.78 ± 1.17
Spectrophotometry
Method A Oloxin-400 1.98 1.0 2.97 99.00 ± 1.24
1.98 2.0 3.95 98.50 ± 1.07
1.98 3.0 4.97 99.67 ± 1.03
Method B Oloxin-400 1.22 0.6 1.83 101.6 ± 1.15
1.22 1.2 2.45 102.5 ± 1.04
1.22 1.8 3.05 101.7 ± 1.11
*mg in titrimetry and µg/mLin spectrophotometry. **Mean value of three measurements.
titrimetric method is straightforward and fast compared to the other methods reported earlier. The proposed methods make use of simple reagent, which an ordinary analytical laboratory can afford and, unlike most currently available spectrophotometric methods, the present methods are free from unwelcome steps such as heating or extraction and also from critical pH conditions. The spectrophotometric methods are the most sensitive reported to date for OFX (Table I). The methods are also useful for their high tole-rance limit for common excipients found in drug formu-lations. These merits, coupled with the use of simple and inexpensive instruments, allow recommendation of the use of these methods in routine quality control Laboratories.
ACKNOWLEDGEMENTS
The authors wish to acknowledge Cipla India Ltd, Mumbai, India, for providing the gift sample of oloxacin. One of the authors (OZD) also wishes to thank the Univer-sity Grant Commission (UGC), New Delhi, for the award of the UGC Meritorious Research Fellowship, while two of the authors (OZD and KBV) also thank the authorities of the University of Mysore for their kind permission and facilities to carry out the research work.
REFERENCES
ABDALLA, A.E.; BAHRUDDIN, S.; ABDUSSALAM, S.M.I.; MUHAMMAD, I.S.; HASSAN, Y.A. Determination of oloxacin enantiomers in pharmaceutical formulations by
capillary electrophoresis. J. Liq. Chromatogr. Rel. Technol.,
v.31, p.348-360, 2008.
ARJEKAR, A.P.; KAPADIA, U.S.; RAJ, S.V.; KUNJIR S.S. Quantitative determination of lomefloxacin, ofloxacin, peloxacin and enroloxacin in pharmaceutical dosages, bulk drug and processes monitoring of enrofloxacin by
HPLC-RP. Indian Drugs, v.33, p.261-266, 1996.
BERKA, A.; VULTERIN, J.; ZYOKA, J. Newer redox titrants.
New York: Pergamon Press, 1965. p.53.
BRITISH PHARMACOPEIA. Her Majesty’s Stationery ofice, London, 2003. v.3, p.1357.
CARLUCCI, G.; MAZZEO, P.; FANTOZZI, T. Determination of ofloxacin in pharmaceutical forms by high-performance liquid chromatography and derivative UV-
spectrophotometry. Anal. Lett., v.26, p.2193-2201, 1993.
DRLICA, K.; ZHAO, X. DNA gyrase, topoisomerase IV, and
the 4-quinolones. Microbiol. Mol. Biol. Rev., v.61,
p.377-392, 1997.
EBOKA, C.J.; AIGBAVBOA, S.O.; AKERELE, J.O.
Colorimetric determination of thr fluoroquinolones. J.
Antimicrob. Chemother., v.39, p.639-641, 1997.
FRANCIS, P., ADCOCK, J.L. Chemiluminescence methods
for the determination of oloxacin. Anal. Chim. Acta, v.541,
p.3-12, 2005.
HASSAN, A.; IBRAHIM, R.; IBRAHIM, D.; MOSTAFA, M. Evaluation of N-Bromosuccinimide as a new-analytical reagent for the spectrophotometric determination of
luoroquinolone antibiotics. Chem. Pharm. Bull. (Tokyo),
HALKAR, U.P.; ANKALKOPE, P.B. Reverse phase high-performance liquid chromatographic determination of
ofloxacin and tinidazole in tablets. Indian Drugs, v.37,
p.585-588, 2000.
INTERNATIONAL CONFERENCE ON HARMONISATION O F T E C H N I C A L R E Q U I R E M E N T S F O R REGISTRATION OF PHARMACEUTICALS FOR HUMAN USE, ICH Harmonised Tripartite Guideline. Validation of Analytical Procedures: Text and Methodology, Q2 (R 1), Complementary Guideline on Methodology dated 06 November 1996, London, incorporated in November 2005.
ISSA, Y.M.; ABDEL-GAWAD, F.M.; ABOU TABLE, M.A.; HUSSEIN, H.M. Spectrophotometric determination of ofloxacin and lomefloxcin hydrochloride with some
sulphonthalien dyes. Anal. Lett., v.30, p.2071, 1997.
KALTA, R.R.; SHARMA, R.; CHATURVEDI, S.C. Simultaneous RPHPLC determination of nitazoxanide
and oloxacin in combined tablet dosage foerm. Indian J.
Pharm. Sci., v.70, p.491-494, 2008.
MATHUR, S.C.; KUMAR, Y.; MURUGESAN, N.; RATHORE, Y.K.S.; SETHI, P.D. Spectrophotometric determination of
oloxacin in pharmaceutical formulations. Indian Drugs,
v.29, p.376, 1992.
MORRISON, R.T.; BOYD, R.N. Organic chemistry. 6.ed. New
Jersey: Prentice-Hall, 2007. p.390.
PATEL, P.U.; SUHAGIA, B.N.; PATEL, M.M.; PATEL, G.C.; PATEL, G.N. Spectrophotometric determination of
oloxacin with citric acid-acetic anhydride. Ind. Pharm.,
v.6, p. 59-61, 2007.
SALEM, H. Spectrofluorimetric, atomic absorption spectrometric and spectrophotometric determination of
some luoroquinolones. Am. J. Appl. Sci., v.2, p.719-729,
2005.
SASTRY, C.S.P.; RAMA RAO, K.; SIVA PRASAD, D. Extractive spectrophotometric determination of some fluoroquinoline derivatives in pure and dosage forms.
Talanta, v.42, p.311-316, 1995.
SASTRY, C.S.P.; RAMA RAO, K.; SIVA PRASAD, D. Spectrophotometric determination of enrofloxacin and
oloxacin in pharmaceutical formulations. Indian Drugs,
v.32, p.172-175, 1995.
SHINDE, V.M.; DESAI, B.S.; TENDOLKAR, N.M. Selective determination of luoroquinolone derivatives fron tablets
by reverse – phase HPLC. Indian Drugs, v.35, p.715-717,
1998.
SILVERIA, E.V.L.; SCHAPOVAL, E.E.S. Microbiological
assay for determination of oloxacin injection. J. Pharm.
Biomed. Anal., v.1-2, p.91-96, 2002.
SRIVIDYA, P.; CARDOZA, R.M.; AMIN, P.D. Stability
indicating HPTLC method of ofloxacin. Indian Drugs,
v.40, p.41-43, 2003.
SUN, S.W.; WU, A.L. Determination of fluoroquinolone antibacterials in pharmaceutical formulations by capillary
electrophoresis. J. Liq. Chromatogr. Rel. Technol., v.22,
p.281-296, 1999.
TAMER, M. Adsorptive stripping voltammetric determination
of oloxacin. Anal. Chim. Acta, v.231, p.129-131, 1990.
TUNCEL, M.; ATKOSAR, Z. Determination of oloxacin in
tablets by potentiometry and conductometry. Pharmazie,
v.47, p.642-653, 1992.
UNITED STATES PHARMACOPOEIA, National Formulary XVII, Rockville: USA Convention, 1990. v.22, p.912.
ZHOU, G.; PAN, J. Polarographic and voltammetric behaviour
of oloxacin and its analytical applications. Anal. Chim.
Acta, v.307, p.49-53, 1995.
Received for publication on 05th January 2010