*Correspondence: Xixiang Ying. School of Pharmacy, Liaoning University of Traditional Chinese Medicine, 77 Shengming 1 Road, DD Port, 116600 - Dalian, China. E-mail: [email protected]
A
vol. 49, n. 3, jul./sep., 2013
Pharmacokinetic study of isoquercitrin in rat plasma after
intravenous administration at three different doses
Hefei Xue
1, Yuzhong Li
2, Wenjie Zhang
1,
Dongrui Lu
1, Yinghui Chen
1, Jingjing Yin
1, Yihan Meng
1,
Xixiang Ying
1,*, Tingguo Kang
11School of Pharmacy, Liaoning University of Traditional Chinese Medicine, Dalian, China, 2Department of Inspection, Second Afiliated Hospital of Dalian Medical University, China
The aim of this study is to develop a simple and speciic HPLC method using vitexin as the internal standard
to investigate the pharmacokinetics of isoquercitrin (ISOQ) after three different doses administrated intravenously to rats. The pharmacokinetic parameters were calculated by both compartmental and
non-compartmental approaches. The results showed that ISOQ itted a three-compartment open model.
The values of AUC increased proportionally within the range of 5-10 mg·kg-1. Moreover, α half-life,
β half-life, aCL, MRT
0-t and MRT0→∞ of ISOQ in rats showed signiicant differences between 20 mg·kg -1
and other doses, indicating that ISOQ presented dose-dependent pharmacokinetics in the range of 5-10 mg·kg-1 and non-linear pharmacokinetics at higher doses.
Uniterms: Isoquercitrin/pharmacokinetics/experimental study. High Performance Liquid
Chromatography. Crataegus pinnatiida Bge. Var major/leaves/phytochemistry.
O objetivo deste estudo é desenvolver um método simples e especíico de HPLC usando vitexina como
padrão interno para investigar a farmacocinética do isoquercitrina (ISOQ) após três doses diferentes administradas por via intravenosa a ratos. Os parâmetros farmacocinéticos foram calculados pelas abordagens compartimental e não compartimental. Os resultados mostraram que ISOQ se encaixa no modelo de três compartimentos. Os valores de AUC aumentaram proporcionalmente na faixa de 5-10 mg·kg-1. Além disso, α meia-vida, β meia-vida, aCL, MRT
0-t and MRT0→∞ de ISOQ em ratos mostraram diferenças signiicativas entre 20 mg·kg-1 e outras doses, o que signiica que ISOQ apresenta
farmacocinética dose-dependente no intervalo de 5-10 mg·kg-1 e farmacocinética não linear em doses
mais elevadas.
Unitermos: Isoquercitrina/farmacocinética/estudo experimental. Cromatograia líquida de alta eiciência.
Folhas de Crataegus pinnatiida Bge. Var major/folhas/itoquímica.
INTRODUCTION
The leaves of Crataegus pinnatifida Bge. var.
major recorded in the Chinese Pharmacopoeia are a well-known traditional Chinese medicine and contain many compounds such as chlorogenic acid,
vitexin-4’’-O-glucoside, vitexin-2’’-O-rhamnoside, vitexin, rutin, hyperoside, isoquercitrin (ISOQ), and quercetin (Ying et al., 2009). In recent years, ISOQ, a lavonol glycoside, has
attracted a great deal of attention because of its numerous
biological and pharmacological activities, including
anti-inlammatory activity (Rogerio et al., 2007), antioxidant
activity in vitro and in vivo(Silva et al., 2009), being
effective at attenuating the death of RGC-5 cells in
culture caused by exposure to hydrogen peroxide (H2O2), and treating glaucoma (Jung et al., 2010). Moreover,
many methods including HPLC-UV(Bramati, Aquilano,
Pietta, 2003), LC-DAD and LC-MS (Maria et al., 2007),
CZE-UV (Jing et al., 2007), SPE-HPLC (Lai et al., 2007)
have been reported in the literature for the quantiication
of ISOQ in various herbal medicines. Also, in vitro and
in vivo analyses of ISOQ have been reported (Chang et al., 2005). However, there was little attention paid to
administration at three different doses, and therefore the aim of this study is to investigate the pharmacokinetics
of ISOQ employing a validated HPLC method with an
internal standard (I.S.). To the best of our knowledge, this
is the irst report of a pharmacokinetic study following
the intravenous administration of ISOQ in rats at multiple doses.
MATERIAL AND METHOD
Reagents and chemicals
ISOQ and the internal standard, vitexin, were both isolated from leaves of C. pinnatiida Bge. var major in our
laboratory; the purities of both were found to be over 98% by HPLC analysis. The leaves were collected in Shenyang, Liaoning Province, China and identiied by Prof. Bing Wang. Voucher specimens (20111020) were maintained
at the Liaoning University of Tradition Chinese Medicine.
The chemical structures of ISOQ and vitexin, conirmed
by 1H and 13C-nuclear magnetic resonance spectroscopy,
are shown in Figure 1.
The water used in all experiments was puriied by
a Milli-Q® Biocel Ultrapure Water System (Millipore, Bedford, MA, USA). Methanol and acetonitrile were both
of HPLC grade and purchased from Damao (Chemical
Reagent Plant, Tianjin, China). All other reagents were of analytical grade (Jinfeng Chemical Factory, Tianjin, China).
Isolation and identification
A sample (5 kg) of the leaves of C. pinnatiida Bge. var major was extracted twice using 50 L of 60% aqueous
ethanol each time. The crude extract was concentrated
and then passed through a porous-polymer resin (AB-8, Tianjin, China). The fraction eluted with 70% ethanol was
evaporated under reduced pressure to obtain an extract
and subjected to silica-gel column chromatography eluted with ethyl acetate:butanone:formic acid:water
(6:2:1:0.2). Fractions of similar composition pooled
on the basis of TLC analysis (UV monitoring at 365 nm) were repeatedly subjected to silica gel column
chromatography and sublimated on a Sephadex LH-20 column to obtain 0.6 g of ISOQ with a purity of 98%, which was checked by HPLC. The chemical structures of ISOQ conirmed by 1HNMR, 13CNMR and MS data were consistent with previous reports (Zhang, Xu, 2001;
Wang et al., 2004).
Chromatographic system
The analyses were carried out on an Agilent
1100 series HPLC system (Agilent Technology, Palo
Alto, CA, USA) which consisted of a quaternary pump
(G1310A), a vacuum degasser (G1322A), a UV-visible
spectrophotometric detector (G1314A) and Chemstation software (Agilent). The analytes were determined at 30 ºC, kept by a column heater (Replete technology, Dalian), on an analytical Diamonsil C18 column (150 mm × 4.6 mm
i.d., 5 μm, Diamonsil, USA) protected by a KR C18 guard
column (35 mm × 8.0 mm, i.d., 5 μm, Dalian Create
Science and Technology Co., Ltd., China). The mobile
phase, which consisted of methanol-acetonitrile-0.1%
aqueous formic acid (35:5:60, v/v/v), was filtered and degassed under reduced pressure before use. All chromatographic measurements were performed at 30 ºC and a flow rate of 1 mL·min-1 with the detection
wavelength of 360 nm.
Plasma Sample Preparation
10 μL of I.S. (vitexin, 22.6 μg·mL-1), 10 μL of acetic acid, and 500 μL of methanol were successively
pipetted into the 100 μL plasma samples, followed by vortex mixing for 1 min. The supernatant was separated and evaporated to dryness under a stream of nitrogen at 40 ºC after being centrifuged at 890 × g for 15 min. The
residue was constituted in 100 μL of mobile phase and centrifuged at 15,092 × g for 10 min. A 20 μL aliquot of
each supernatant was analyzed by HPLC.
METHOD VALIDATION
Selectivity
Selectivity was shown by comparing chromatograms of blank plasma obtained from rats prior to dosing with those of corresponding standard plasma samples spiked
with ISOQ and I.S., and plasma samples from rats after the intravenous administration of ISOQ.
Preparation of standards and quality control samples
Standard stock solutions of ISOQ and I.S. were prepared in methanol to yield the concentrations of 160
and 226 μg·mL-1, respectively. The working solutions were
prepared with diluted stock solution to concentrations over the range of 0.4-160 μg·mL-1. All working solutions
were stored at 4 ºC. Seven calibrators (0.2, 0.4, 0.8, 2, 5,
20 and 80 μg·mL-1) of ISOQ were prepared by adding
standard working solutions (50 μL) and the working
solution I.S. (22.6 μg·mL-1, 10 μL) to drug-free rat plasma.
The quality control (QC) samples were prepared at low
(0.6 μg·mL-1, 3 times of the lower limit of quantitation), high (60 μg·mL-1, 75% of the upper limit of quantitation) and medium (6 μg·mL-1, near the geometric mean of
low and high concentration) concentrations in bulk and
aliquots were stored at -20 ºC prior to analysis.
Linearity and LOD
The linearity was evaluated over the concentration
range of 0.2-80 μg·mL-1 at seven levels of ISOQ. The
calibration curves for ISOQ in plasma were generated by plotting the peak area ratio of ISOQ to I.S. versus the nominal concentrations in the standard plasma samples. The regression equation was obtained by weighted (1/c2) least square linear regression. The limit of detection (LOD) was determined by a signal-to-noise ratio of 3. The lower
limit of quantiication (LLOQ) was deined as the lowest
concentration of ISOQ in the calibration curves, giving an acceptable accuracy (R.E.) within ±20% and a precision
(R.S.D.) that did not exceed 20%.
Precision and accuracy
The accuracy and precision of the method were evaluated with QC samples at three concentrations and
using ive replicates on three consecutive days. The intra-
and inter-assay precisions were assessed by determining the quality control samples at three concentration levels of ISOQ (0.6, 6 and 60 μg·mL-1). For the intra-day validation, ive replicates of the QC plasma samples were analyzed on the same day. For the inter-day validation, ive replicates
of the QC plasma samples were analyzed on three different days. The precision was expressed as the R.S.D. which
should be less than 15%, except at the LLOQ where it should not exceed 20%; the accuracy of the assay was
determined by comparing the means of the determined ISOQ concentrations with the nominal concentrations. The mean percentage deviation from the nominal values was expressed as the R.E. which should be within ±15% of the
nominal value, except at the lower limit of quantiication
where it should not exceed ±20%.
Extraction recovery
The extraction efficiency was determined by comparing the peak areas of ISOQ from a blank plasma with a known concentration added with the peak areas of a blank plasma with the same concentration of ISOQ added after protein precipitation (n = 6).
Stability
Five aliquots of unextracted QC samples at low, medium and high concentrations were subjected to the conditions below. A short-term stability experiment was
carried out at ambient temperature (25 °C) for 24 h and
long-term stability was tested by storage at -20 °C for one month. QC samples were subjected three freeze
(-20 °C)-thaw (room temperature) cycles for determining freeze-thaw stability. Then, the samples were processed and analyzed. The concentrations obtained were compared with the nominal values of QC samples.
Animals and pharmacokinetic study
Male Wistar rats (weight 250 ± 20 g) were obtain from the Laboratory Animal Center of Liaoning University of Traditional Chinese Medicine (Shenyang, China). Before the experiments, all rats were kept in a controlled environment for one week and had free access to standard
laboratory food and water. The rats were fasted 12-16 h
prior to administration of the ISOQ. All animal studies were performed according to the Guidelines for the Care and Use of Laboratory Animals, which was approved by the Committee of Ethics of Animal Experimentation of Liaoning University of Traditional Chinese Medicine.
Three groups (five rats/group) were randomly assigned to receive ISOQ solution via a tail vein injection
at doses of 5, 10 and 20 mg·kg-1, respectively. ISOQ was dissolved in normal saline containing 20% propylene
glycol-water (v/v). Blood samples (0.3 mL) were collected into heparinized tubes from the vena orbitalis at times
of 2, 5, 10, 15, 20, 30, 45, 60, 90, 120 and 180 min after intravenous administration and then centrifuged at 890 × g
RESULTS AND DISCUSSION
Method development
To obtain suitable retention time and good separation for the analysis, many mixed solutions were used as the mobile phase, such as methanol-water (40:60, 45:55) and
methanol-acetonitrile-water (30:5:65, 35:5:60, 25:10:65); 0.1% formic acid was added in the solvent system after
numerous trials to improve the peak shape and resolution.
A mixture of methanol-acetonitrile-0.1% aqueous formic acid (35:5:60, v/v/v) was inally selected for use in this
study.
The UV absorption spectra of ISOQ have two
maximum absorptions at 256 nm and 358 nm and that of I.S. at 269 and 331 nm. The interferences from
endogenous substances in the plasma were observed when
the wavelength was set at 256 nm; therefore, the detection
wavelength was set at 360 nm because of no interference appeared and it was found to be suitable for the analysis of ISOQ and I.S.
A suitable internal standard should be similar to the
analyte, ISOQ, either structurally or chemically. Hence,
vitexin-4’’-O-glucoside, vitexin-2’’-O-rhamnoside, hyperoside and vitexin were considered as the internal standards, with vitexin finally being chosen as the internal standard because the optimum resolution and retention time could be obtained when compared with analyte.
To simultaneously acquire high extraction recovery and precision of ISOQ and I.S., several solvents such as acetonitrile and methanol were applied to precipitate protein in different ratios during the preliminary
investigation; the highest recovery occurred using 500 μL of methanol. 10, 20 and 30 μL of acetic acid were added to the plasma to avoid dissociation of the analyte, and a good
peak shape was inally obtained when 10 μL of acetic acid was added to the plasma.
Method validation
Selectivity
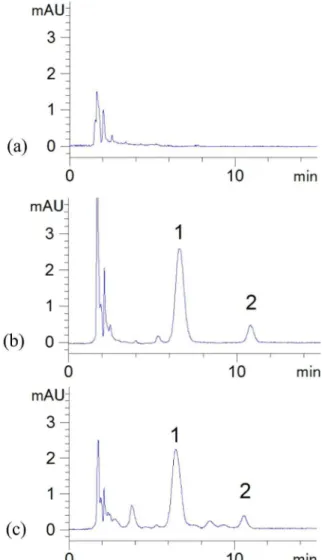
To determine the selectivity of this method, blank rat plasma, plasma spiked with ISOQ and I.S. and plasma samples from rats after intravenous doses of
ISOQ were analyzed; results are shown in Figure 2. The
chromatograms showed that there were no interfering peaks in the region of the peaks of the analyte and I.S. The retention times of ISOQ and I.S. were approximately
6.8 min and 10.6 min, respectively. The total run time was
15.0 min.
Calibration curve and quality control samples
The evaluation of the linearity was performed with a seven-point calibration curve over the concentration
range of 0.2-80 μg·mL-1. The slope and intercept of the
calibration graphs were calculated by weighted (1/c2) least squares linear regression. The regression equation of the calibration curves was typically: y = 0.2426x - 0.0242, and r was 0.9961, where y is the peak area ratio of ISOQ to I.S., and x is the plasma concentration of ISOQ. The limit of
detection (LOD) was 0.06 μg·mL-1, which was determined by a signal-to-noise ratio (S/N) of 3. The lower limit of quantiication deined as the lowest concentration on the calibration curve, was 0.2 μg·mL-1 with the precision and accuracy within 20%, as veriied by repeated analysis. FIGURE 2 - Representative chromatograms of blank plasma (a), plasma spiked with isoquercitrin and vitexin (b) and plasma sample 60 min after the intravenous administration of
isoquercitrin at a dose of 10 mg·kg-1 (c). Peak 1: vitexin; Peak
Precision and accuracy
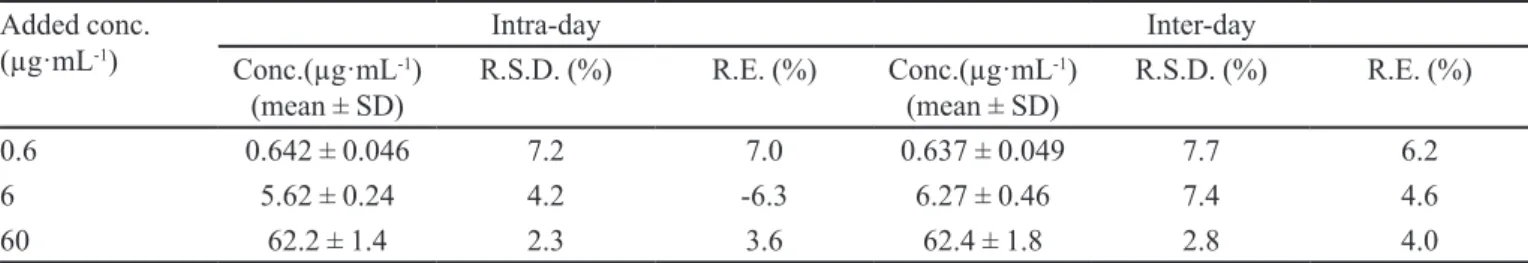
The R.S.D.s and R.E.s for intra-day assay of three
concentrations were in the ranges of 2.3 to 7.2% and -6.3 to 7.0%, respectively, and that for inter-day were in the ranges of 2.8 to 7.7% and 4.0 to 6.2%, respectively. The
precision (R.S.D.) determined at each concentration level
is required to not exceed 15% and accuracy (R.E.) was
within ±15% of the actual value which falls within the criteria for the analysis of biological samples according to
the FDA (USFDA, 2001). The results are shown in Table I.
Extraction recovery
The extraction recoveries of ISOQ at three
concentrations (0.6, 6 and 60 μg·mL-1) were more than 91.24 ± 6.93%, and that of I.S. was 98.50 ± 4.82%, suggesting that there was negligible loss during extraction, which could be attributed to the high solubility of ISOQ in methanol and the one-step protein precipitation used in the sample preparation.
Stability
The short-term, long-term as well as freeze-thaw
stabilities of ISOQ in plasma ranged from 92.73 to 99.85%, indicating that no signiicant degradation occurred during
chromatography, extraction and sample storage processes for ISOQ plasma samples.
Pharmacokinetic study
Pharmacokinetic data were processed by 3p97
software (The Chinese Society of Mathematical Pharmacology, Beijing, China). The plasma concentration-time curves of ISOQ in rats following intravenous
injection of 5, 10 and 20 mg·kg-1 body weight are shown
in Figure 3; these demonstrate that ISOQ were eliminated rapidly from the plasma. The plasma concentrations of ISOQ were detectable only up to 0.75 h in rats at low
TABLE I - Precision and accuracy of isoquercitrin determination in rat plasma (intra-day: n = 5; inter-day: n = 3 days with 5 replicates per day)
Added conc.
(µg·mL-1)
Intra-day Inter-day
Conc.(µg·mL-1)
(mean ± SD)
R.S.D. (%) R.E. (%) Conc.(µg·mL-1)
(mean ± SD)
R.S.D. (%) R.E. (%)
0.6 0.642 ± 0.046 7.2 7.0 0.637 ± 0.049 7.7 6.2
6 5.62 ± 0.24 4.2 -6.3 6.27 ± 0.46 7.4 4.6
60 62.2 ± 1.4 2.3 3.6 62.4 ± 1.8 2.8 4.0
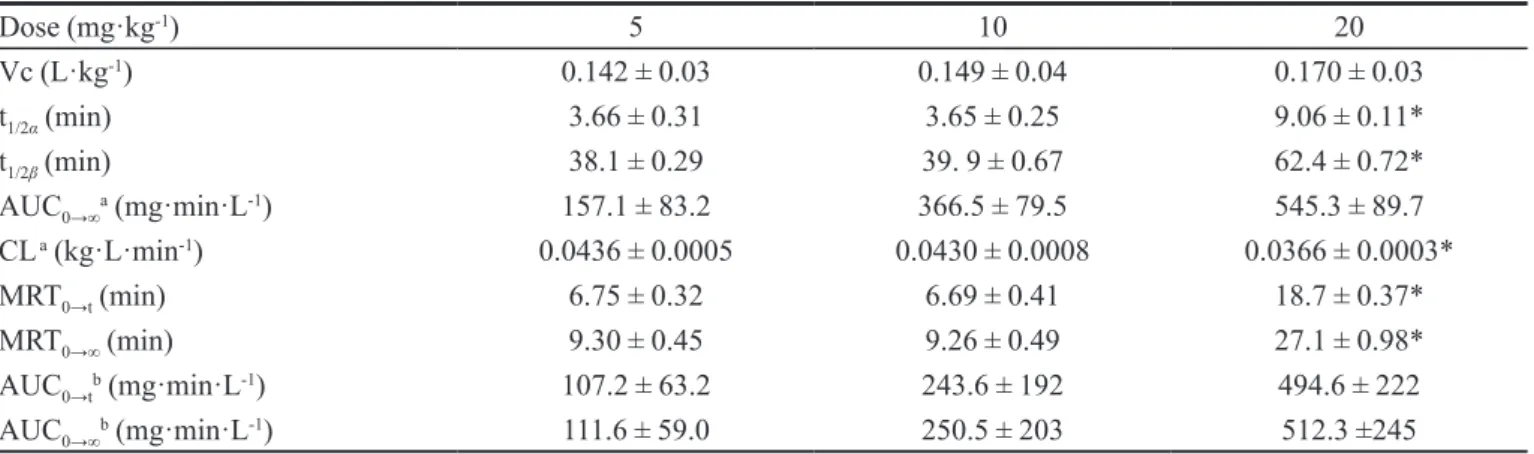
dose, and 3 h in rats at high doses. The pharmacokinetic parameters were calculated by both compartmental and non-compartmental approaches; all pharmacokinetic parameters are given in Table II. The weight of 1/c2 was chosen by comparing the goodness of fit for 5, 10 and
20 mg·kg-1. According to the F test, AIC and R2, a three-compartment open model gave the best it to the plasma
concentration-time curves obtained in rats. The values of AUC increased proportionally within the range of 5-10 mg·kg-1. Additionally, the pharmacokinetic results of α half-life, β half-life, aCL, MRT
0→t and MRT0→∞
showed signiicant differences between 20 mg·kg-1 and other doses. The α half-life at a dose of 20 mg·kg-1 was
more than those after other doses, indicating that the
distribution of ISOQ in rats was slower at 20 mg·kg-1. The greater β half-life, MRT0→t and MRT0→∞ at 20 mg·kg-1 suggested that ISOQ was subjected slower elimination than other doses. According to the above results, ISOQ presented dose-dependent pharmacokinetics in the range of 5-10 mg·kg-1 and non-linear pharmacokinetics at higher
doses, mainly because the metabolic enzyme of the drug or carrier of drug membrane-permeable process is saturated at high concentrations; i.e. the catalytic capability of metabolic enzymes or the transportation capability of a carrier is saturated when the dosage and the concentration
in vivo exceed a certain limit (Leon, Andrew, 1993).
CONCLUSIONS
A simple and speciic HPLC method was developed
for the determination of ISOQ in rat plasma, which was successfully applied to an in vivo kinetic study in rats. ISOQ presented dose-dependent pharmacokinetics in the range of 5-10 mg·kg-1 and non-linear pharmacokinetics at
higher doses. The validated method contributes not only to the determination of ISOQ in rat plasma but also to our understanding of the pharmacokinetic characteristics of ISOQ over the multiple doses in rats after intravenous administration.
ACKNOWLEDGMENTS
The study was supported by Shenyang Science and
Technology Planning Project Foundation (F13-194-9-00),
China.
REFERENCES
BRAMATI, L.; AQUILANO, F.; PIETTA, P. Unfermented rooibos tea: quantitative characterization of flavonoids by HPLC-UV and determination of the total antioxidant activity. J. Agric. Food Chem., v.51, p.7472-7474, 2003.
CHANG, Q.; ZUO, Z.; WALTER, K.K.H.; MOSES, S.S.C. Comparison of the pharmacokinetics of hawthorn phenolics in extract versus individual pure compound. J. Clin. Pharmacol., v.45, p.106-112, 2005.
GUIDANCE FOR INDUSTRY: bioanalytical method validation. In: U.S. Department of Health and Human Services. Food and Drug Administration, Center for Drug Evaluation And Research (CDER), Center for Biologics Evaluation And Research (CBER), 2001. Available at: <www.fda.gov/downloads/Drugs/GuidanceCompliance RegulatoryInformation/Guidances/UCM070107.pdf.>. Accessed on: May 2001.
JING, R.J.; JIANG, X.Y.; HOU, S.R.; LI, X.J.; YUAN, Z.B. Determination of lavonoids in a citrus fruit extract by LC-DAD and LC-MS. Food Chem., v.101, p.1742-1747, 2007.
JUNG, S.H.; KIM, B.J.; LEE, E.H.; OSBORNE, N.N. Isoquercitrin is the most effective antioxidant in the plant Thuja orientalis and able to counteract oxidative-induced damage to a transformed cell line (RGC-5 cells). Neurochem. Int., v.57, p.713-721, 2010.
LAI, X.Y.; ZHAO, Y.Y.; LIANG, H.; BAI, Y.J.; WANG, B.; GUO, D. SPE-HPLC method for the determination of four lavonols in rat plasma and urine after oral administration of Abelmoschus manihot extract. J. Chromatogr. B Analyt. Technol. Biomed. Life. Sci., v.852, p.108-114, 2007.
LEON, S.; ANDREW, B.C.Y. Applied biopharmaceutics & pharmacokinetics. London: Prentice-Hall Co., 1993. p.375-379.
TABLE II - Pharmacokinetic parameters of isoquercitrin in rats (mean ± S.D., n = 5) after the intravenous administration of doses of 5, 10 and 20 mg·kg-1
Dose (mg·kg-1) 5 10 20
Vc (L·kg-1) 0.142 ± 0.03 0.149 ± 0.04 0.170 ± 0.03
t1/2α (min) 3.66 ± 0.31 3.65 ± 0.25 9.06 ± 0.11*
t1/2β (min) 38.1 ± 0.29 39. 9 ± 0.67 62.4 ± 0.72*
AUC0→∞a (mg·min·L-1) 157.1 ± 83.2 366.5 ± 79.5 545.3 ± 89.7
CL a (kg·L·min-1) 0.0436 ± 0.0005 0.0430 ± 0.0008 0.0366 ± 0.0003*
MRT0→t (min) 6.75 ± 0.32 6.69 ± 0.41 18.7 ± 0.37*
MRT0→∞ (min) 9.30 ± 0.45 9.26 ± 0.49 27.1 ± 0.98*
AUC0→tb (mg·min·L-1) 107.2 ± 63.2 243.6 ± 192 494.6 ± 222
AUC0→∞b (mg·min·L-1) 111.6 ± 59.0 250.5 ± 203 512.3 ±245
a, b The compartmental and non-compartmental approach, respectively. * P < 0.05 by one-way ANOVA compared with 5 and
MARIA, L.M.B.; CRISTINA, A.L.; OLGA, J.; ROSA, M.L.R. Determination of quercetin, luteolin, daempferol and isoquercitrin in stamen nelumbinis by capillary zone electrophoresis-ultraviolet detection. Chinese J. Anal. Chem., v.35, p.1187, 2007.
ROGERIO, A.P.; KANASHIRO, A.; FONTANARI, C.; DA SILVA, E.V.G.; LUCISANO-VALIM, Y.M.; SOARES, E.G.; FACCIOLI, L.H. Anti-inflammatory activity of quercetin and isoquercitrin in experimental murine allergic
asthma. Inlamm. Res., v.56, p.402-408, 2007.
SILVA, C.G.; RAULINO, R.J.; CERQUEIRA, D.M.; MANNARINO, S.C.; PEREIRA, M.D.; PANEK, A.D.; SILVA, J.F.M.; MENEZES, F.S.; ELEUTHERIO, E.C.A. In vitro and in vivo determination of antioxidant activity
and mode of action of isoquercitrin and Hyptis fasciculata.
Phytomedicine, v.16, p.761-767, 2009.
WANG, X.R.; ZHOU, Z.H.; DU, A.Q.; HUANG, Z.M. Studies on the lavonol constituents of Abelmoschus manihot L. Chin. J. Nat. Med., v.2, p.91-92, 2004.
YING, X.X.; WANG, R.X.; XU, J.; ZHANG, W.J.; LI, H.B.; ZHANG, C.S.; LI, F.M. HPLC determination of eight
polyphenols in the leaves of Crataegus pinnatiida Bge. var
major. J. Chromatogr. Sci., v.47, p.201-205, 2009.
ZHANG, P.C.; XU, S.X. Chemical constituents from the leaves of Crataegus pinnatifida Bge. var major N E Br. Acta Pharm. Sinic., v.36, p.754, 2001.