CLINICAL SCIENCE
Hyperventilation accelerates the rise of arterial blood
concentrations of desflurane in gynecologic patients
Chih-Cherng Lu,I,IITso-Chou Lin,IChe-Hao Hsu,IMu-Hsien Yu,IIITa-Liang Chen,II Ruei-Ming Chen,IV Chih-Hung Ku,V Shung-Tai HoVI,VIIITri-Service General Hospital, Department of Anesthesiology, Taipei, Taiwan.IITaipei Medical University, Graduate Institute of Clinical Medicine, Taipei, Taiwan.IIINational Defense Medical Center, Department of Obstetrics and Gynecology, Taipei, Taiwan.IVTaipei Medical University, Graduate Institute of Medical Science, Taipei, Taiwan.VNational Defense Medical Center, Department of Medicine, Taipei, Taiwan.VINational Defense Medical Center, Graduate Institute of Medical Science, Taipei, Taiwan.VIITaipei Veterans General Hospital, Department of Medicine, Taipei, Taiwan.
OBJECTIVES: Under a constant inspired concentration, the uptake of a volatile anesthetic into the arterial blood should mainly be governed by alveolar ventilation, according to the assumption that the patient’s cardiac output remains stable during anesthesia. We investigated whether ventilation volume affects the rate of desflurane uptake by examining arterial blood concentrations.
METHOD: Thirty female patients were randomly allocated into the following three groups: hyperventilation, normal ventilation and hypoventilation. Hemodynamic variables were measured using a Finometer, inspiratory and end-tidal concentrations of desflurane were measured by infrared analysis, and the desflurane concentration in the arterial blood (Ades) was analyzed by gas chromatography.
RESULTS: During the first 10 minutes after the administration of desflurane, the Ades was highest in the hyperventilation group, and this value was significantly different from those obtained for the normal and hypoventilation groups. In addition, hyperventilation significantly increased the slope of Ades-over-time during the first 5 minutes compared with patients experiencing normal ventilation and hypoventilation, but there were no differences in these slopes during the periods from 5-10, 10-20 and 20-40 minutes after the administration of desflurane. This finding indicates that there were no differences in desflurane uptake between the three groups after the first 5 minutes within desflurane administration.
CONCLUSIONS:Hyperventilation accelerated the rate of the rise in Ades following desflurane administration, which was time-dependent with respect to different alveolar ventilations levels.
KEYWORDS: Desflurane; Pharmacokinetics; Ventilation; Arterial Blood; End-Tidal.
Lu CC, Lin TC, Hsu CH, Yu MH, Chen TL, Chen RM, et al. Hyperventilation accelerates the rise of arterial blood concentrations of desflurane in gynecologic patients. Clinics. 2012;67(9):1029-1034.
Received for publication onApril 2, 2012;First review completed onApril 7, 2012;Accepted for publication onMay 7, 2012 E-mail: [email protected]
Tel.: 886-2-28757155
INTRODUCTION
Theoretically, the passage of a volatile anesthetic from the alveolar space into the bloodstream depends on several factors, including the inspired anesthetic concentration, ventilation volume, blood-gas partition coefficient, and cardiac output (1-5). Under a constant inspired concentra-tion, the uptake of a volatile anesthetic into the arterial blood should be governed mainly by alveolar ventilation, according to the assumption that a patient’s cardiac output remains stable during anesthesia (5).
Compared with the routinely monitored variable of end-tidal concentration, the arterial concentration of a volatile anesthetic is more likely to represent its concentration in the brain and therefore can be measured to reflect the pharmacological effect of the drug. Our previous study demonstrated that the application of increased alveolar ventilation led to elevated arterial blood isoflurane concen-trations at the time of the initial administration of isoflurane and therefore resulted in its accelerated uptake into the body (6). Similarly, Enekvist et al. demonstrated that ven-tilation with larger tidal volumes under isocapnia increased the rate of the rise in the arterial blood concentrations of sevoflurane compared with the normal tidal volumes (7). Desflurane has been widely used for clinical anesthesia due to its low blood solubility and rapid kinetic characteristics, which permit a more rapid induction and emergence from anesthesia (8,9). However, no studies to date have examined the effect of ventilation on the rate of the rise in the arterial blood desflurane concentration (Ades). Thus, the current Copyrightß2012CLINICS– This is an Open Access article distributed under
the terms of the Creative Commons Attribution Non-Commercial License (http:// creativecommons.org/licenses/by-nc/3.0/) which permits unrestricted non-commercial use, distribution, and reproduction in any medium, provided the original work is properly cited.
study hypothesized that hyperventilation could accelerate the increase in the arterial blood concentration of desflurane to achieve the expected anesthetic depth following intuba-tion in gynecologic patients.
MATERIALS AND METHODS Patients
Our institutional ethical committee on human research approved the study protocol, and informed consent was obtained from each patient. Patients with known pulmonary or cardiovascular diseases were excluded. Thirty female patients, who were classified as physical status I according to the American Society of Anesthesiology and who were scheduled to undergo elective gynecologic surgery under general anesthesia, were recruited for the study. These patients were randomly divided into three ventilation groups: hyperventilation, normal ventilation, and hypoven-tilation. There were three study groups and seven sampling times for the arterial blood desflurane concentrations of each subject. In total, 210 correlated data entries were collected. Generalized estimating equations (GEEs) were introduced as a powerful method to deal with correlated data in applied science (13).
Anesthetic management
Anesthetic premedication consisted of intravenous fenta-nyl (2 mg.kg-1) and midazolam (40 mg.kg-1). Under local anesthesia with 2% xylocaine, a 20-gauge catheter was inserted into the left radial artery for blood sampling. Anesthesia was induced with thiopental (4-6 mg.kg-1), and intubation was facilitated by pretreatment with cis-atracur-ium (0.1 mg.kg-1) and succinylcholine (1.25 mg.kg-1). After
tracheal intubation, a fixed inspiration of 6% desflurane with a 6 L min-1 oxygen flow was administered. With a fixed respiratory rate of 10 min-1, hyperventilation was achieved as an end-tidal CO2 (ETCO2) of approximately 30 mmHg by
adjusting the tidal volume to 8-12 ml.kg-1. The ETCO2goals
were 40 mmHg for the normal ventilation group and 50 mmHg for the hypoventilation group and were achieved by adjusting the tidal volumes to 5-7 and 3-4 ml.kg-1, respectively. In each patient, the surgical procedure was initiated after the 40-minute ventilation study was completed.
Anesthetic gas monitor
The anesthesia machine used in this study was an Aestiva/ 5 with a 7100 ventilator (Datex-Ohmeda, Louisville, CO, USA), and soda lime was used as the CO2 absorber. The
leakage of each system was determined by measuring constant pressure ventilation in a test lung. All results were corrected for any specific leak observed. The anesthetic gas concentrations, inspiratory desflurane concentration (CIdes) and end-tidal desflurane concentration (CEdes), were mon-itored with a multi-gas analyzer (Aestiva/5 Anesthesia System; Datex, Helsinki, Finland). The multi-gas analyzer was calibrated according to the manufacturer’s recommen-dations.
A total of 10 ml of arterial blood was obtained from each patient prior to induction to obtain individual blood/gas partitions (l) and calibration curves of desflurane. At time 0 (before intubation) and at 1, 3, 5, 10, 20, 30, and 40 minutes after intubation, exactly 1.0 ml of arterial blood was drawn from the catheter into a heparinized syringe and then placed immediately in a 10-ml glass vial and tightly sealed. The
blood samples were stored at 4
˚
C, and the measurements were collected within 24 hours. All blood samples were analyzed for desflurane concentration using gas chromato-graphy, according to the method described in our previously published study (5). An additional analysis to determine the arterial blood CO2 concentration using the Ultima GasAnalysis Machine (ABBOTT i-STAT, East Windsor, NJ) was performed at 20 and 40 minutes following desflurane administration. A thermistor inserted into the nasal pharynx was used to measure body temperature, which was main-tained between 35.5 and 37.5
˚
C during the study.Determination of hemodynamic and respiratory variables
The hemodynamic parameters were monitored using a FinometerH(FMS, Finapres Measurement Systems, Arnhem, Netherlands) (10), which provides continuous, non-invasive measurements of blood pressure, heart rate, stroke volume, cardiac output, cardiac index, and total peripheral vascular resistance. The baseline blood pressure measurements were calibrated prior to data collection. Hypotension, which was defined as a decrease in blood pressure of 25% or more from the baseline value, was treated with intravenous fluid and intravenous ephedrine (5 mg bolus). The minute ventilation was calculated as the expiratory tidal volume multiplied by the respiratory rate. The minute alveolar ventilation (MAV) was derived from the minute ventilation, as described in previous publications (11,12).
Determination of arterial blood desflurane concentration over time (the slope of Ades-over-time). The slope of Ades-over-time was calculated at time intervals of 1-5, 5-10, 10-20, and 20-40 minutes after desflurane administration, which represented the rate of desflurane uptake according to the speed of the desflurane vapor that passed from the alveolar space into the circulating arterial blood during each time interval.
Determination of Blood Desflurane Concentration
Before determining the desflurane concentration in the blood, 10 ml of blood from each patient was collected to determine the blood/gas partition coefficient (l) of desflur-ane for each patient (I) (5). The desflurdesflur-ane level in each blood sample was converted to the corresponding concen-tration based on the gas chromatographic measurements and the blood/gas partition coefficient of desflurane (l) of each patient (II).
I. Determination of the blood/gas partition coefficient (l) of desflurane in the blood of each patient. To obtain standard gas partial pressures, five 550-ml glass bottles, each with a turnable stopcock and Teflon septum, were used (19). After flushing each bottle with nitrogen gas for 6 minutes, each Teflon septum was pierced with a syringe needle, and 2, 5, 10, 20, or 50ml of liquid desflurane at 10
˚
C was injected into the bottles. Then, 225 ml of the calculated desflurane gas was obtained from each bottle and injected into a gas chromatography (GC) using a gas-tight Hamilton syringe (Hamilton 250ml syringe, No. 81156). (Hamilton, Reno, NV, USA). The calculated volume percent of desflurane was plotted against the measured gas chromatography counts. The partial pressure was obtained by calculating the volume percent/1006the barometric pressure. We used a similar method to that described by Smith et al. (20).of desflurane were calculated as follows: MW/D = volume for one mole of desflurane liquid; blood/gas partition coefficient (desflurane) = 0.42 (0.40–0.44); MW = molecular weight (for desflurane, 168.04); and desflurane density (d) at 10
˚
C = 1.4892. According to the ideal gas law, one mole of desflurane (MW = 168.04 grams) is equal to 22.4 L of desflurane vapor at 1 atm pressure and 0˚
C. Therefore, 1 ml of desflurane vapor is equal to 7.50 mg. As the temperature increases from 0 to 37˚
C, 1 ml of desflurane vapor should be equal to 6.61 mg, according to the ideal gas law as follows:V37C~
273K
273Kz37K|7:50mg
According to the blood/gas partition coefficient of each patient, we calculated the amount of desflurane in 1 ml that would be required to produce a 1% desflurane concentra-tion in the blood. For example, iflb/gis assumed to be 0.42,
an equilibrated sample of 100 ml of desflurane gas and 100 ml of blood (each at 1% partial pressure) would contain 6.61 mg and 2. mg of desflurane, respectively, at 37
˚
C (1 atm). Therefore, 1 ml of 1% desflurane in blood could be calculated to contain 0.0281 mg of desflurane. In other words, the GC count measured from the headspace was registered as containing 1% of desflurane in the blood after 0.0281 mg of desflurane was injected into a 10-ml vial and equilibrated with 1 ml of blank blood.Gas Chromatography Conditions
The HP 6890 series GC system (Hewlett-Packard, Wil-mington, DE) consisted of a headspace sampler (Agilent G1888), an oven, a flame-ionization detector, and an inte-grator. The oven temperature was set at 40
˚
C, was increased at a rate of 25˚
C per minute to 200˚
C, and was then maintained at this level for 2.60 min. Both the injection and detection temperatures were set at 250˚
C. The inlet pressure was set at 349 kPa. The injection was performed in the direct injection mode. The carrier gas (helium) flow was 25.0 ml min-1. Separation was achieved using a capillary column (HP-5; 30.0 m 0.32 mm I.D., 0.25-mm film thickness) (Restek, Bellefonte, PA). An integrator and a data acquisition system were provided by the HP CHEMOSTATION software. The method used to create calibration curves for measuring the blood desflurane concentrations was modified, as described in our previous publication (5).Statistical analysis
Generalized estimating equations (GEEs) were intro-duced as a method to deal with correlated data in applied
science (13). Patient characteristics, mean arterial blood pressure, heart rate, end tidal CO2, cardiac index, CEdes,
and Ades values were presented as the means (SD) for each of the three groups. GEEs are commonly used to assess the group, time, and group-by-time effects and to adjust the correlations arising from repeated measurements. Moreover, we used estimate and contrast statements to assess the between-group significant differences at various times and the within-group variation in Ades for each group using SAS 9.2 (SAS, Cary, NC). Ap-value,0.05 was considered to represent a significant difference.
RESULTS
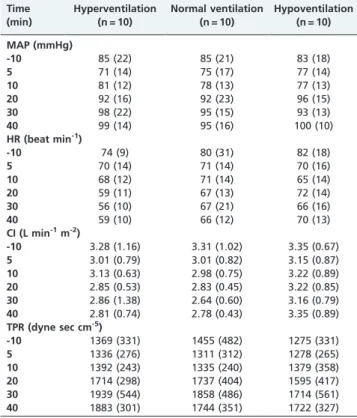
Thirty female patients between the ages of 24 and 55 years (mean age, 43 years) undergoing elective gynecologic surgery were randomly allocated into the following three groups: hyperventilation, normal ventilation and hypoven-tilation. The patient characteristics are shown in Table 1. There were no significant differences between the three groups with regard to the hemodynamic parameters, including arterial pressure, heart rate, cardiac index, and total peripheral resistance, measured at various time intervals (Table 2). The ETCO2 values for the three
ventilation groups during first 40 minutes of the study are displayed in Figure 1. Of the three groups, the mean (SD; range) ETCO2 value was greatest (significant) in the
hypoventilation group (49.7 [1.9; 46-51] mmHg), followed by the normal ventilation group (39.3 [1.9; 38-41] mmHg) and the hyperventilation group (30.1 [1.5; 29-33] mmHg). The mean (SD; range) value for minute alveolar ventilation was greatest (significant) in the hyperventilation group (3334 [(127; 2920-3800] ml.min-1), followed by the normal
ventilation group (2376 [108; 2130-2480] ml.min-1) and the hypoventilation group (1797 [135; 1642-2081] ml.min-1). The mean (SD) blood/gas partition coefficient of desflurane (l) for the 30 patients was 0.42 (0.02).
The Ades values for the three groups during the 40-minute study are depicted in Figure 2. The arterial desflurane concentration was highest in the hyperventila-tion group, followed by the normal ventilahyperventila-tion group and then the hypoventilation group. The pattern of the CEdes-over-time curves (Figure 3) was similar to that of the Ades-over-time curves in all three groups. The CEdes value was highest in the hyperventilation group, followed by the normal ventilation group and then the hypoventilation group during the 40-minute study.
There were significant differences in the arterial desflurane concentrations between the hyperventilation and normal ventilation groups (p= 0.0342) and between the normal
ventilation and hypoventilation groups (p= 0.0083). In
addi-tion, there was an interaction effect for group-by-time
Table 1 -Patient demographic characteristics for the three ventilation groups.
Characteristic
Hyperventilation
(N = 10) Normal ventilation (N = 10)
Hypoventilation (N = 10)
Age, years 47.4 (8.0) 42.0 (9.1) 38.8 (10.7)
Weight, kg 61.8 (6.8) 62.0 (10.1) 58.0 (9.3)
Height, cm 160 (8.3) 165 (4.4) 160 (5.7)
BMI, kg m-2 23.7 (3.9) 22.8 (3.1) 22.5 (2.8)
Fentanyl,mg 110 (15) 125 (40) 115 (35)
cis-atracurium, mg 6.6 (0.4) 6.7 (0.5) 6.3 (0.3)
(hypoventilation vs. normal ventilation, p =0.029), which
indicated significantly higher levels of the arterial desflurane concentration over time in the normal ventilation group compared with the hypoventilation group. Although there was no overall interaction effect for group-by-time (hyper-ventilation vs. normal ventilation; Table 3), there were
significant differences in the arterial desflurane concentration between the hyperventilation and normal groups at the 5th minute (p= 0.0088) and 10thminute (p= 0.0249) following the
administration of desflurane. The significant differences in Ades between the hyperventilation and normal ventilation groups (5th minute: 3.40% and 3.09%, respectively; 10th minute: 3.68% and 3.44%, respectively) and between the hypoventilation and normal ventilation groups at the 1st minute (1.77% and 2.17%, respectively), 3rd minute (2.41% and 2.83%, respectively), and 10thminute (3.08% and 3.44%, respectively) following the administration of desflurane are also shown in Figure 2. The within-group variances for the arterial desflurane concentration (%) significantly increased in each group.
Table 2 -Hemodynamic variables for the three ventilation groups at -10 (10 minutes before the start of the study), 5, 10, 20, 30, and 40 minutes following desflurane
administration.
Time (min)
Hyperventilation (n = 10)
Normal ventilation (n = 10)
Hypoventilation (n = 10)
MAP (mmHg)
-10 85 (22) 85 (21) 83 (18)
5 71 (14) 75 (17) 77 (14)
10 81 (12) 78 (13) 77 (13)
20 92 (16) 92 (23) 96 (15)
30 98 (22) 95 (15) 93 (13)
40 99 (14) 95 (16) 100 (10)
HR (beat min-1)
-10 74 (9) 80 (31) 82 (18)
5 70 (14) 71 (14) 70 (16)
10 68 (12) 71 (14) 65 (14)
20 59 (11) 67 (13) 72 (14)
30 56 (10) 67 (21) 66 (16)
40 59 (10) 66 (12) 70 (13)
CI (L min-1m-2)
-10 3.28 (1.16) 3.31 (1.02) 3.35 (0.67)
5 3.01 (0.79) 3.01 (0.82) 3.15 (0.87)
10 3.13 (0.63) 2.98 (0.75) 3.22 (0.89)
20 2.85 (0.53) 2.83 (0.45) 3.22 (0.85)
30 2.86 (1.38) 2.64 (0.60) 3.16 (0.79)
40 2.81 (0.74) 2.78 (0.43) 3.35 (0.89)
TPR (dyne sec cm-5)
-10 1369 (331) 1455 (482) 1275 (331)
5 1336 (276) 1311 (312) 1278 (265)
10 1392 (243) 1335 (240) 1379 (358)
20 1714 (298) 1737 (404) 1595 (417)
30 1939 (544) 1858 (486) 1714 (561)
40 1883 (301) 1744 (351) 1722 (327)
Values are indicated by the means (SD); MAP: mean arterial pressure; HR: heart rate; CI: cardiac index; TPR: total peripheral resistance.
Figure 1 -End Tidal CO2concentration (ETCO2) time curves under
three different ventilatory states, including hyperventilation (--.--), normal ventilation (--m--),and hypoventilation
(--g--)
during 40 minutes of study.Data are presented as the mean¡ standard deviation.
Figure 2 -Arterial desflurane concentration (Ades) time curves under three different ventilatory states, including hyperventila-tion (--.--), normal ventilation (--m--),and hypoventilation
(--g--)
during 40 minutes of study.Data are presented as the mean¡ standard deviation.Statistically significant differences are shown by * p,0.05 for hyperventilation vs. normal ventilation, and {p,0.05 for hypoventilationvs.normal ventilation.
Figure 3 -End-tidal desflurane concentration (CEdes) time curves under three different ventilatory states, including hyperventila-tion (--.--), normal ventilation (--m--), and hypoventilation
(--g--),
Table 4 displays the slopes of the Ades-over-time curves for the three ventilation groups. During the first 5 minutes following the administration of desflurane, there were significant differences in the slopes of the Ades-over-time curves between the hyperventilation and normal ventilation groups (p= 0.0272) and between the hypoventilation and
normal ventilation groups (p= 0.0343).
DISCUSSION
The novel findings of this study concerned the changes in blood desflurane concentration, which were used to indicate the desflurane concentration in the brain, under different ventilation statuses. Our study demonstrated two main findings. First, hyperventilation significantly accelerated the rise in the arterial blood concentration of desflurane, especially during the first 10 minutes following desflurane administration. In the following 30 minutes, the arterial concentration of desflurane in the hyperventilation group remained greatest, despite insignificant significant differ-ences between groups. Second, the slope of the Ades-over-time curve, which was used to indicate the uptake of desflurane into the blood, was significantly greater in the hyperventilation group but only during the first 5 minutes following desflurane administration. With comparable hemodynamic and ventilatory parameters and a fixed inspired concentration, the changes in the slopes were determined mainly by alveolar ventilation and were time-dependent.
Increased alveolar ventilation resulted in a more rapid change in the desflurane concentration in the Ades and the CEdes, although the CEdes values obtained were significantly higher than the Ades values. In comparison to CEdes, the arterial desflurane concentration is more likely to reflect the desflurane concentration at its site of action – the brain (5). Our study demonstrated that hyperventilation produced a higher arterial blood desflurane concentration than normal ventila-tion and hypoventilaventila-tion during the first 10 minutes follow-ing desflurane administration, which may have provided a deeper state of anesthesia. In contrast, hypoventilation led
to a slower rise in the Ades and provided a lower level of anesthesia.
To understand how ventilation affects Ades, it is necessary to examine the slope of the Ades-over-time curves as well as the time required for desflurane to achieve the functional residual capacity (FRC). Changes in the slope of the Ades-over-time curves represent changes in the rate of desflurane passage into the arterial blood over time, whereas CIdes represents the inspiratory desflurane concentration at the mouth, and the inspiratory alveolar desflurane concentration indicates the inspiratory concentration of desflurane in the alveoli. At the time of desflurane administration, there was no desflurane vapor in the existing FRC at time 0. Moreover, a breathing circuit (estimated 6 L in a Datex AS/5 anesthetic machine) should be filled in 1 minute by 6 L min-1of fresh gas flow with a fixed 6% inspired desflurane concentration, which is followed by the immediate entry of the inspired desflurane into the existing space of the FRC, and the desflurane concentration is then diluted by the existing air in the alveolar space. The inspiratory alveolar desflurane concentration decreases because the volume of the FRC is much larger than the tidal volume. Thus, there is only a very small amount of desflurane to be delivered from the alveoli to the pulmonary capillary blood (a relatively small concentra-tion gradient between the pulmonary capillary circulating blood and alveolar desflurane) during the initial desflurane administration. As ventilation proceeds, the alveolar con-centration of desflurane rises rapidly, depending on the volume of alveolar ventilation, to deliver the desflurane from the alveoli into the pulmonary capillary blood and subse-quently the arterial blood. The slope of the Ades-over-time curve was largest at the onset of desflurane administration and became smaller over time and approached zero for each group. The greatest concentration gradient of desflurane occurred between the alveoli and pulmonary capillary blood under hyperventilation compared to normal ventilation or hypoventilation, which likely hastened the passage of desflurane into the circulating blood during the initial administration of desflurane.
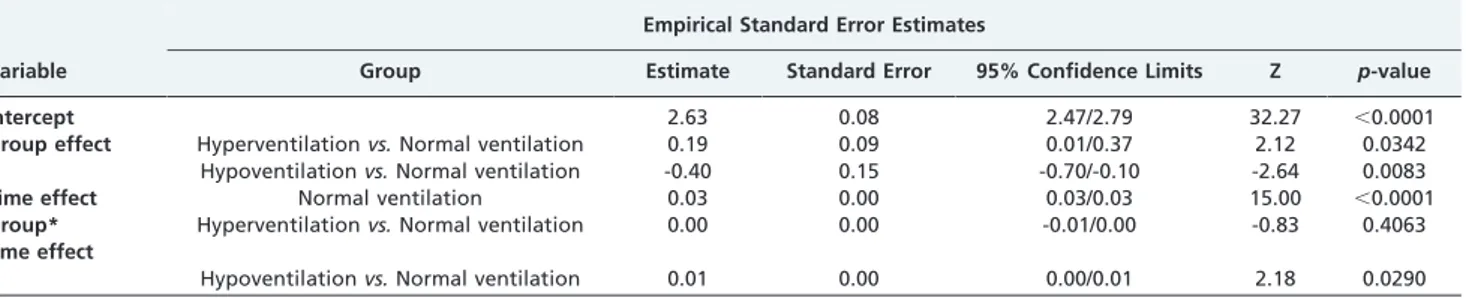
Table 3 -Generalized estimating equation analysis for the arterial desflurane concentrations between the hyperventilation and hypoventilation groups compared with the normal group.
Empirical Standard Error Estimates
Variable Group Estimate Standard Error 95% Confidence Limits Z p-value
Intercept 2.63 0.08 2.47/2.79 32.27 ,0.0001
Group effect Hyperventilationvs.Normal ventilation 0.19 0.09 0.01/0.37 2.12 0.0342
Hypoventilationvs.Normal ventilation -0.40 0.15 -0.70/-0.10 -2.64 0.0083
Time effect Normal ventilation 0.03 0.00 0.03/0.03 15.00 ,0.0001
Group* time effect
Hyperventilationvs.Normal ventilation 0.00 0.00 -0.01/0.00 -0.83 0.4063
Hypoventilationvs.Normal ventilation 0.01 0.00 0.00/0.01 2.18 0.0290
The model has been adjusted for age and BMI. Data were assessed using PROC GENMOD (SAS 9.2 v.).
Table 4 -Mean (SD) values for the slopes of Ades-over-time curves in the three groups at different time periods.
Ventilation 1,5 min 5,10 min 10,20 min 20,40 min
Hyperventilation 0.299 (0.012) * 0.027 (0.014) 0.016 (0.01) 0.002 (0.01)
Normal ventilation 0.230 (0.006) 0.035 (0.007) 0.022 (0.017) 0.008 (0.009)
Hypoventilation 0.193 (0.007){ 0.041 (0.027) 0.041 (0.023) 0.009 (0.011)
Increased ventilation causes a more rapid rise in the CEdes because the FRC wash-in is more rapid and the time constant (FRC/alveolar ventilation) becomes shorter (5), and vice versa. For the calculation, one time constant is derived from the value of the FRC divided by the minute alveolar ventilation. Assuming that the FRC is equal to 2,400 mL in Taiwanese female adults in the supine position (14,15) and the mean alveolar ventilation in the hypoventilation group is 1.793 ml min-1, one time constant for the FRC wash-in should be 1.39 minutes (2400 ml/1793 ml min-1) (16-18). The time
needed to achieve 99% FRC filling was therefore 7.0 minutes (1.34 minutes 65 time constants) in the hypoventilation group. For the normal ventilation and hyperventilation groups, these values were calculated to be 5 minutes (1.0 minutes65 time constants) and 3.6 minutes (0.72 minutes65 time constants), respectively. With the addition of one minute to fill the breathing circuit during the initial administration of desflurane, the estimated differences in the time needed to fill the FRC could explain why the different levels of ventilation produced different effects on the slopes of the Ades-over-time curves, especially during the initial 10 minutes of the study. During the last 30 minutes of the study, the impact of alveolar ventilation on the slope of the Ades-over-time curves disappeared because FRC fill-up was achieved. The effect of alveolar ventilation on the change in the slope of the Ades-over-time curve was time-dependent during desflurane anesthesia.
In conclusion, hyperventilation accelerates the uptake of desflurane within the initial 10 minutes after intubation by achieving higher arterial concentrations. This increased alveolar ventilation also hastens the wash-in of the functional residual capacity to provide more rapid target control of anesthetic depth, which is time-dependent.
ACKNOWLEDGMENTS
This work was conducted in the Tri-Service General Hospital/National Defense Medical Center in Taipei, Taiwan. This study was supported by a grant (NSC96-2314-B-016-011-MY2) from the Taiwan National Council of Science.
AUTHOR CONTRIBUTIONS
Lu CC, Lin TC and Hsu HC performed this clinical study and drafted the manuscript. Ku CH performed the statistical analysis. Ho ST conceived the study and provided the laboratory support to measure the blood desflurane concentration by GC-HS. Yu MH participated in the study design and coordination. Chen TL and Chen RM helped draft the manuscript. All authors read and approved the final version of the manuscript.
REFERENCES
1. Caldwell JE. Desflurane clinical pharmacokinetics and pharmacody-namics. Clin Pharmacokinet. 1994;27(1):6-18, http://dx.doi.org/10.2165/ 00003088-199427010-00002.
2. Patel SS, Goa KL. Desflurane. A review of its pharmacodynamic and pharmacokinetic properties and its efficacy in general anaesthesia. Drugs. 1995;50(4):742-67, http://dx.doi.org/10.2165/00003495-199550040-00010.
3. Rehder K, Sessler AD, Marsh HM. General anesthesia and the lung. Am Rev Respir Dis. 1975;112(4):541-63.
4. Yasuda N, Lockhart SH, Eger EI2nd, Weiskopf RB, Johnson BH, Freire BA, et al. Kinetics of desflurane, isoflurane, and halothane in humans. Anesthesiology. 1991;74(3):489-98, http://dx.doi.org/10.1097/00000542-199103000-00017.
5. Lu CC, Tsai CS, Ho ST, Chueng CM, Wang JJ, et al. Pharmacokinetics of desflurane uptake into the brain and body. Anaesthesia. 2004;59(3):216-21, http://dx.doi.org/10.1111/j.1365-2044.2003.03654.x.
6. Lu CC, Lin TC, Yu MH, Chen TL, Lin CY, et al. Effects of changes in alveolar ventilation on isoflurane arterial blood concentration and its uptake into the human body. Pharmacology. 2009;(3)83:150-6, http:// dx.doi.org/10.1159/000187719.
7. Hargasser S, Hipp R, Breinbauer B, Mielke L, Entholzner E, Rust M. A lower solubility recommends the use of desflurane more than isoflurane, halothane, and enflurane under low-flow conditions. J Clin Anesth. 1995;7(1):49-53, http://dx.doi.org/10.1016/0952-8180(94)00003-M. 8. Wissing H, Kuhn I, Rietbrock S, Fuhr U. Pharmacokinetics of inhaled
anaesthetics in a clinical setting: comparison of desflurane, isoflurane and sevoflurane. Br J Anaesth. 2000;84(4):443-9, http://dx.doi.org/ 10.1093/oxfordjournals.bja.a013467.
9. Walker TJ, Chakrabarti MK, Lockwood GG. Uptake of desflurane during anaesthesia. Anaesthesia. 1996;51(1):33-6, http://dx.doi.org/10.1111/ j.1365-2044.1996.tb07650.x.
10. Guelen I, Westerhof BE, Van Der Sar GL, Van Montfrans GA, Kiemeneij F, et al. Finometer, finger pressure measurements with the possibility to reconstruct brachial pressure. Blood Press Monit. 2003;8(1):27-30, http:// dx.doi.org/10.1097/00126097-200302000-00006.
11. Nunn. JF Applied respiratory physiology, 2nd edition. London: butter-worths. 1977;63-70.
12. Praetel C, Banner MJ, Monk T, Gabrielli A. Isoflurane inhalation enhances increased physiologic deadspace volume associated with positive pressure ventilation and compromises arterial oxygenation. Anesth Analg. 2004;99(4):1107-13, http://dx.doi.org/10.1213/01.ANE. 0000131727.52766.F7.
13. Zeger SL, Liang KY. Longitudinal data analysis for discrete and continuous outcomes. Biometrics. 1986;42(1):121-30, http://dx.doi.org/ 10.2307/2531248.
14. Di Marco F, Rota Sperti L, Milan B, Stucchi R, Centanni S, et al. Measurement of functional residual capacity by helium dilution during partial support ventilation: in vitro accuracy and in vivo precision of the method. Intensive Care Med. 2007;33(12):2109-15, http://dx.doi.org/ 10.1007/s00134-007-0833-6.
15. Weismann D, Reissmann H, Maisch S, Fullekrug B, Schulte J. Monitoring of functional residual capacity by an oxygen washin/washout; technical description and evaluation. J Clin Monit Comput. 2006;20(4):251-60, http://dx.doi.org/10.1007/s10877-006-9029-9.
16. Lin CY. Uptake of anaesthetic gases and vapours. Anaesthesia and Intensive Care. 1994;22(4):363-73.
17. Lin CY, Mostert JW. Inspired O2 and N2O concentrations in essentially closed circuits. Der Anaesthesist. 1977;26(9):514-7.
18. Lin TC, Lu CC, Kuo CK, Hsu CH, Huang GS, Liu JY, et al. Single vital-capacity and successive tidal-volume breathing of sevoflurane in induction of anesthesia for tracheal intubation in gynecologic patients. Acta anaesthesiologica Taiwanica : official journal of the Taiwan Society of Anesthesiologists. 2008;46(2):66-70.
19. Gray WM. A static calibration method for the gas chromatographic determination of per cent concentrations of volatile anaesthetic agents. Br J Anaesth. 1986;58(3):345-52, http://dx.doi.org/10.1093/bja/58.3. 345.