*Correspondence: P. R. S. Ribeiro. Centro de Ciências Sociais, Saúde e Tec-nologia. Universidade Federal do Maranhão. Rua Urbano Santos, s/n - Centro - 65900-000 - Imperatriz – MA, Brasil. E-mail: [email protected]
A
vol. 51, n. 3, jul./sep., 2015 http://dx.doi.org/10.1590/S1984-82502015000300022
Development and application of a portable instrument for drugs
analysis in pharmaceutical preparations
Paulo Roberto da Silva Ribeiro
1,*, Helena Redigolo Pezza
2, Leonardo Pezza
2, Liliane Spazzapam
Lima
2, Matthieu Tubino
31Centre for Social Science, Health and Technology, Federal University of Maranhão, Imperatriz, MA, Brazil, 2Institute of Chemistry, São Paulo State University, UNESP, Araraquara, SP, Brazil, 3Department of Analytical Chemistry, Institute of
Chemistry, State University of Campinas, UNICAMP, Campinas, SP, Brazil
This article describes the application and performance of an inexpensive, simple and portable device for colorimetric quantitative determination of drugs in pharmaceutical preparations. The sensor is a light detector resistor (LDR) incorporated into a black PTFE cell and coupled to a low-cost multimeter (Ohmmeter). Quantitative studies were performed with captopril/p-chloranil/H2O2 and methyldopa/
ammonium molybdate systems. Calibration curves were obtained by plotting the electrical resistance of the LDR against the concentration of the colored species in the ranges 1.84 × 10⁻⁴ to 1.29 × 10⁻³ mol L-1
and 5.04 × 10⁻⁴ to 2.52 × 10⁻³ mol L-1 for captopril/p-chloranil/H
2O2 and methyldopa/ammonium molybdate
systems, respectively, exhibiting good coeicients of determination. Statistical analysis of the results obtained showed no signiicant diference between the proposed methodologies and the oicial reported
methods, as evidenced by the t-test and variance ratio at a 95% conidence level. The results of this study demonstrate the applicability of the instrument for simple, accurate, precise, fast, in situ and low-cost colorimetric analysis of drugs in pharmaceutical products.
Uniterms: Optical sensor/application/colorimetric analysis. Instrumentation/drugs dosage. Drugs/ quantitative analysis. Drugs/dosage. Pharmaceutical formulations/quality control.
Este artigo descreve o desenvolvimento e a aplicação de um dispositivo portátil, simples e barato para a determinação colorimétrica quantitativa de fármacos em formulações farmacêuticas. O sensor é um resistor detector de luz (RDL) colocado numa célula de PTFE e acoplado a um multímetro de baixo custo. Os estudos quantitativos foram realizados utilizando captopril/p-cloranil/H2O2 e metildopa/molibdato de
amônio como sistemas reacionais. As curvas de calibração foram obtidas através da representação gráica
da resistência elétrica do RDL contra a concentração dos complexos coloridos formados nas faixas de 1,84 × 10⁻⁴ e 1,29 × 10⁻³ mol L-1 e 5,04 × 10⁻⁴ e 2,52 × 10- 3 mol L-1 para captopril/p-cloranil/H
2O2 e de
metildopa/molibdato de amônio, respectivamente, com bons coeicientes de determinação. As análises estatísticas dos resultados obtidos mostraram que não houve diferença signiicativa entre os métodos propostos e os métodos oiciais como evidente a partir dos testes “t-Student” e F-Fisher, com nível de
coniança de 95%. Os resultados deste estudo demonstram que o instrumento proposto neste trabalho é simples, de fácil operação, baixo custo e apresentou boa exatidão e boa precisão para o doseamento de fármacos em medicamentos.
INTRODUCTION
Captopril, 1-[(2S)-3-mercapto-2-methylpropionyl]-L-proline (Figure 1), (CPT) is an angiotensin-converting enzyme inhibitor, which reduces peripheral resistance and lowers blood pressure. It is extensively used for the treatment of hypertension (Florey, 1988) and congestive failure (Brunton, Chabner, Knollman, 2010).
In order to assure the quality of CPT containing pharmaceutical formulations, several analytical techniques have been used for determination of the drug, including batch fluorimetry (Hormozi-Nezhad et al., 2013), chemiluminescence (Zhang et al., 2009), high-performance liquid chromatography (Karakosta, Tzanavaras, Themelis, 2012), electrochemical methods (Jamali, Karimi-Maleh, Khalilzadeh, 2014; Ensafi et al., 2011; Karimi-Maleh, Ensafi, Allafchian, 2010; Khalilzadeh et al., 2010), volumetric titration (USP, 2007), difuse relectance spectroscopy (Ribeiro; Pezza; Pezza, 2011) and spectrophotometry (Gouda, Amin, 2010; El-Didamony, Erfan, 2010; Ribeiro, Pezza; Pezza, 2010; Ribeiro et al., 2011; Silva, Matos, Ribeiro, 2014).
Methyldopa, α-methyl-3,4-dihydroxyphenylalanine (Figure 2), (MTD) is a catechol derivative (catecholamine) widely used as a antihypertensive agent. It is a centrally acting alpha2-adrenoreceptor agonist, which reduces sympathetic tone and produces a decrease in blood pressure (Brunton, Chabner, Knollman, 2010).
Several types of analytical procedures have been employed for the analysis of MTD in pharmaceutical formulations and/or biological samples. Of the techniques
used in several procedures most are based on kinetic measurements (James; Hoo; William, 2006), high-performance liquid chromatography (Bahrami, Kiani, Mirzaeei, 2006; Muzzi et al., 2008; Li et al., 2010), voltammetry (Rezaei, Askarpour, Ensafi, 2013), spectrophotometry (Gadkariem et al., 2009; Brasil, 2010; Matos,Silva; Ribeiro, 2012; Ribeiro, Pezza, Pezza, 2005; Ribeiro, 2005) and difuse relectance spectroscopy (Ribeiro, Pezza, Pezza, 2006).
However, some of these methods are inherently expensive, time consuming, laborious and not well suited for process control monitoring. In addition, chromatographic methods are slow and require expensive and complicated instrumentation, features rendering them unattractive for routine analysis. The titrimetric method can sufer from a lack of speciicity and sensitivity under certain circumstances, such as in the presence of unsaturated organic compounds. The proposed approach is relatively reliable, low cost and suiciently compact to be applied even by untrained personnel. Thus, there is considerable interest in the development of highly reliable, cost efective, sensitive, and selective detection devices for determination of CPT and MTD in marketed dosage formulations.
Instrumentation has become integral to chemical measurements. A multimeter is an essential piece of equipment on an electrician´s workbench. It is a universal instrument, useful not only for measuring electrical quantities, such as voltage, current, and resistance, but also for testing electrical and electronic circuits.
T h u s , t h e m u l t i m e t e r c o u l d a l s o b e a v e r y useful instrument for the chemistry laboratory bench. C o n t e m p o r a r y e l e c t r o n i c s a n d i n s t r u m e n t a t i o n have reached a level of application that allows the measurement, direct or indirect, of chemical quantities. These measurements involve the encoding of chemical information into electrical signals. This transduction can be carried out through a variety of physical and chemical principles, and in most cases, the resultant electrical quantity can be measured using a multimeter. Colorimetric (Acharya, Jayaraman, 1995; Richter, Rocha, Angnes, 2004; Rossi, He, Tubino, 2000; Wang, 2000), potentiometric (Barnard, 1968; Ooba, 1991; Richter, 2003; Sevilla, Alfonso, Andres, 1993; Vreman, 1994; Watanabe, 1997) and conductometric (Sevilla, Alfonso, Andres, 1993; Yue, Ngin, Hailin, 1996) systems based on a multimeter have been described in the literature.
Coupled with optical sensors and transducers, the multimeter could constitute a means of measuring chemical parameters. Optical sensors are of great interest because of their favorable characteristics when compared FIGURE 1 - Chemical structure of captopril.
to other kinds of sensors. Portable optical sensors in particular are useful for enabling in situ chemical analysis (Arnold, 1992; Seitz, Sepaniak, 1988; Wang, 2000).
Moreover, optical sensor-based instruments are simple to assemble, low cost, versatile, and can be employed in the determination of many chemical parameters with promising results. Thus, the objective of this study was to describe the application of a portable instrument for determination of CPT and MTD in pharmaceutical formulations. The results showed good concordance with those obtained by the USP standard procedure (USP, 2007) for CPT and Brazilian Pharmacopoeia standard procedure (Brasil, 2010) for MTD, at a 95% conidence level.
MATERIAL AND METHODS
Apparatus
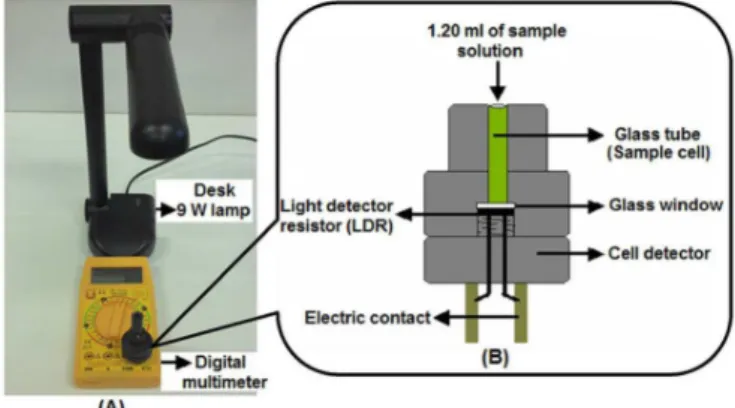
A prototype of the portable device (Figures3A and 3B) was used for all resistance measurements performed in this study (Rossi, He, Tubino, 2000). A 9 W Startec desk lamp was used as the light source, placed at a distance of around 17.0 cm from the cell. A MinipaET-1502 digital multimeter was used to collect the resistance measurements. An ordinary glass tube with internal diameter of 5.0 mm and length of 50.0 mm was used as the sample cell.
Volume measurements were made with a plunger-operated pipetter (100-1000 µL) and Metrohm model 665 automatic burettes. All experiments were performed in a thermostatically-controlled room (25±1) °C.
Reagents and solutions
All reagents and chemicals used were analytical
grade and solvents were spectroscopic grade. Deionized water was used for the preparation of solutions and samples.
Captopril/p-chloranil/H2O2 system
CPT (reference substance) was purchased from Purifarma, São Paulo, Brazil (purity grade > 99.9%, calculated on dried basis). CPT characteristics were consistent with the United States Pharmacopoeia (USP) (USP, 2007). A stock solution (CPTS – 4.65 x 10⁻³ mol
l-1) of CPT standard was prepared daily by dissolving
10.0 mg of the reference substance in methanol and diluting to the mark in a 10.0 mL volumetric flask. Working standard solutions were obtained by appropriate dilution of the stock solution with the same solvent and standardized using the standard procedure reported in the official method of the USP (USP, 2007).
p-Chloranil (Sigma-Aldrich) solution (0.5% w v-1)
was prepared daily by dissolving 125.0 mg in 25 mL of 1,4-dioxane (Mallinckrodt - p.a. grade).
H2O2 10.35 mol L-1 (Merck) was standardized
(Vogel, 1986) by titration with potassium permanganate and utilized in the experiments.
Pharmaceutical formulations (tablets) of four commercial brands were analyzed. The tablets were purchased from local drugstores and all were tested prior to the listed expiration date. All pharmaceuticals studied were package labeled as containing 25.0 mg of CPT per tablet.
Methyldopa/ammonium molybdate system
Stock 4.65 x 10⁻³ mol L-1 MTD (Sigma, St.
Louis, MO, USA, 99.95%) solution was prepared daily by dissolving 50.0 mg of the drug in 50.0 mL of deionized water. Using a mechanical shaker, the powder completely disintegrated after shaking for 15 minutes. Working standard solutions were obtained by appropriate dilution of this stock solution with the same solvent and were standardized by the standard procedure reported in Brazilian Pharmacopoeia (Brasil, 2010).
Ammonium molybdate [(NH4)6.Mo7.O24.4H2O)] was purchased from Merck (Darmstadt, Germany, p. a.). The ammonium molybdate aqueous solution 1.0% (m v-1)
was prepared daily.
Pharmaceutical formulations (tablets) of four commercial brands were analyzed. These tablets were purchased from local drugstores and all were tested prior to the listed expiration date. All pharmaceuticals studied were package labeled as containing 250 and 500 mg of MTD per tablet.
Methodology
Captopril/p-chloranil/H2O2 system
• Procedure for calibration curve
The calibration curve was constructed by transferring 800 µL of CPT working standard solutions (comprising 1.84 x 10⁻⁴ to 1.29 x 10⁻³ mol L-1 of this compound) into
each series of 5.0 mL standard lasks. A total of 900 µL of p-chloranil solution (0.5% w v-1), 225 µL of H
2O2
10.35 mol l-1 and 2 mL of methanol was added to each
standard flask and left to stand at 50 °C for 30 min (Ribeiro, 2011). The blank solution was prepared in a similar manner, but omitting the CPT. A constant volume of 1200 µL of this solution was introduced into the sample cell with micropipette and the resistance measurements were obtained against the corresponding reagent blank. Calibration graphs were prepared by plotting the electrical resistance of the LDR against drug concentration. The graphs, or the corresponding linear least squares equations, were used to convert the resistance measurement into CPT concentration for any given sample analyzed.
• Procedure for assay of CPT in pharmaceutical samples
Four commercial brands of CPT tablets (A, B, C and D) sourced from local drugstores were randomly selected and analyzed using the portable electrochemical device. For the determination of CPT in pharmaceutical samples, twenty tablets were weighed to calculate the average tablet weight. Tablets were inely powdered and homogenized. A portion of this powder, equivalent to ca. 10.0 mg of CPT, was accurately weighed and dissolved in 7 mL of methanol by shaking for 15 min on a mechanical shaker. The resulting mixture was iltered through Whatman ilter paper No. 41 into a 10 mL volumetric flask. The filter paper was washed using solvent and iltrate. The washing was subsequently transferred to a volumetric lask and the volume made up to the mark. Aliquots of 1000 µL from this solution were transferred into 5.0 mL graduated lasks and analyzed according to the recommended procedure for the calibration curve. The quantity per tablet was calculated from the standard calibration graph.
Methyldopa/ammonium molybdate system
• Procedure for calibration curve
A volume of 1000 µL of MTD working standard solutions was transferred into each series of 5.0 mL standard flasks, comprising 5.04 x 10⁻⁴ to 2.52 x 10⁻³
mol L-1 of the drug. A total of 1000 µL 2.0% ammonium
molybdate was added to each graduated flask and the volume completed with deionized water (Ribeiro, 2005). The blank solution was prepared in a similar manner, but omitting the MTD. A constant volume of 1200 µL of this solution was introduced into the sample cell with micropipette and resistance measurements were obtained against the corresponding reagent blank. Calibration graphs were prepared by plotting the electrical resistance of the LDR against drug concentration. These graphs, or the corresponding linear least squares equations, were used to convert resistance measurement into captopril concentration for any given sample analyzed.
• Procedure for assay of MTD in pharmaceutical samples
Four commercial brands of MTD tablets (E, F, G and H) sourced from local drugstores were randomly selected and analyzed using the portable electrochemical device. The average tablet weight was calculated from the contents of 20 tablets. Tablets were inely powdered and weighed. A portion of this powder, equivalent to ca. 200.0 mg of MTD, was accurately weighed and dissolved in 80 mL of water by shaking for 15 min on a mechanical shaker. The resulting mixture was transferred into 100.0 mL graduated lasks and the volume completed with deionized water. This solution was clariied by passing it through a cotton column ilter, rejecting the irst 20 mL. Aliquots containing equivalent to 1.51 x 10⁻³ mol L-1 were transferred into
5.0 mL graduated lasks and analyzed according to the recommended procedure for the calibration curve. The quantity per tablet was calculated from the standard calibration graph.
Repeatability study (precision)
To examine the repeatability of the measurement system, replicate (n = 10) determinations were made for the solutions (samples C and F) containing equivalent to 7.36 x 10⁻⁴ mol L-1 of CPT and 1.51 x 10⁻³ mol L-1 of MTD,
respectively. These solutions were analyzed according to the recommended procedures for the assay of CPT and MTD content in pharmaceutical formulations. The precisions were calculated in terms of percentage relative standard deviation (% RSD).
Accuracy/recovery studies
by addition of known amounts (1.66 x 10⁻⁴; 1.84 x 10⁻⁴;
2.02 x 10⁻⁴ and 2.21 x 10⁻⁴ mol L-1 of CPT and 4.54 x
10-4; 5.04 x 10⁻⁴; 5.54 x 10⁻⁴ and 6.05 x 10⁻⁴ mol L-1 of
MTD, corresponding to levels of 90; 100; 110 and 120%, of these drugs, respectively) of the standard substance (pure drugs) to a known concentration of the previously analyzed commercial tablets (CPT: samples A, B, C and D - MTD: samples E, F, G and H). The resulting mixtures were analyzed according to the recommended procedure for the assays of CPT and MTD content in pharmaceutical formulations. Drug recovery was calculated by comparing the concentration obtained from the spiked mixtures with those of the pure drugs.
RESULTS AND DISCUSSION
Colorimetry involves the measurement of the concentration of chemical species through the amount of light absorbed at certain wavelengths. The extent of absorption of light is measured based on the intensity of the radiation transmitted by the sample solution (Holler, 2009).
A m u l t i m e t e r c a n p e r f o r m c o l o r i m e t r i c measurements when coupled with a photodetector, such as a light-dependent resistor (LDR). The LDR is a semiconductor whose resistance depends on the intensity of the radiation striking its surface. The value of the resistance of the sensor (LDR) decreases as the intensity of the incident light increases (Rossi, He, Tubino, 2000). Thus, for quantitative purposes, calibration curves can be obtained by plotting the electrical resistance of the LDR (R) against the analyte concentration (C) by a linear relationship. In the present study, a multimeter was used to measure the resistance of the LDR.
Captopril/p-chloranil/H2O2 system
CPT is a nitrogenous compound that acts as n-donors to the π-acceptors. These acceptors react with the basic nitrogenous compounds to form charge transfer complexes or radical anions according to the polarity of the solvent used (Bebawy, 1999). Hence p-chloranil was used in this stage of work as the reagent for the determination of CPT in the presence of hydrogen peroxide. The addition of H2O2 to the reaction medium increases the reaction
rate (Sawyer, 1991; Mattos et al., 2003). The optimum experimental conditions and studies of the stability of this product were established in a study previously conducted at our laboratory (Ribeiro, 2011). Thus, the experimental conditions used in the present study were the same as those utilized in the previously tested approach.
The relationship between the electrical resistance of the LDR and the concentration of CPT under optimal conditions was examined. The analytical curve (Figure 4) was obtained by the method of least squares from eleven points, each of which was the average of three determinations. This curve was obtained by plotting the electrical resistance of the LDR against the CPT concentration over the range 1.84 x 10⁻⁴ to 1.29 x 10⁻³ mol L-1
of CPT in the inal solution, exhibiting a good coeicient of determination (R2 = 0.9946; slope = 1871.0 ± 61.5 L mol-1
cm-1 and intercept = 0.181 ± 0.033). The limit of detection
(3.SDblank) (Long, Winefordner, 1983) was 1.54 x 10⁻⁵ mol L-1
of CPT under the experimental conditions described.
The coefficient of determination is not a true indicator of linearity, therefore the Fischer variance ratio (Araujo, 2009) (test of linearity) was used. The test of linearity was performed using the Statistica v. 10.0 statistical software.
Thus, the test for adequateness of the linearity model allows the validity of the regression model and the chosen working range to be veriied. The ANOVA lack of it model is based on the comparison of the tabulated F of Fischer values with the observed F of Fischer calculated on the basis of the experimental results, and on the sums of squares (Bratinova, Rafael, Simoneau, 2009). On the test of linearity, i.e. Fischer variance ratio, the calculated value of Flack of it (Fcal = 0.75) for the analyte was less than
the tabulated F value (FTab (5,14) = 2.96), indicating linearity of response.
Methyldopa/ammonium molybdate system
that the best analytical wavelength is located at 410 nm. The optimum experimental conditions and studies of the stability of this product were established in a study previously conducted at our laboratory. Thus, the experimental conditions used in the present study were the same as those utilized in the previous study.
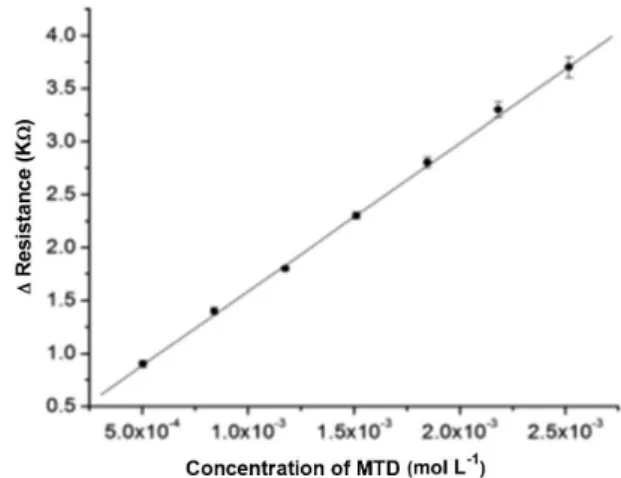
The analytical curves were obtained by the method of least squares from eleven points, each of which was the average of three determinations. This curve (Figure 5) was obtained by plotting the electrical resistance of the LDR against the MTD concentration over the range 5.04 x 10⁻⁴ to
2.52 x 10⁻³ mol L-1 of MTD in the inal solution, exhibiting
a good coeicient of determination (R2 = 0.9980; slope =
1397.2 ± 28.0 L mol-1 cm-1 and intercept = 0.188 ± 0.035).
The limit of detection (3.SDblank) (Long; Winefordner, 1983)
was 7.99 x 10⁻⁵ mol L-1 of MTD under the experimental
conditions described. On the test of linearity by the ANOVA lack of it model, the calculated value of Flack of it (Fcal = 0.53) for the analyte was less than the tabulated F value (FTab (5,14)
= 2.96), indicating linearity of response.
Analytical applications and repeatability studies
In order to assess the utility of the present portable device, it was applied to provide an estimation of CPT and MTD in commercial tablets. The samples were prepared and analyzed according to recommended procedures. The measurement system was then successfully applied for drug determination in four tablet formulations of these drugs. The results, presented in Table I, compare favorably with the oicial methods of the USP for CPT (USP, 2007) and of the Brazilian Pharmacopoeia for MTD (Brasil,
2010), attesting to the applicability of the proposed device for the determination of CPT in pharmaceutical dosage forms.
Comparing the results obtained using the proposed device against those obtained by the official methods, based on the Student’s t values (accuracy) and on the F test (precision) concordance was observed for the 95% (α = 0.05) conidence level (Miller; Miller, 1993). Thus, both Student’s t and F tests showed statistical equivalence between the results of the proposed device and the official methods, thereby attesting to the applicability of the proposed device for the determination of drugs in pharmaceutical dosage forms.
The RSD values obtained using the proposed device for the samples ranged from 0.4 to 1.9% for CPT and 0.4 to 2.2% for MTD, as shown in Table I. According to Horwitz (1982), the maximum RSD value acceptable
TABLE I - Results of CPT and MTD assays in tablets
Sample Label valuea
Proposed portable device Oicial method
Foundb RSD
(%)c
t-value (2.78)d
F-value
(19.00)d Found
b RSD
(%)c Determination of CPT in commercial pharmaceutical preparations
A 25.0 25.4±0.1 0.4 2.07 1.00 24.9±0.1 0.4
B 25.0 25.6±0.2 0.8 2.52 1.00 24.6±0.2 0.8
C 25.0 25.4±0.2 0.8 2.10 1.00 24.8±0.2 0.8
D 25.0 25.8±0.5 1.9 1.59 2.78 25.2±0.3 1.2
Determination of MTD in commercial pharmaceutical preparations
E 250.0 257.6 ± 1.0 0.4 2.05 1.23 256.3 ± 0.9 0.4
F 250.0 254.0 ± 1.5 0.6 2.69 1.14 258.3 ± 1.6 0.6
G 500.0 510.1 ± 1.0 0.2 0.19 3.24 510.3 ± 1.8 0.4
H 500.0 507.5 ± 11.4 2.2 0.80 1.60 513.9 ± 9.0 1.7
aLabel for content of tablets: mg unit –1. bAverage value ± standard deviation (SD) of three determinations. cRelative standard
deviation (RSD) of three determinations. dFigures between parentheses are theoretical values of t and F at P = 0.05
for the working level of the analyte (1.15 x 10⁻³ mol l-1)
is 8.0%. The AOAC (1993) set the maximum acceptable RSD value at 5.3% for the same analyte level.
The repeatability of the measurement system was investigated. The relative standard deviations (RSDs) were 1.0% and 1.6% for solutions (n = 10) containing CPT and MTD, respectively. These results are evidence of good repeatability of the measurement system for drugs analysis.
Accuracy/recovery studies
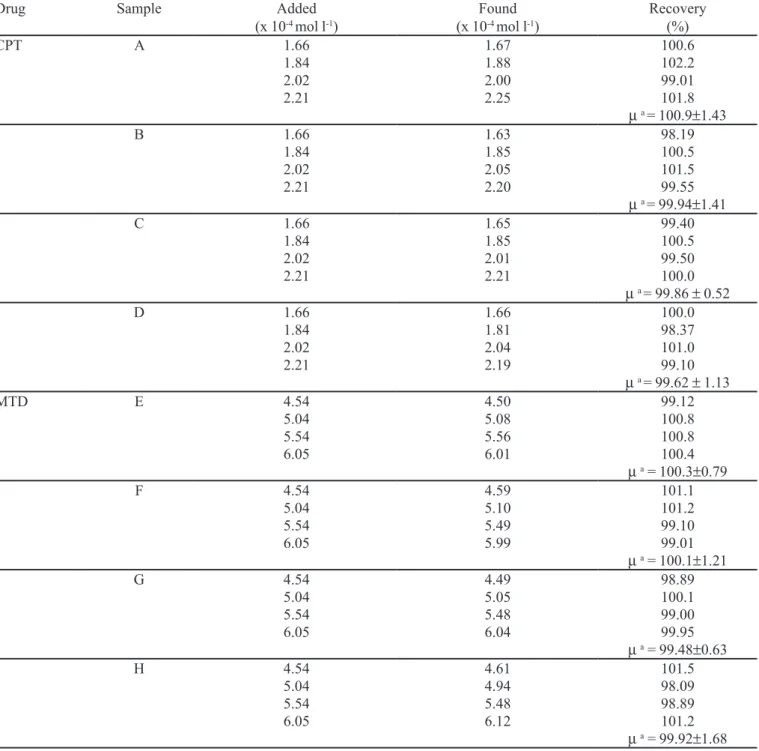
To ascertain the accuracy and precision of the portable device, recovery studies were carried out (n = 3) by spiking diferent concentrations of pure drugs in the pre analyzed samples with four diferent concentrations of standards within the analytical concentration range of the proposed method. The results of the recovery tests are given in Table II. The recovery (mean values) for
TABLE II - Recovery study data for CPT and MTD using proposed device
Drug Sample Added
(x 10-4 mol l-1)
Found (x 10-4 mol l-1)
Recovery (%)
CPT A 1.66
1.84 2.02 2.21 1.67 1.88 2.00 2.25 100.6 102.2 99.01 101.8 µ a = 100.9±1.43
B 1.66 1.84 2.02 2.21 1.63 1.85 2.05 2.20 98.19 100.5 101.5 99.55 µ a = 99.94±1.41
C 1.66
1.84 2.02 2.21 1.65 1.85 2.01 2.21 99.40 100.5 99.50 100.0 µ a = 99.86 ± 0.52
D 1.66 1.84 2.02 2.21 1.66 1.81 2.04 2.19 100.0 98.37 101.0 99.10 µ a = 99.62 ± 1.13
MTD E 4.54
5.04 5.54 6.05 4.50 5.08 5.56 6.01 99.12 100.8 100.8 100.4 µ a = 100.3±0.79
F 4.54 5.04 5.54 6.05 4.59 5.10 5.49 5.99 101.1 101.2 99.10 99.01 µ a = 100.1±1.21
G 4.54
5.04 5.54 6.05 4.49 5.05 5.48 6.04 98.89 100.1 99.00 99.95 µ a = 99.48±0.63
H 4.54 5.04 5.54 6.05 4.61 4.94 5.48 6.12 101.5 98.09 98.89 101.2 µ a = 99.92±1.68
samples within the 99.62-100.9% range and RSDs within 0.52-1.43% for CPT and within the 99.48-100.3% range and RSDs within 0.63-1.68% for MTD, confirmed an accurate and precise measurement system for application to pharmaceutical dosage forms.
CONCLUSION
Based on the above results and from general observations in the laboratory, it can be concluded that the very simple and portable device proposed by Rossi, He, Tubino, (2000) can be used for colorimetric quantitative determination of drugs in pharmaceutical preparations. Statistical comparison of the results for the portable device against those for the oicial reported methods indicated no signiicant diference in accuracy and precision at a 95% conidence level . Additionally, the device fulills all the main requirements of routine analysis as it is robust and has low instrumentation and operational cost in comparison to chromatographic methods.
Thus, the results obtained demonstrate clearly demonstrate the potential alternative use of this measurement system for the quality control of drugs. Moreover, this instrument has applicability for simple, accurate, precise, fast, in situ and low-cost colorimetric analysis of drugs in pharmaceuticals products.
ACKNOWLEDGEMENTS
We would like to thank the FUNDUNESP, CAPES and FAPESP Foundations (Brazil) for inancial support and Prof. Adriana V. Rossi for donating the prototype of the portable electrochemical device used in this study.
REFERENCES
ACHARYA, Y.B.; JAYARAMAN, A. Sun Photometry Using
Photodiode Open-Circuit Voltage Measurements. Rev. Sci.
Instrum.,v.66, n.8, p.4087-4090, 1995.
ASSOCIATION OF OFFICIAL ANALYTICAL CHEMISTS.
AOAC. Peer veriied methods program: manual on policies
and procedures. Arlington, USA: AOAC International, 1993.
ARAUJO, P. Key aspects of analytical method validation and linearity evaluation. J. Chromatogr. B, v.877, n.23, p.2224-2234, 2009.
ARNOLD, M.A. Fiberoptic Chemical Sensors. Anal. Chem.,
v.64, n.21, p.A1015-A1025, 1992.
BAHRAMI, G.; KIANI, A.; MIRZAEEI, S. A rapid high performance liquidchromatographic determination of
methyldopa in human serum with luorescence detection
and alumina extraction: application to a bioequivalence study. J. Chromatogr. B, v.832, n.2, p.197-201, 2006.
BARNARD, W.R.; KELLEY, J.C.; GIDDEN, R.; EBERHARDT, W. A lecture Room Digital Multimeter. J. Chem. Educ., v.45, n.3, p.206-210, 1968.
BEBAWY, L. I.; EL-KOUSY, N.; SUDDIK, J.K.; SHOKRY, M. Spectrophotometric determination of fluoxetine and sertraline using chloranil, 2, 3 dichloro-5, 6 dicyano benzoquinone and iodine. J. Pharm. Biom. Anal., v.21, n.1, p.133-142, 1999.
BRASIL. Farmacopéia Brasileira. Brasília: Agência Nacional
de Vigilância Sanitária - Anvisa, 2010. 2v.
BRATINOVA, S.; RAFFAEL, B.; SIMONEAU, C. Guidelines
for performance criteria and validation procedures of analytical methods used in controls of food contact materials. 1.ed. .Luxembourg: Office for Official Publications of the European Communities, 2009. 74 p.
BRUNTON, L.; CHABNER, B.; KNOLLMAN, B (Eds.)
Goodman and Gilman’s The pharmacological basis of therapeutics. 20. ed. New York: Mcgraw-Hill, 2010. 1891 p.
EL-DIDAMONY, A.M.; ERFAN, E.A.H. Utilization of oxidation reactions for the spectrophotometric determination
of captopril using brominating agents. Spectrochim. Acta
Part A, v.75, n.3, p.1138-1145, 2010.
ENSAFI, A.A.; KARIMI-MALEH, H.; MALLAKPOUR, S.; REZAEI, B. Highly sensitive voltammetric sensor based on catechol-derivative-multiwall carbon nanotubes for the catalytic determination of captopril in patient human urine samples. Colloids Surf. B, v.87, n.2, p.480-488, 2011.
FLOREY, K. Analytical proiles of drug substances. San Diego:
Academic Press, 1988. v.17, 799 p.
GOUDA, A.A.; AMIN, A.S. Copper(II)–neocuproine reagent for spectrophotometric determination of captopril in pure form and pharmaceutical formulations. Arab. J. Chem., v.3, n.3, p.159-165, 2010.
HOLLER, F. J.; SKOOG, D.A.; CROUCH, S.R. Princípios de
análise instrumental. Porto Alegre: Bookman Companhia Editora, 2009. 1054 p.
HORMOZI-NEZHAD, M.R.; BAGHERI, H.; BOHLOUL, A.; TAHERI, N.; ROBATJAZI, H. Highly sensitive turn-on
luorescent detection of captopril based on energy transfer between luorescein isothiocyanate and gold nanoparticles. J. Lumin., v.134, n.1, p.874-879, 2013.
HORWITZ, W. Evaluation of Analytical Methods Used for
Regulation of Foods and Drugs. Anal. Chem.,v.54, n.1,
p.67-76, 1982.
JAMALI, T.; KARIMI-MALEH, H.; KHALILZADEH, M.A. A novel nanosensor based on Pt:Co nanoalloy ionic liquid carbon paste electrode for voltammetric determination of vitamin B9 in food Samples. LWT Food Sci. Technol., v.57, n.1, p.679-685, 2014.
JAMES, T.S.; HOO, C.L.O.; WILLIAM, D.M. Determination of methyldopa in pharmaceutical dosage forms and biological
luids based on oxidation at the tubular carbon electrode. J. Pharm. Sci., v.63, n.1, p.954- 955, 2006.
KARAKOSTA, T.D.; TZANAVARAS, P.D.; THEMELIS, D.G. Automated determination of total captopril in urine by liquid chromatography with post-column derivatization coupled to on-line solid phase extraction in a sequential injection manifold. Talanta, v.88, n.1, p.561-566, 2012.
KARIMI-MALEH, H.; ENSAFI, A.A.; ALLAFCHIAN, A.R. Fast and sensitive determination of captopril by voltammetric method using ferrocenedicarboxylic acid
modiied carbon paste electrode.J. Solid State Electrochem.,
v.14, n.1, p.9-15, 2010.
KHALILZADEH, M.A.; KARIMI-MALEH, H.; AMIRI, A . ; G H O L A M I , F. ; M O TA G H E D M A Z H A B I , R . Determination of captopril in patient human urine using
ferrocenemonocarboxylic acid modiied carbon nanotubes
paste electrode. Chin. Chem. Lett. , v.21, n.2, p.1467-1470, 2010.
LI, S.F.; WU, H.L.; YU, Y.J.; LI, Y.N.; NIE, J.F.; FU, H.Y.; YU, R.Q. Quantitative analysis of levodopa, carbidopa and methyldopa in human plasma samples using HPLC-DAD combined with second-order calibration based on alternating trilinear decomposition algorithm. Talanta, v.81, n.3, p.805-812, 2010.
LONG, G.L.; WINEFORDNER, J.D. Limit of Detection. Anal.
Chem., v.55, n.7, p.712-715, 1983.
MATTOS, I.L.; SHIRAISHI, K.A.; BRAZ, A.D.; FERNANDES, J.R. Peróxido de hidrogênio: importância e determinação.
Quim. Nova, v.26, n.3, p.373-380, 2003.
MATOS, O.R.; SILVA, F.C. D.; RIBEIRO, P.R.D. A new, simple and sensitive analytical method for determination of methyldopa in pharmaceutical formulations using the 2, 2-diphenyil-picrylhydrazyl. Lat. Am. J. Pharm., v.31, n.2, 2012.
MILLER, J.C.; MILLER, J.N. Estadística para química
analítica. Addison: Wesley Iberoamericana S. A., 1993. 222 p.
MUZZI, C.; BERTOCCI, E.; TERZUOLI, L.; PORCELLI, B.; CIARI, I.; PAGANI, R.; GUERRANTI, R. Simultaneous determination of serum concentrations of levodopa,
dopamine, 3-O-methyldopa and α-methyldopa by HPLC.
Biomed. Pharmacother., v.62, n.4, p.253-258, 2008.
OOBA, S. An Automatic Titrator for Measurement of Exchange
Capacity and Titration Curve of Ion-Exchanger. Bunseki
Kagaku,v.40, n.4, p.T87-T90, 1991.
REZAEI, B.; ASKARPOUR, N.; ENSAFI, A.A. Adsorptive stripping voltammetry determination of methyldopa on the surface of a carboxylated multiwall carbon nanotubes modified glassy carbon electrode in biological and pharmaceutical samples. Colloids Surf. B, v.109, n.1, p.253-258, 2013.
RIBEIRO, P.; PEZZA, L.; PEZZA, H. Spectrophotometric d e t e r m i n a t i o n o f m e t h y l d o p a i n p h a r m a c e u t i c a l formulations. Eclet. Quim.,v.30, n.3, p.23-28, 2005.
R I B E I R O , P. ; P E Z Z A , L . ; P E Z Z A , H . A s i m p l e spectrophotometric method for the determination of captopril in pharmaceutical preparations using ammonium
RIBEIRO, P.R.; PEZZA, L.; PEZZA, H.R.; TOGNOLLI, J.O. Spectrophotometric Determination of Captopril Through Charge Transfer Complex Formation Using Fractional
Factorial and Central Composite Design. Lat. Am. J.
Pharm., v.30, n.6, p.1158, 2011.
RIBEIRO, P.R.S.; GOMES NETO, J.A.; PEZZA, L.; PEZZA, H.R. Flow-injection spectrophotometric determination of
methyldopa in pharmaceutical formulations. Talanta,v.67,
n.1, p.240-244, 2005.
RIBEIRO, P.R.S.; PEZZA,L.; PEZZA, H.R. Determination of methyldopa in pharmaceutical formulations by combined
spot test-difuse relectance spectroscopy. J. Braz. Chem. Soc., v.17, n.4, p.674-679, 2006.
RIBEIRO, P. R. S.; PEZZA, L.; PEZZA, H. R. A Simple and
Environmentally Friendly Relectometric Method for the
Rapid Quantitative Analysis of Captopril in Pharmaceutical Formulations. Eurasian J. Anal. Chem.,v. 6, n.2, p. 90-103, 2011.
RICHTER, E. M.; DOSIL, P.J.; NEVES, C.A; LAGO, C.L.; ANGNES, L. Aplicações eletroanalíticas com eletrodos
de prata confeccionados a partir de CDs graváveis. Quim.
Nova,v.26, n.6, p.839-843, 2003.
RICHTER, E.M.; ROCHA, F.R.; ANGNES, L. Multímetro interfaceado de baixo custo para aquisição de dados. Quim. Nova, v.27, n.2, p.313-314, 2004.
ROSSI, A.V.; HE, X.W.; TUBINO, M. A simple, portable and low cost device for a colorimetric spot-test quantitative analysis. Anal. Lett.,v.33, n.9, p.1885-1898, 2000.
SAWYER, D.T. Oxygen chemistry. New York: Oxford
University Press, 1991. 215 p. (The International series of monographs on chemistry, 26).
SEITZ, W.R.; SEPANIAK, M.J. Chemical sensors based on
immobilized indicators and iber optics. CRC Cr. Rev. Anal. Chem., v.19, n.2, p. 135-173, 1988.
SEVILLA III, F.; ALFONSO, R.L.; ANDRES, R.T. The electrician’s multimeter in the chemistry teaching
laboratory: Part 2: Potentiometry and conductimetry. J.
Chem. Educ.,v.70, n.7, p.580, 1993.
S I LVA , F. C . M . , M AT O S , O . R . ; R I B E I R O , P. R . S . Development and validation of a new, simple and sensitive spectrophotometric method for the determination of
captopril in marketed dosage formulations. Lat. Am. J.
Pharm., v.33, n.1, p.142-150, 2014.
UNITED STATES PHARMACOPEIA. USP. The National
Formulary. 25. ed. Twinbrook Parkway: Rockville, USA: The United States Pharmacopeial Convention, 2007.
VOGEL, A. Vogel: análise inorgânica quantitativa. 4.ed. São
Paulo: Guanabara, 1986. 690 p.
VREMAN, H.J.; STEVENSON, D.K.; OH, W., FANAROFF, A.A.; WRIGHT, L.L.; LEMONS, J.A.; WRIGHT, E., SHANKARAN, S.,TYSON, J.E.; KORONES, S.B. et al. Semiportable Electrochemical Instrument for Determining
Carbon-Monoxide in Breath. Clin. Chem.,v.40, n.10,
p.1927-1933, 1994.
WANG, L. Q; DANG, G.; ZHENG, L., YUAN, K. A simple optical fiber reflectance spectrophotometer and its
application in identiication of pigments on relics. Chinese J. Anal. Chem.,v.28, n.4, p.513-517, 2000.
WATANABE, K.; OKADA, K.; ODA, H.; KATSU, T.. Development of a portable cocaine-selective electrode.
Bunseki Kagaku,v.46, n.12, p.1019-1023, 1997.
YUE, F.; NGIN, T.S.; HAILIN, G.A novel paper pH sensor based on polypyrrole. Sensor Actuat. B-Chem., v. 32, n. 1, p. 33-39, 1996.
ZHANG, G.B.; TANG, Y.H.; LI, H.Y.; YU, H.L.; SUN, S.J. Chemiluminescence of potassium permanganate-glyoxal-sulfur contained compound system. Anal. Lett., v.42, n.2, p.440-459, 2009.
Received for publicationon on 23th October 2014