Article
Printed in Brazil - ©2012 Sociedade Brasileira de Química0103 - 5053 $6.00+0.00A
*e-mail: [email protected]
Photophysics and Spectroscopic Properties of Zinc Phthalocyanine Revisited using
Quantum Chemistry
Leonardo T. Ueno,*,a Cristiano C. Jayme,a Lucilia R. Silva,a Estevão B. Pereira,b
Samuel M. de Oliveirab and Antonio E. H. Machadob,c
aFaculdade de Ciências Integradas do Pontal, Universidade Federal de Uberlândia,
Rua 20, 1600, 38304-402 Ituiutaba-MG, Brazil
bLaboratório de Fotoquímica e Química dos Materiais (LAFOT-QM), Instituto de Química,
Universidade Federal de Uberlândia, Av. João Naves de Ávila, 2121, 38400-902 Uberlândia-MG, Brazil
cDepartamento de Química, Universidade Federal de Goiás, Campus Catalão,
Av. Dr. Lamartine Pinto de Avelar, 1120, 75704-020 Catalão-GO, Brazil
Este estudo fornece uma avaliação teórica do comportamento fotofísico da ftalocianina de zinco (FtZn) usando teoria do funcional da densidade (DFT) e a sua abordagem dependente do tempo (TD-DFT), baseado na combinação do funcional híbrido B3LYP e o conjunto de base 6-311+G(d,p). A influência da solvatação foi estimada utilizando o método IEFPCM (modelo do contínuo polarizável) e considerando DMSO (dimetilsulfóxido) como solvente. Os espectros de absorção simulados foram baseados no cálculo dos primeiros 40 estados excitados sendo que os oito picos mais intensos podem ser atribuídos às bandas Q e Soret (B). Comprimento de onda de emissão de fluorescência e tempo de vida radiativo foram calculados utilizando a abordagem TD-DFT e comparados com dados experimentais. O fenômeno de cruzamento intersistema (CIS) da FtZn foi atribuído ao acoplamento spin-órbita induzida pelo Zn2+ pelo fato dos estados singlete
e triplete adjacentes possuirem a mesma simetria orbital. Os dados de fosforescência em fase gasosa também foram comparados.
This study provides a theoretical evaluation of the photophysical behavior of zinc phthalocyanine (ZnPc) using density functional theory (DFT) and its time-dependent (TD-DFT) approach, based on the combination of the B3LYP hybrid functional and the 6-311+G(d,p) basis set. The influence of solvation was estimated using IEFPCM (integral equation formalism approach of polarizable continuum model) considering DMSO (dimethyl sulfoxide) as solvent. The simulated absorption spectra were based in the calculation of the first 40 excited states being that the eight most intense peaks could be assigned to the Q and Soret (B) bands. Fluorescence emission wavelength and radiative lifetime were calculated using the TD-DFT approach and compared to experimental data. The ZnPc intersystem crossing (ISC) phenomena was attributed to spin-orbit coupling induced by Zn2+ since the adjacent singlet and triplet states have the same orbital symmetry. The
phosphorescence data in gas phase were also compared.
Keywords: zinc phthalocyanine, TD-DFT, absorption spectra, fluorescence, phosphorescence
Introduction
Metal phthalocyanine (MePc) is an important class of aromatic dyes, extensively studied by several reasons. As a dye, MePc present an intense π → π* absorption in the visible spectra. The Pc ring can form compounds with almost every metal, giving rise normally to very
stable systems. This high stability and photophysical behavior lead the interest in applications in several areas, like photoconducting materials,1 photosensitizers for
photodynamic therapy (PDT),2 non-linear optical devices,3
solar cells,4,5 photocatalysts,6 gas sensors,7 optical data
storage8 and electrochromic devices.9
Zn2+ d10-configuration, simplifying the spectra in relation
to other metal phthalocyanines. This compound presents an intense Q band around 670 nm and a much broader and less defined B band with maxima near 300 nm. The Gouterman model, involving four orbitals, was the first theoretical approach to study the absorption features (Q and B bands) of phthalocyanine spectra.10 Schaeffer et al.11 proposed an
assignment for the absorption spectra of MePcs reporting the existence of five bands (Q, B, N, L and C), with increasing energies and related to the most intense π → π* transitions, being the B band formed by the overlapping of two sub bands (B1 and B2). The interest in the photophysics of ZnPc and other MePcs is related to the capability of some of these compounds, including ZnPc, to sensitize the production of singlet oxygen by energy transfer,12 important
for the application of these compounds as photosensitizers in photodynamic therapy.13 The photophysics of ZnPc
has been extensively studied by many researchers.14-16
Fluorescence quantum yields and other parameters have been reported in different solvents.14
Absorption and photoluminescence of ZnPc have been studied with the use of a great variety of experimental techniques. The first reference on spectroscopic studies is related to Linstead group, who reported the synthesis and UV-Vis spectral data for a number of metal phthalocyanines, including ZnPc.17-19 UV-Vis absorption spectra of ZnPc
has been obtained in various media: gas phase,20-22 argon
matrices,23,24 low temperature supersonic jet expansion,25
solution.23,26-28 A number of experimental studies of the
excited states of ZnPc thin films are available29,30 as well
as the absorption properties of ZnPc adsorbed in Nafion film.31 Magnetic circular dichroism (MCD) is an important
technique that allows studying transitions not observable in typical UV-Vis technique. MCD measurements in ZnPc were done by Mack and Stillman32,33 and VanCott et al.24
The theoretical approach to study the electronic structure of ZnPc has been concerned to understand the features of UV absorption spectra using semi empirical or DFT-based methods. Semi empirical ZINDO method generated orbital ordering similar to that proposed with Gouterman’s model.34-36 The time-dependent density functional theory
(TD-DFT) has been employed with relative success in several studies.37-42 The effect of peripheral groups on the
electronic structure and properties of unbounded and bonded metal phthalocyanines were investigated by Liao et al.37
Liao and Scheiner38 investigated the electronic structure and
bonding in metal phthalocyanines and obtained Q and Soret transition energies. The structure and ground-state spectra (Q and Soret bands) for derivatives of ZnPc were studied by Nguyen and Pachter.39 Ground and excited states of
ZnPc were studied in details by Ricciardi et al.,40 with the
prediction of the lowest excited triplet states and Q to far UV C and X bands. The ZnPc Jahn-Teller triplet distorted structures were studied by Nguyen and Pachter41 with the
optimization of the lowest triplet state.
This work aims to provide accurate data related to photophysical properties of ZnPc using TD-DFT methods43
for the system in gas phase and solvated (DMSO, dimethyl sulfoxide). DMSO is one of the best solvents for dissolving such compound and our group has a considerable amount of experimental data related to the photophysics of ZnPc and its aggregates and the nature of ZnPc as sensitizer for the production of singlet oxygen, which is intended to be present in a later work. Absorption spectra, fluorescence and phosphorescence data were obtained and compared to experimental data.
Methodology
The geometry optimization of the ground state of ZnPc (1A
1g) was made with the DFT method based on the
B3LYP hybrid functional and the 6-311+G(d,p) basis set. Absorption spectra with the analysis of the first singlet excited states from ground state geometry were done using TD-DFT and the above mentioned basis set. The same calculation was carried out simulating the solvation of ZnPc in DMSO using the integral equation formalism approach of polarizable continuum model (IEFPCM).44 The
PCM method is a solvation model in which the solvent is represented by a homogeneous continuum medium that is polarized by the solute placed in a cavity. The solvent electrostatic effects are represented by a set of discrete charges distributed on the molecular cavity surface and the solute-solvent interactions are described in terms of a solvent reaction field which can be partitioned into many contributions, related to dispersion, repulsive and electrostatic forces.
The S1 and T1 states were optimized with TD-DFT
method, using the B3LYP functional and 6-31G(d) basis set. The optimization of these excited state were made with the use of analytical gradient derived from Berny optimization algorithm included in Gaussian 09 software.45
This procedure was employed to study the fluorescence and phosphorescence phenomena, with the symmetry change from D4h to D2h, leading to the optimization of the (1)1B2u
state for S1. The change in the state symmetry was made
manually, with small atomic displacements from D4h
structure. In the search of the most stable S1 structure, the
D2h symmetry gives the most favorable state. The inclusion
excited state geometry was optimized under solvation equilibrium. The data related to state-specific solvation equilibrium of the excited state were used to compute the energy of the ground state with non-equilibrium solvation, giving the related fluorescence energy.
The lowest triplet state ((1)3B
2u, D2h symmetry) was
optimized starting from S1 optimized geometry. This
was done by two different procedures with the purpose of comparison. The first one was based on the use of the B3LYP hybrid functional and the 6-311+G(d,p) basis set, whereas the second was done using TD-DFT and the same hybrid functional and the 6-31G(d) basis set.
The calculation of spontaneous emission rates, related to Einstein coefficient (A21), and radiative lifetime were
done using the following expression,
(1)
in which A21 and trad have as dimensional units, respectively,
s-1 and s. The dipole moment operator (µ) present in
transition moment integral and the vertical energy (Eve) are in atomic unit. ψ1 and ψ2 are respectively the wave
function of the ground and excited state. The transition moment integral was obtained from the oscillator strength data using the following expression,
(2)
where f is the oscillator strength of the transition and n is the frequency of the photon related to this transition.
All calculations were done using the software Gaussian 09.45
Results and Discussion
ZnPc in the ground state ((X)1A
1g) possesses D4h
symmetry and electronic configuration …14(b2g)2 2(b1u)2
5(eg)2 6(a2u)2 6(eg)2 3(b2u)2 16(b1g)2 2(a1u)2. Vibrational
frequency calculation was done to verify that the optimized structure of ZnPc is located in a minimum in the potential energy surface. Data related to ground state geometry and vibrational spectra were obtained from Ueno et al.46
The irreducible representation of the dipole operator at this symmetry is (A2u + Eu). Therefore, the transitions
starting from the ground state are allowed by dipole only for the A2u (z polarized) and Eu (x, y polarized) states,
being prohibited for the remaining states. From the 40 excited states obtained from TD-DFT/6-311+G(d,p), the transitions from the ground state with nonzero intensities generated a total of eight peaks in the spectra, with seven transitions related to Eu state and one to A2u. The results in
gas phase and in DMSO are presented in Table 1, together with experimental and other theoretical values.
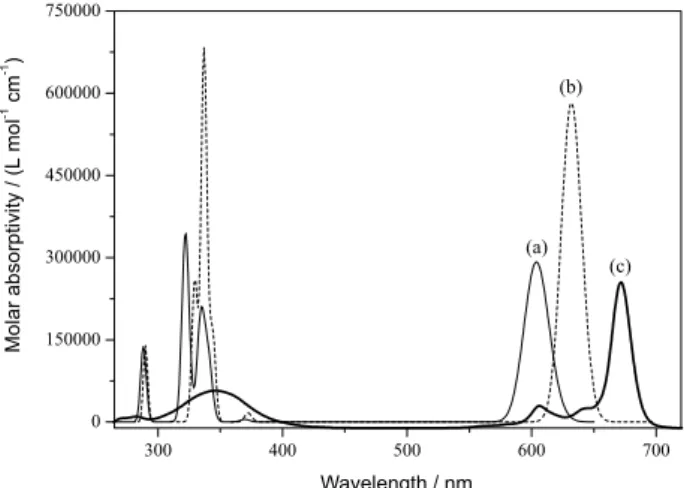
Through the spectra presented in Figure 1, the Q and Soret (B) bands are clearly displayed. The important and characteristic Q peak is related to 2a1u (HOMO) → 7eg (LUMO) electronic transition, from
the ground to the first excited state (1)1E
u, a π → π*
transition, with the orbitals presented in Figure 2. For the isolated system, the intense Q peak transition energy at 2.05 eV is nearly similar to the reported in other TD-DFT calculations (1.96, 2.09 eV),37,39,40 and more displaced from
the data furnished from ZINDO and Slater transition state methods (1.84, 1.76, 1.44 eV).34-36,38 Experimental data
in gas phase, under supersonic jet, cryogenic matrix and Ar matrix suggest values related to Q transition between 1.85 and 1.98 eV,1,20,24,25,27 slightly smaller than our TD-DFT
forecast. The inclusion of solvent effects (DMSO) with the IEFPCM model leads to a diminishing of the excitation energy of the Q band, from 2.05 to 1.96 eV, with the consequent shift of the maximum absorption wavelength from 604 to 632 nm. The intensity of this transition also increased, with the oscillator strength changing from 0.433 to 0.648, an increase of about 50%, in agreement with the expected stabilization of the molecule when solvated. The bathochromic shift of 28 nm is related to the destabilization of the 2a1u (HOMO) orbital due to the
fact that all remained transitions to 7eg (LUMO) presented
almost the same energy with the solvent inclusion. There is no theoretical work concerned to the study of the peak displacement under the presence of solvent. Ogunsipe et al.14
reported an experimental bathochromic effect with DMSO equal to 12 nm.
There is experimental evidence on the occurrence of a weak π-π* transition with a partial contribution of n,π* transition,24,27,47 with a solvent polarity-dependent
absorption peak near 606 nm in DMSO. The second excited state (S2) found in our TD-DFT calculations is
a ((1)1E
g) n,π* state, a transition forbidden by orbital
symmetry, with an excitation energy equal to 3.18 eV (390 nm) and consequently very far from Q band. Thus, in this work, it was not possible to describe the weak
π-π* transition close to the Q band. Similarly, in other TD-DFT and ZINDO calculations, the authors were also unable to describe this transition.34,37,39,40 A possibility to
elucidate it should be using elaborate multiconfigurational methods, like CASSCF, CASPT2 or MRCI.
The great difficulty in the study of phthalocyanine absorption spectra is to assign the broad profile of the B band. The transition to (2)1E
u state presents a very
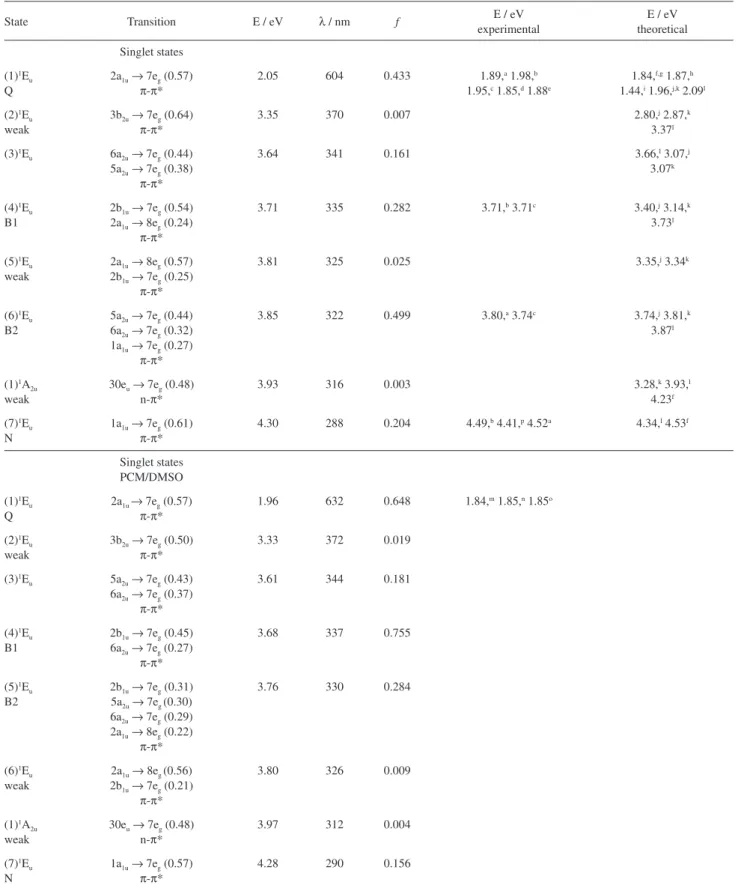
Table 1. Excitation energies of the lowest singlet states and oscillator strength (f) of ZnPc molecule with and without solvent (IEFPCM/DMSO), obtained with TD-DFT/B3LYP/6-311+G(d,p) methodology. The values in parenthesis are the largest coefficients in the CI expansion of the most important transitions. The calculations were carried out using the ground state optimized geometry
State Transition E / eV λ / nm f experimentalE / eV theoreticalE / eV
Singlet states
(1)1E u
Q
2a1u→ 7eg (0.57)
π-π*
2.05 604 0.433 1.89,a 1.98,b
1.95,c 1.85,d 1.88e
1.84,f,g 1.87,h
1.44,i 1.96,j,k 2.09l
(2)1E u
weak
3b2u→ 7eg (0.64)
π-π*
3.35 370 0.007 2.80,j 2.87,k
3.37l
(3)1E
u 6a2u→ 7eg (0.44)
5a2u→ 7eg (0.38)
π-π*
3.64 341 0.161 3.66,l 3.07,j
3.07k
(4)1E u
B1
2b1u→ 7eg (0.54) 2a1u→ 8eg (0.24)
π-π*
3.71 335 0.282 3.71,b 3.71c 3.40,j 3.14,k
3.73l
(5)1E u
weak
2a1u→ 8eg (0.57) 2b1u→ 7eg (0.25)
π-π*
3.81 325 0.025 3.35,j 3.34k
(6)1E u
B2
5a2u→ 7eg (0.44) 6a2u→ 7eg (0.32) 1a1u→ 7eg (0.27)
π-π*
3.85 322 0.499 3.80,a 3.74c 3.74,j 3.81,k
3.87l
(1)1A 2u
weak
30eu→ 7eg (0.48) n-π*
3.93 316 0.003 3.28,k 3.93,l
4.23f
(7)1E u
N
1a1u→ 7eg (0.61)
π-π*
4.30 288 0.204 4.49,b 4.41,p 4.52a 4.34,l 4.53f
Singlet states PCM/DMSO
(1)1E u
Q
2a1u → 7eg (0.57)
π-π*
1.96 632 0.648 1.84,m 1.85,n 1.85o
(2)1E u
weak
3b2u→ 7eg (0.50)
π-π*
3.33 372 0.019
(3)1E
u 5a2u→ 7eg (0.43)
6a2u→ 7eg (0.37)
π-π*
3.61 344 0.181
(4)1E u
B1
2b1u→ 7eg (0.45) 6a2u→ 7eg (0.27)
π-π*
3.68 337 0.755
(5)1E u
B2
2b1u→ 7eg (0.31) 5a2u→ 7eg (0.30) 6a2u→ 7eg (0.29) 2a1u→ 8eg (0.22)
π-π*
3.76 330 0.284
(6)1E u
weak
2a1u→ 8eg (0.56) 2b1u→ 7eg (0.21)
π-π*
3.80 326 0.009
(1)1A 2u
weak
30eu→ 7eg (0.48) n-π*
3.97 312 0.004
(7)1E u
N
1a1u→ 7eg (0.57)
π-π*
4.28 290 0.156
configuration of this state is dominated by the one electron 3b2u→ 7eg (π-π*) transition, with a small contribution
of the 5a2u → 7eg transition. The peak related to this
transition is difficult to be observed experimentally due to the very small values of oscillator strength (0.007 and 0.019, respectively in gas phase and in DMSO). This state was described by other TD-DFT calculations,37,39,40 being
our value for the gas phase similar to the reported by Nguyen and Pachter,39 and about 0.4-0.5 eV greater than
the reported by Liao et al.37 and Ricciardi et al.40 Using the
ZINDO method,34 a weak transition related to a E u state
(p,p*) at 3.72 eV (333 nm) was also found. However, this state presents a different electronic configuration.
The state (3)1E
u is also related to a π-π* transition.
It involves the electron transfer from 5a2u and 6a2u to
Figure 2. Occupied and virtual orbitals of ZnPc, obtained with B3LYP/6-311+G(d,p). Figure 1. Calculated absorption spectra of zinc phthlalocyanine:
7eg orbital, with similar weight in the configuration
interaction (CI) wave function related to the excited state. The inclusion of DMSO did not alter the transition energy and intensity, being that this peak presents a medium intensity. Similarly, Nguyen and Pachter39 and Liao et al.37
reported the same by using TD-DFT. Ricciardi et al.40
reported a similar transition but with weak intensity. The first intense peak in the B band seems to be related to a transition to (4)1E
u state, assigned by us as B1 peak. The
dominant transition is 2b1u→ 7eg, with minor contribution
of 2a1u→ 8eg (gas phase) and 6a2u→ 7eg (DMSO). The
sequence of bands in the spectra used in this work is the same proposed by Stillman and Nyokong1 (Q, B1, B2, N,
L and C), following the crescent transition energy. The energy related to B1 in gas phase (3.71 eV) is coincident with the experimental data.20,25 The inclusion of DMSO
leads to a considerable increase in transition intensity, with oscillator strength presenting a large variation, from 0.282 to 0.755. There is no experimental or theoretical data related to B1 in DMSO.
The (5)1E
u state presents two dominant configurations,
being the 2a1u→ 8eg the most important. It is noteworthy
that the state energy of (5)1E
u alters in the presence of
DMSO, with the gas phase (5)1E
u state being related to
(6)1E
u in DMSO. In both cases, the transition is very weak,
with oscillator strength respectively equal to 0.025 and 0.009, being certainly very difficult to be observed experimentally. This weak transition was also studied by Ricciardi et al.40 and Liao et al.,37 but in both TD-DFT
studies the excitation energies are about 0.46 eV smaller when compared to the value reported in this study.
The (6)1E
u state ((5)1Eu with DMSO) relates to the
intense B2 transition. In the TD-DFT calculation, the
B2 peak is more intense than B1 in gas phase, but this order is changed in DMSO, being B1 considerably more intense than B2. This is a state with a multiconfigurational character, with transitions with similar contribution to the excited state wave-function. The inclusion of DMSO leads to a decrease of the energy gap between B2 and B1, reducing the difference from 13 nm (gas phase) to 7 nm (DMSO), increasing even more the overlapping between these bands.
The (1)1A
2u state originates from an n,π* transition
(30eu → 7eg), with the orbitals shown in Figure 2.
The inclusion of DMSO did not alter both transition energies and oscillator strengths. This state is not observable experimentally, but it is described by other theoretical studies,34,39,40 being suggested in all cases a
very weak transition. Finally, the last observable transition refers to the N band, related to (7)1E
u state. This band is
due to a π,π* transition with a dominant configuration generated by 1a1u→ 7eg. The inclusion of solvent did not
change significantly the transition energy, but the peak intensity presented a small decrease. The transition energy in gas phase (4.30 eV) is smaller when compared with experimental and other theoretical data.
Fluorescence
Geometric parameters for ZnPc in gas phase and under a continuous dielectric simulating the solvent (DMSO) in the ground (X1A
1g), S1 ((1)1B2u) and T1 (3B2u) states, optimized
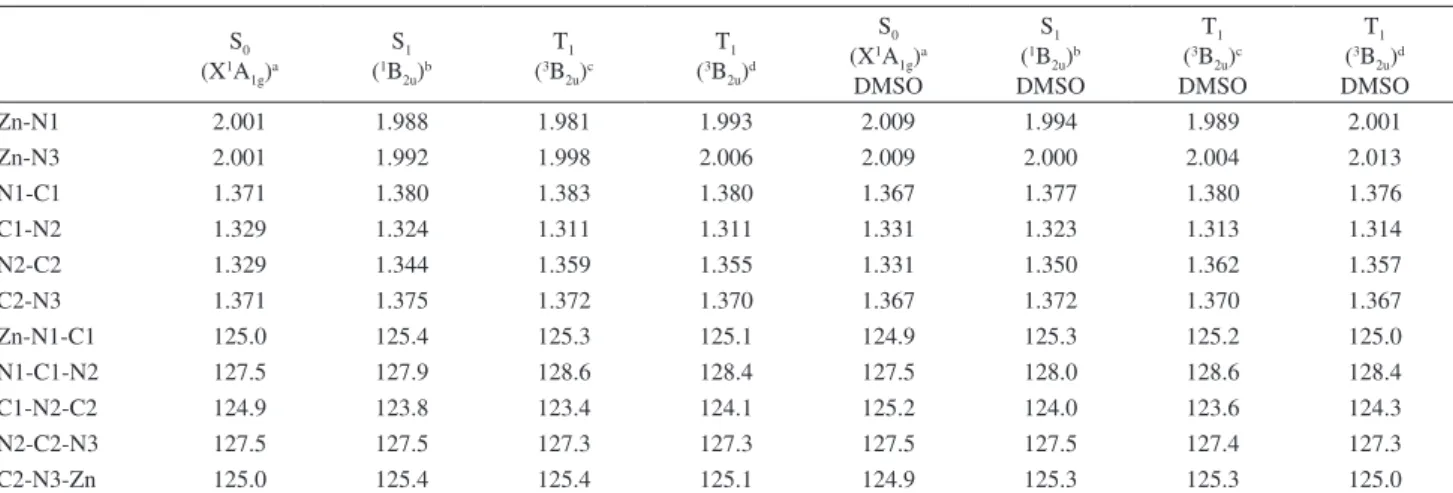
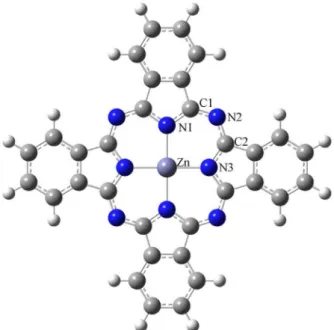
by the TD-DFT approach using B3LYP functional and 6-31G(d) basis set, are presented in Table 2. The numbering of atoms is presented in Figure 3. The geometric changes between these states are small, with difference between
Table 2. Geometrical parameters of the ground state (S0), first singlet (S1) and triplet excited state (T1) optimized with and without solvent
(IEFPCM/DMSO), distances (R) in angstrom (Å) and angles (θ) in degrees
S0
(X1A 1g)a
S1
(1B 2u)b
T1
(3B 2u)c
T1
(3B 2u)d
S0 (X1A
1g)a
DMSO
S1 (1B
2u)b
DMSO
T1 (3B
2u)c
DMSO
T1 (3B
2u)d
DMSO
Zn-N1 2.001 1.988 1.981 1.993 2.009 1.994 1.989 2.001
Zn-N3 2.001 1.992 1.998 2.006 2.009 2.000 2.004 2.013
N1-C1 1.371 1.380 1.383 1.380 1.367 1.377 1.380 1.376
C1-N2 1.329 1.324 1.311 1.311 1.331 1.323 1.313 1.314
N2-C2 1.329 1.344 1.359 1.355 1.331 1.350 1.362 1.357
C2-N3 1.371 1.375 1.372 1.370 1.367 1.372 1.370 1.367
Zn-N1-C1 125.0 125.4 125.3 125.1 124.9 125.3 125.2 125.0
N1-C1-N2 127.5 127.9 128.6 128.4 127.5 128.0 128.6 128.4
C1-N2-C2 124.9 123.8 123.4 124.1 125.2 124.0 123.6 124.3
N2-C2-N3 127.5 127.5 127.3 127.3 127.5 127.5 127.4 127.3
C2-N3-Zn 125.0 125.4 125.4 125.1 124.9 125.3 125.3 125.0
aOptimized with B3LYP/6-311+G(d,p); boptimized with TDDFT/B3LYP/6-31G(d); coptimized with TDDFT/B3LYP/6-31G(d); doptimized with
distances not greater than 0.019 Å and between angles lower than 1.2°. The state energies, calculated using the 6-311+G(d,p) basis set, done after optimization of the first excited state (S1), are presented in Table 3.
The S1 geometry presents two singlet states with close
energy in gas phase system (1.97 and 2.07 eV) and in DMSO (1.87 and 2.02 eV), while the remaining states present energy close and greater than 3.0 eV. These two lowest singlet states originate from the loss of degeneracy of (1)1E
u in the D4h ground state optimized structure, with
both states presenting a π,π* character. Table 4 presents the data related to vertical emission (Eve) and band origin (E0),
which is related to the fluorescence emission wavelength whose scheme is shown in Figure 4. The similar emission bandwidth for the gas phase and DMSO indicates a non strong dependence with the surrounding environment. On the vertical emission, the Stokes shift was of 24 nm in gas phase, while in DMSO this difference increased to 30 nm. The calculated Eve for ZnPc in gas phase is approximately Figure 3. Molecular structure of zinc phthlalocyanine and numbering
of atoms.
Table 3. Energies of the lowest singlet and triplet states of ZnPc molecule with and without solvent (IEFPCM/DMSO), obtained with
TD-DFT/B3LYP/6-311+G(d,p) methodology. The values in parenthesis are the largest coefficients in the CI expansion of the most important transitions. The calculations were carried out using the first excited state (S1) optimized geometrya
State Transition E / eV λ / nm Transition E / eV λ / nm
Singlet states Singlet states
PCM/DMSO (1)1B
2u 4au→ 7b2g (0.69)
π-π*
1.97 628 4au→ 7b2g (0.70)
π-π*
1.87 662
(1)1B
1u 4au→ 7b1g (0.68)
π-π*
2.07 598 4au→ 7b1g (0.69)
π-π*
2.02 613
(1)1B
2g 37ag→ 7b2g (0.69) n-π*
3.05 407 37ag→ 7b2g (0.71) n-π*
2.89 428
(1)1B
3g 6b1g→ 7b2g (0.70)
π-π*
3.21 387 (1)1B
1g
37ag→ 7b1g (0.71) n-π*
3.13 396
Triplet states Triplet states
PCM/DMSO (1)3B
2u 4au→ 7b2g (0.72)
π-π*
0.98 1270 4au→ 7b2g (0.72)
π-π*
0.95 1311
(1)3B
1u 4au→ 7b1g (0.71)
π-π*
1.19 1046 4au→ 7b1g (0.71)
π-π*
1.22 1015
(2)3B
1u 8b3u→ 7b2g (0.38)
9b3u→ 7b2g (0.54)
π-π*
2.77 447 8b3u→ 7b2g (0.40)
9b3u→ 7b2g (0.53)
π-π*
2.75 452
(1)3B
3g 6b1g→ 7b2g (0.61)
4au→ 10b3u (0.21)
π-π*
2.83 438 6b1g→ 7b2g (0.63)
π-π*
2.79 444
(1)3A
g 4au→ 5au (0.64)
π-π*
2.93 424 (1)3B
2g
37ag→ 7b2g (0.70) n-π*
2.79 443
(1)3B
2g 37ag→ 7b2g (0.70) n-π*
2.95 420 (1)3A
g
4au→ 5au (0.63) 6b2g→ 7b2g (0.22)
π-π*
2.90 427
50 nm smaller than the experimental data, while with DMSO this difference is reduced to approximately 20 nm. In Table 4, it is also tabulated the calculated transition dipole moment (µ12), Einstein coefficient of spontaneous emission (A21) and radiative lifetime (τrad). The experimental
data related to ZnPc fluorescence natural lifetime (τrad), in DMSO, reported by Zhang and Xu,48 presents a value
slightly higher (4.73 ns) than the value predicted by us from data obtained from TD-DFT calculations (0.699 ns).
Phosphorescence
An efficient intersystem crossing (ISC) usually occurs if there is a small energy difference between S1 and the
adjacent triplet state or a significant spin-orbit coupling between these states.49 According to El-Sayed rules,50 the
coupling is in general favored if these states are of different natures. Thus, despite being a spin-forbidden transition,49
the ISC involving π,π* and n,π* states usually tends to be strongly favored. In principle, the data presented in Table 3 does not indicate a favorable intersystem crossing between S1 and the adjacent triplet state, in apparent
contradiction to the ZnPc photophysical behavior given by the expressive triplet (ΦT = 0.65) and singlet oxygen
(Φ∆ = 0.67) quantum yields in DMSO.16 This should occur
mainly due to the spin-orbit coupling induced by Zn2+ at the
center of the macrocycle.16 The experimentally evidenced
weak p,p* transition with a partial contribution of n,p* transition,24,27,47 near the Q band, in combination with the
spin-orbit coupling, also should favor the intersystem crossing, resulting in the population of T1 with a good
probability. The π,π* nature of T2 and T1 warrants a fast
internal conversion between these states and a long-lived T1 state, capable to favor the efficient sensitization of
molecular oxygen to singlet oxygen by energy transfer (Φ∆= 0.67 in DMSO).16
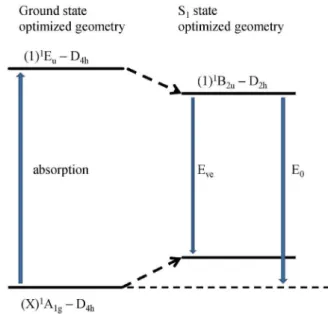
The lowest triplet state ((1)3B
2u – D2h symmetry)
was optimized with the use of two methods, for both gas phase and in DMSO as solvent. The first employed B3LYP/6-31G(d) in an TD-DFT unrestricted approach, and the other using B3LYP/6-311+G(d,p), both using as starting point the S1 optimized geometry. Some data of the
optimized geometries are presented in Table 2. For both structures, state energy calculations, employing a TD-DFT approach and using the combination B3LYP/6-311+G(d,p), were done aiming to estimate the energy associated to the phosphorescence. The transition energies related to the phosphorescence from (1)3B
2u to S0 are presented in Table 5.
The emission occurs from 7b2g to 4au, being both π orbitals.
E0 is related with the fraction of highest energy in
phosphorescence spectrum, and corresponds to the experimental phosphorescence while Eve is related to the
vertical emission, associated to the part of lowest energy in the emission spectrum. The optimization of the triplet state with B3LYP/6-311+G(d,p) was followed by TD-DFT,
Figure 4. Scheme of absorption and emission related to fluorescence
process. Eve is the vertical emission and E0 is the band origin.
Table 4. Fluorescence parameters of ZnPc molecule with and without solvent (IEFPCM/DMSO), obtained with TD-DFT/B3LYP/6-311+G(d,p) methodology. The calculations were carried out using the lowest energy singlet S1 state optimized geometrya
State Eve g / eV E0 h / eV
E / eV
experimental 〈Ψ1|µ|Y2〉 / a.u. A21 / s-1 τrad / ns
Singlet statesa
(1)1B
2u 1.97 (628 nm) 2.03 (612 nm) 1.82 (683nm)b 3.0528 1.0463 × 10⁹ 0.956
Singlet states PCM/DMSOa
(1)1B
2u 1.87 (662 nm) 1.93 (644 nm) 1.82 (682 nm)c
1.83 (678 nm)d
1.83 (679 nm)e
1.82 (682 nm)f
3.7609 1.4309 × 10⁹ 0.699
aOptimized with TDDFT/B3LYP/6-31G(d); breference 1; creference 28; dreference 15; ereference 14; freference 48; gE
with the difference between E0 and Eve equal to 0.15 eV
both in gas phase and in DMSO. The E0 phosphorescence
data in gas phase (1.02 eV) is about 0.10 eV smaller than the experimental data. The T1 energy determined from the
phosphorescence spectra in chloronaphthalene glass upon excitation in the Q band ranges between 1.13 and 1.14 eV.1
Vincett et al.51 found a similar value 1.13 eV (1095 nm).
About the theoretical value, Nguyen et al.52 calculated
employing a TD-DFT approach in the gas phase, finding 1.12 eV in a study involving organic and organometallic dyes, a value close to experimental data. They observed that TD-DFT calculations systematically underestimate the energies for a number of molecules by about 0.1 eV, similar to our data. The inclusion of solvent effects did not change the emission energy, indicating a minimal dependence with the surrounding environment. The optimization of the triplet state with TD-DFT/B3LYP/6-31G(d) starting from S1 optimized geometry lead to phosphorescence energies
exactly 0.04 eV smaller than the values described above.
Conclusions
An accurate description of absorption, fluorescence and phosphorescence spectra was provided using the time dependent approach of density functional theory (TD-DFT), using the B3LYP functional and the 6-311+G(d,p) basis set. All properties were obtained in gas phase and in solvated media (DMSO), with the use of the IEFPCM model. For the absorption spectra, the transitions from
((X)1A
1g) ground state to the lowest Eu and A2u states are
assigned to the Q peak and B (Soret) band, associated to B1, B2 and N peaks. All transitions to Eu states relates to π-π* transitions, while the lowest A2u is related to n-π*
one. To study fluorescence process the first excited state (S1) was optimized, with the symmetry changing from
D4h to D2h. This excited state allowed the calculation of
the Einstein coefficient (A21), radiative lifetime (τrad) and fluorescence emission energy. A Stokes shift of 30 nm and a radiative lifetime of 0.699 ns, both in DMSO, present a small difference compared to experimental data. The main question related to phosphorescence is the efficiency of intersystem crossing (ISC). The orbital symmetry of S1 and
the adjacent triplet state do not suggests a favorable ISC. However, the spin-orbit coupling induced by the Zn2+ and
the contribution of the n,π* transition close to Q peak should be responsible for the triplet and singlet oxygen quantum yields experimentally estimated in DMSO. The phosphorescence energy in gas phase (1.02 eV) is close to experimental data. The emission energies of fluorescence and phosphorescence did not change with the inclusion of DMSO, indicating a small influence of environment.
Acknowledgements
The authors are grateful to Fundação de Amparo à Pesquisa do estado de Minas Gerais (FAPEMIG), Conselho Nacional de Desenvolvimento Científico e
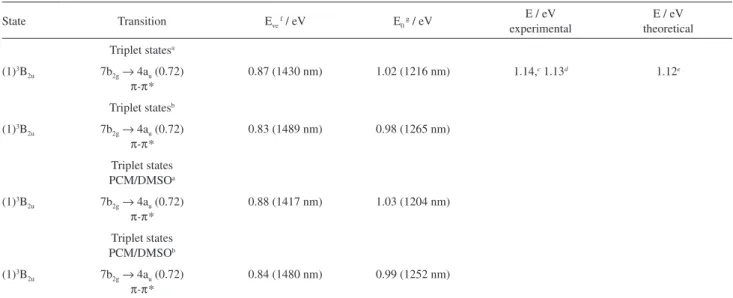
Table 5. Energies of the lowest triplet state of ZnPc molecule with and without solvent (IEFPCM/DMSO), obtained with TD-DFT/B3LYP/6-311+G(d,p) methodology. The values in parenthesis are the largest coefficients in the CI expansion of the most important transitions. The calculations were carried out using the lowest energy triplet state optimized geometrya,b
State Transition Eve f / eV E0 g / eV
E / eV experimental
E / eV theoretical
Triplet statesa
(1)3B
2u 7b2g→ 4au (0.72)
π-π*
0.87 (1430 nm) 1.02 (1216 nm) 1.14,c 1.13d 1.12e
Triplet statesb
(1)3B
2u 7b2g→ 4au (0.72)
π-π*
0.83 (1489 nm) 0.98 (1265 nm)
Triplet states PCM/DMSOa
(1)3B
2u 7b2g→ 4au (0.72)
π-π*
0.88 (1417 nm) 1.03 (1204 nm)
Triplet states PCM/DMSOb
(1)3B
2u 7b2g→ 4au (0.72)
π-π*
0.84 (1480 nm) 0.99 (1252 nm)
aOptimized with B3LYP/6-311+G(d,p); boptimized with TDDFT/B3LYP/6-31G(d); creference 1; dsolvent: 1-chloronapthalene (77 K);51eB3LYP/6-31G(d);52 fE
Tecnológico (CNPq), Coordenação de Aperfeiçoamento de Pessoal de Nível Superior (CAPES) and Financiadora de Estudos e Projetos (FINEP) for research grants and financial support.
References
1. Stillman, M.J.; Nyokong, T. In Phthalocyanines: Properties and Applications, Leznoff, C. C.; Lever, A. B. P., eds.; VCH Publishers: New York, USA, 1990- 1996, vol. 1, ch. 3. 2. Banfi, S.; Caruso, E.; Buccafurni, L.; Ravizza, R.; Gariboldi, M.;
Monti, E.; J. Organomet. Chem.2007, 692, 1269.
3. Andzelm, J.; Rawlett, A. M.; Orlicki, J. A.; Snyder, J. F.; Baldridge, K. K.; J. Chem. Theory Comput.2007, 3, 870.
4. Taffa, D. H.; Kathiresan, M.; Amold, T.; Walder, L.; Erbacher, M.; Bauer, D.; Montforts, F.-P.; Nordmann, J.; Haase, M.; J. Photochem. Photobiol., A2010, 216, 35.
5. Kushto, G. P.; Mäkinen, A. J.; Lane, P. A.; IEEE J. Sel. Top. Quantum Electron.2010, 16, 1552.
6. Herrero, C.; Quaranta, A.; Leibl, W.; Rutherford, A. W.; Aukauloo, A.; Energy Environ. Sci.2011, 4, 2353.
7. Sadaoka, Y.; Jones, T. A.; Göpel, W.; Sens. Actuators, B1990,
1, 148.
8. Kuder, J. E.; J. Imaging Sci.1988, 32, 51.
9. Schlettwein, D.; Wöhrle, D.; Jaeger, N. I.; J. Electrochem. Soc.
1989, 136, 2882.
10. Gouterman, M.; Wagnière, G. H.; Snyder, L. C.; J. Mol. Spectrosc.1963, 11, 108.
11. Schaffer, A. M.; Gouterman, M.; Weiss, C.; Theor. Chim. Acta
1973, 30, 9.
12. Roeder, B. In Photodynamic Tumor Therapy; Moser, J. G., ed.; Harwood Academic Publishers: Australia, 1998, ch. 1. 13. Chan, W.-S.; Zuk, M.; Ben-Hur E. In Photodynamic Tumor
Therapy; Moser, J. G., ed.; Harwood Academic Publishers: Australia, 1998, ch. 2.
14. Ogunsipe, A.; Maree, D.; Nyokong, T.; J. Mol. Struct.2003,
650, 131.
15. Wróbel, D.; Boguta, A.; J. Photochem. Photobiol., A: Chem.
2002, 150, 67.
16. Chidawanyika, W.; Ogunsipe, A.; Nyokong, T.; New J. Chem.
2007, 31, 377.
17. Linstead, R. P.; Rowe, G. A.; J. Chem. Soc.1940, 1070.
18. Barrett, P. A.; Linstead, R. P.; Leavitt, J. J.; Rowe, G. A.; J. Chem. Soc.1940, 1076.
19. Barrett, P. A.; Linstead, R. P.; Rundall, F. G.; Tuey, G. A. P.; J. Chem. Soc.1940, 1079.
20. Edwards, L.; Gouterman, M.; J. Mol. Spectrosc.1970, 33, 292. 21. Edwards, L.; Gouterman, M.; Rose, C. B.; J. Am. Chem. Soc.
1976, 98, 7638.
22. Edwards, L.; Dolphin, D. H.; Gouterman, M.; J. Mol. Spectrosc.
1970, 35, 90.
23. Metcalf, D. H.; VanCott, T. C.; Snyder, S. W.; Schatz, P. N.; Williamson, B. E.; J. Phys. Chem. 1990, 94, 2828.
24. VanCott, T. C.; Rose, J. L.; Misener, G. C.; Williamson, B. E.; Schrimpf, A. E.; Boyle, M. E.; Schatz, P. N.; J. Phys. Chem.
1989, 93, 2999.
25. Plows, F. L.; Jones, A. C.; J. Mol. Spectrosc.1999, 194,
163.
26. Nyokong, T.; Gasyna, Z.; Stillman, M.; J. Inorg. Chem. 1987,
26, 1087.
27. Mack, J.; Stillman, M. J.; J. Phys. Chem. 1995, 99, 7935.
28. Gürol, I.; Durmus¸ M.; Ahsen, V.; Nyokong, T.; Dalton Trans.
2007, 3782.
29. Schechtman, B. H.; Spicer, W. E.; J. Mol. Spectrosc. 1970, 33, 28.
30. Seoudi, R.; El-Bahy, G. S.; El Sayed, Z. A.; Opt. Mater.2006, 29, 304.
31. Kuwabara, T.; Teraguchi, M.; Kaneko, T.; Aoki, T.; Yagi, M.; J. Phys. Chem. B 2005, 109, 21202.
32. Mack, J.; Stillman, M. J.; Inorg. Chem.2001, 40, 812. 33. Mack, J.; Stillman, M. J.; J. Am. Chem. Soc. 1994, 116,
1292.
34. Mack, J.; Stillman, M. J.; Coord. Chem. Rev.2001, 999, 219.
35. Kobayashi, N.; Mack, J.; Ishii, K.; Stillman, M. J.; Inorg. Chem.
2002, 41, 5350.
36. Yuan, S. F.; Chen, Z. R.; J. Phys. Chem. A2005, 109, 2582. 37. Liao, M.-S.; Watts, J. D.; Huang, M.-J.; Gorun, S. M.; Kar, T.;
Scheiner, S.; J. Chem. Theory Comput. 2005, 1,1201. 38. Liao, M.-S.; Scheiner, S.; J. Chem. Phys.2001, 114, 9780.
39. Nguyen, K. A.; Pachter, R.; J. Chem. Phys.2001, 114, 10757. 40. Ricciardi, G.; Rosa, A.; Baerends, E. J.; J. Phys. Chem. A 2001,
105, 5242.
41. Nguyen, K. A.; Pachter, R.; J. Chem. Phys.2003, 118, 5802.
42. Baerends, E. J.; Ricciardi, G.; Rosa, A.; van Gisbergen, S. J. A.; Coord. Chem. Rev.2002, 230, 5.
43. Furche, F.; Ahlrichs, R.; J. Chem. Phys.2002, 117, 7433. 44. Cossi, M.; Barone, V.; Cammi, R.; Tomasi, J.; Chem. Phys. Lett.
1996, 255, 327.
Morokuma, K.; Zakrzewski, V. G.; Voth, G. A.; Salvador, P.; Dannenberg, J. J.; Dapprich, S.; Daniels, A. D.; Farkas, Ö.; Foresman, J. B.; Ortiz, J. V.; Cioslowski, J.; Fox, D. J.; Gaussian 09, Revision B.01; Gaussian, Inc.: Wallingford, CT, USA, 2010.
46. Ueno, L. T.; Machado, A. E. H.; Machado, F. B. C.; J. Mol. Struct. THEOCHEM2009, 899, 71.
47. Huang, T. H.; Rieckhoff, K. E.; Voight, E. M.; J. Phys. Chem.
1981, 85, 3322.
48. Zhang, X.-F.; Xu, H.-J.; J. Chem. Soc., Faraday Trans.1993,
89, 3347.
49. Turro, N. J.; Ramamurthy, V.; Scaiano, J. C.; Modern Molecular Photochemistry of Organic Molecules; University Science Books: Sausalito, CA, USA, 2010.
50. El-Sayed, M. A.; Acc. Chem. Res. 1968, 1, 8.
51. Vincett, P. S.; Voigt, E. M.; Rieckhoff, K. E.; J. Chem. Phys.
1971, 55, 4131.
52. Nguyen, K. A.; Kennel, J.; Pachter, R.; J. Chem. Phys.2002, 117, 7128.