Article
Printed in Brazil - ©2012 Sociedade Brasileira de Química0103 - 5053 $6.00+0.00
A
*e-mail: [email protected]
#Manuela M. Mincea and Beatrice A. Vlad-Oros are temporally affiliated to
Alexandru Ioan Cuza University, Romania.
Adapting the Reducing Sugars Method with Dinitrosalicylic Acid to Microtiter
Plates and Microwave Heating
Anamaria Negrulescu,a,b Viorica Patrulea,a,b Manuela M. Mincea,#,a,b Cosmin Ionascu,a,b
Beatrice A. Vlad-Oros#,a,b and Vasile Ostafe*,a,b
aDepartment of Chemistry, West University of Timisoara, Pestalozzi 16, 300115 Timisoara, Romania
bMultidisciplinary Research Platform “Nicholas Georgescu - Roengen”, Advanced Environmental
Research Laboratories, West University of Timisoara, Oituz 4, 300086 Timisoara, Romania
Um método estável, confiável, eficiente com relação a tempo e custo para detecção de açúcares redutores, baseado no método colorimétrico do ácido dinitrossalicílico (DNS), adaptado para placas de microtitulação em um banho de água modificado com tratamento de microondas é proposto. Além da influência benéfica sobre o meio ambiente devido à redução do volume dos reagentes utilizados, o método modificado é rápido e permite a análise de um número relativamente alto de amostras. Pode ser aplicado em diversos tipos de laboratórios, de processamento de alimentos à indústrias farmacêuticas. O método adaptado foi parcialmente validado (intervalo de linearidade entre 7 µg e 5 mg per poço; limite de detecção 3 µg per poço, desvio padrão em torno de 5% para curvas de calibração com glucose, e recuperação superior a 90%) e aplicado à séries de produtos contendo açúcares redutores, como amostras de mel e vinho e medicamentos que contêm lactose como excipiente. O método proposto é bem adaptado como uma técnica de alto rendimento para determinação de açúcares redutores, pois todas amostras analisadas deram resultados esperados de acordo com as suas notas técnicas.
A sound, reliable, time- and cost-efficient method for detection of reducing sugars, based on the well known dinitrosalicylic acid (DNS) colorimetric method, adapted for microtiter plates, in a modified water bath with microwave treatment is proposed. Besides the benefic influence on the environment due to the reduction of the volume of the reagents, the modified method is rapid and allows the analysis of a relatively high number of samples. It can be applied in many types of laboratories from food processing to pharmaceutical industries. The adapted method was partially validated (linearity range between 7 µg and 5 mg per well; limit of detection 3 µg per well, standard deviation around 5% for calibration curves with glucose, and a recovery higher than 90%) and applied to a series of products containing reducing sugars, such as honey, wine samples and drugs containing lactose as an excipient. The proposed method is well-suited as a high-throughput technique for determination of reducing sugars as all the analyzed samples gave the expected results according with their technical notes.
Keywords:dinitrosalicylic acid (DNS), microtiter plate assay, microwave supported reaction, reducing sugars
Introduction
Monosaccharides, most of oligosaccharides, glucose polymers, such as starch and cellulose, and copolymers, like chitin, contain reducing ends. The measurements of the concentration of reducing ends can give valuable
information about the analyzed sample.1 Especially due to
for some specific products, like honey, which should contain no less than 60 g of reducing sugar per 100 g and wine, which is classified depending on the RS concentration as dry (less than 5 g L−1), semidry (5-15 g L−1), semisweet
(15-25 g L−1) and sweet (25-125 g L−1).2,3 Nevertheless, to
have a complete view of the wine industry and control of the resulting product it is advisable to assay the RS content at any point from grape ripening to bottling, in order to avoid incidents such as re-fermentation which would decrease the quality of the wine.4 A study on different Spanish
types of honey revealed whether the honey was eligible for commercialization as a consequence of quality control tests amongst which a test for RS was included.5
One of the primary contemporaneous concerns regarding RS is their presence as excipients in many drugs, where their free carbonyl group can react with any active substance which contains a primary or a secondary amine, resulting initially in a Schiff base and afterwards in impurities which, thus, reduce the efficiency of the drug. This phenomenon is called a Maillard reaction6 and
is especially exhibited in the case of lactose, when used in the composition of some medicines such as acetylsalicylic acid,7 metoclopramide hydrochloride,8 propranolol
hydrochloride9 and many others.
Furthermore, literature abounds of studies regarding the assay of RS, from arabic gum used as binding media for watercolors,10 to evaluation of biological parameters,
such as the amount of plasma glycosaminoglycans, which are responsible for degeneration of articular cartilage and vascular diseases,11 to the generation of RS in sweet potatoes
within a specific range of temperatures under infrared and microwave heating conditions,12 to the evaluation
of the quality of apple13 and papaya preservation14 after
undergoing freezing and osmotic dehydration, to the analysis of a mollusk protection behavior15 and so on.
RS are the end products of many biological processes and enzymatic reactions. Many polysaccharide-degrading enzymes are commonly assayed by quantifying the amount of RS released during the analysis.16
Most analytical methods used for determining RS involve colorimetric detection based on the oxidation of the carbonyl groups and then the reaction with a UV-Vis absorbing molecule.1 Several colorimetric
methods among which phenol-sulfuric acid,17
anthrone-sulfuric acid, 3,5-dinitrosalicylic acid (DNS), potassium ferric hexacyanide reagent (Prussian blue), and the Nelson-Somogyi (molybdenum blue) methods were used for the assay of sugars extracted from soils and of soil enzymes, including the ones with cellulase activity.18 One
example of a colorimetric method that is widely used to determine the total concentration of carbohydrates
present in foods is the use of phenol-sulfuric acid method in a study of optimization of process parameters for ethanol production from sugarcane molasses by
Zymomonas mobilis.19 For determining the concentration
of reducing ends of sugars, resulted as an effect of the sulfuric acid on all non-reducing ends, a method was presented, based on the use of Fe(CN)63−, as the oxidant
in combination with amperometric detection and flow injection analysis (FIA). Such amperometric methods were used to determine RS in honey and marmalades by adding the Stanley-Benedict reagent and unreacted Cu(II) was assayed with a Cu-selective electrode,20 or the amount
of lactose in milk by means of a reaction between lactose and methylamine.21
RS can be investigated by the DNS method employing glucose as the standard. DNS reacts with free carbonyl group of the RS under alkaline condition, forming 3-amino-5-nitrosalicylic acid, an aromatic compound with maximum absorption at 540 nm, allowing a quantitative spectrophotometer measurement of the amount of RS present.22 Using this method the concentrations of RS,
obtained by the pretreatment of native cellulose with 1-n-butyl-3-methylimidazolium chloride for solid acid-catalyzed hydrolysis, were determined.23 The degree of
hydrolysis of starch by enzymatic hydrolysis was calculated as relative percent of RS formed in enzymatic hydrolysis compared to acid hydrolysis.24
Many of these methods are demanding in terms of the chemicals consumed, requiring high volumes of samples, involve several steps and, thus, much manual work, being labor-intensive and time-consuming. Many colorimetric assays have been modified for testing in microtiter plates in order to allow the automation of the assay. The microassay systems facilitate rapid screening of a large number of samples and substantially reduce labor, time and reagents. Adaptation of the Nelson-Somogyi RS assay to a rapid microassay using microtiter plates allowed a considerable volume reduction of the reagents and a rapid analysis of a large number of samples, being used with good results for the measurement of RS from fermentation samples even in complex media, like olive mill wastewaters22 and
determining polysaccharide-degrading enzyme activities such as xylanase, laminarinase, carboxymethylcellulase, from the brown-rot fungus Postia placenta.16 A method
using ELISA plates was developed for determination of RS concentration by the chromogen 2,2-bicinchoninic acid method. The comparison of the Nelson-Somogyi method with 2,2-bicinchoninic acid method indicated that the latter is more rapid and requires fewer reagents for serial analyses.25
version of the method performed in test tubes. The problems related with the heating of the microtiter plate for the acceleration of the chemical reaction was solved by using special heat resistant plates which were heated in an oven.22
In the present work an improved DNS assay is presented, based on a combination of the previous methods derived from the classical test tube technique. This method used normal microtiter plates instead of the more expensive thermal-resistant plates adding the benefit of the high throughput technique to the classical method. The heating step drawback was solved by using a modified water bath in an ordinary microwave oven, making the overall assay cost-efficient for current practice.
This novel method was used for the examination of the total RS content in various types of honey and white wines, as well as for the assay of lactose in three pharmaceutical products, metoclopramid, diclofenac and saprosan.
Experimental
Samples and reagents
Honey samples (lime and multifloral from SC Euro Apicola SRL, south-east part of Romania, multi-floral Kaufland from Poland, and multi-floral from two beekeeper farmers from western part of Romania) and wines (brand name: “Gewurztraminer” semidry and “Fetească albă” dry, from SC Jidvei SRL, Romania and “Tămâioasă Românească”, sweet, from Cramele Halewood - Prahova Valley SA, România) were purchased from Romanian local market, while drugs (metoclopramid - active substance methoclopramide hydrochloride, diclofenac - active substance 2-(2,6-dichloranilino) phenylacetic acid, and saprosan - active substance dichlor-8-quinaldinol) where purchased from a local drug store. Standard glucose and potassium disulphide have been purchased from Merck (Germany). Phenol, 3,5-dinitrosalicylic acid and sodium hydroxide were bought from Sigma Aldrich Chemie GmbH (Germany). Rochelle salt (potassium sodium tartrate) was acquired from Fluka (Switzerland). All chemicals were analytical-reagent grade. Water was purified using an ultrapure water-purification system (Ultra Clear Basic from SG Wasseraufbereitung und Regenerierstation GmbH, Barsbüttel, Germany).
The dinitrosalicylic reagent was based on the method developed by Miller26 and it contained a 1:1:1:1 volumetric
mixture of 3,5-dinitrosalicylic acid 1%, Rochelle salt 40%, phenol 0.2%, potassium disulphide 0.5%, all in sodium hydroxide 1.5%. Typically, to 100 µL sample mixture 100 µL DNS reagent were added. The microtiter plates were heated in the water bath mounted in the common
microwave oven (Galanz WD900ESL30R, Foshan, China, 1800 MHz) for 4 min, cooled to room temperature on an ice bath and the optical density of the samples was measured at 540 nm using Sunrise microtiter plate absorbance reader (Tecan GmbH 6082, Grodig, Austria).
Sample preparations
For the experiments three types of samples were investigated. Five brands of honey available in the market were procured and marked as samples H1 to H5 sequentially(H1 - lime honey from SC Euro Apicola SRL; H2 - floral from SC Euro Apicola SRL, H3 - multi-floral from Poland, H4 - multi-multi-floral from a beekeeper from Hunedoara county, H5 - multi-floral from a beekeeper from Timiş county). All the honey samples were stored at 4 °C and their manufacturing date was under 2 months while performing the experiments. According to manufacturers’ details, all the honey types were considered multi-floral.
To determine the reducing ends content of sugars from honey, each honey sample, before analysis, was kept at room temperature for 2 h. Glucose was used as a standard to produce the calibration curve.
Three commercial white wines made out of grapes, marked as samples W1 to W3 sequentially, “Gewurztraminer” semidry, “Fetească albă” dry, and “Tămâioasă Românească” sweet, respectively, were procured from the local wine shop and were used shortly after the opening of the bottles. These are popular brands of wine and are readily available in Romania. The wines analyzed were used undiluted.
The tablets (marked as samples T1 to T3 sequentially) of metoclopramid, diclofenac and saprosan, respectively, were weighed and grounded in a mortar, the powder equivalent to one tablet was accurately weighed and a dilution with water was performed (ratio 1:10), followed by ultrasonication at 50 kHz, 240 W for 5 min (Aqua Wave 9375 ultrasonic bath from Barnstead International, Dubuque, Iowa, USA) and centrifuged for 10 min at 5000 rpm (Hettich Zentrifugen model Mikro 22 R, Andreas Hettich GmbH & Co, KG, Tuttlingen, Germany). All solutions were filtered through 0.2 µm membrane filters (Chromafil A-20/25, Macherey-Nagel GmbH & Co, KG, Düren, Germany) prior to the analysis.
Development of the microtiter plates method
10 µg mL−1 to 100 mg mL−1 concentration of glucose. DNS
reagent (100 µL) was added to each sample, mixed well and subsequently the microtiter plates were kept for 4 min in an ordinary microwave oven, in a water bath modified to fit in the oven. Finally, the samples were cooled and absorbance, in terms of optical density of the standard and the samples, was recorded on a Sunrise microtiter plate absorbance reader at 540 nm. DNS reagent and, for some experiments, water (as dilution reagent) were added with 8 channels micropipette allowing a reduction of the labor time. Using appropriate combination of 1, 8 and 12 channels pipettes one can analyze around 40 samples per one microtiter plate in 10 min labor time, which makes this technique a high throughput method.
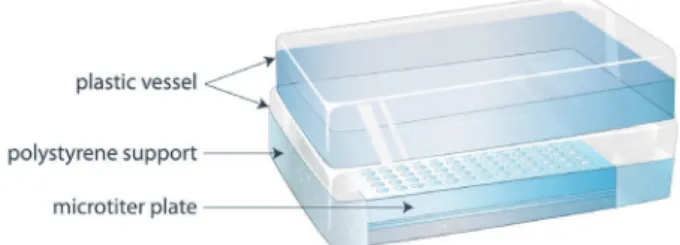
The system consists of a plastic vessel filled with water, as thermal buffer, containing the microtiter plate placed in a polystyrene support. To avoid evaporation of the small quantities of solutions to be assayed, the water bath containing the microtiter plate was covered with another plastic vessel with water, having the role of dispersing the microwave energy to this water mass. Consequently, the thermal energy was distributed equally to all the wells of the plate. As this water bath was rotating during the microwave irradiation, the side-effect (unequal microwave exposure of the center and the side of the plate) was reduced to an adequate level (Figure 1).
Results and Discussion
Assay validation
A partial validation of the adapted method was performed by the analysis of the following parameters: linearity, limit of detection (LOD), limit of quantification (LOQ), precision and accuracy.
Linearity is the ability of an analytical method to produce results that are directly proportional to the concentration of the analyte present in the samples, in a known range of concentrations.22 It was defined through
the relation between glucose concentration and absorbance measured at an optical density of 540 nm. The correlation
coefficient (R) was calculated by the least squares method. This parameter is frequently used to indicate the adequacy of the curve to the mathematical model. Determination of RS from honey, drugs, and wines was accomplished using an external standard calibration. The calibration curves obtained from the relation between glucose concentration and the absorbance values, measured at 540 nm, were all linear (with 95% confidence level) for the concentration range of 50-0.05 mg mL−1. The linearity of the calibration
curves was measured by triplicate of standards at seven different concentration levels.
The limit of detection (LOD) is the lowest concentration of analyte that can be distinguished from zero.22 The LOD
was 3 µg per well and the limit of quantification (LOQ) is 7 µg per well, where the LOQ refers to the smallest concentration or the mass which can be quantitatively analyzed with reasonable reliability by a given procedure.27
The upper limit is the largest possible quantity that can be quantified with the method. The upper limit is 5 mg per well (in order to maintain the value of R above 0.995). Over 5 mg per well the signal did not increase linearly.
The calibration curves were very similar among themselves, with a standard deviation of 0.6 and 0.003 for the slope and y-intercept, respectively (Table 1). The good values acquired for the calculated R suggest a strong linear relationship between the two variables and an excellent representation of the data by the regression equations of the curves obtained.
The method was validated for precision expressed as repeatability of the analysis. Repeatability is the closeness of agreement between mutually independent test results obtained with the same method, on identical test material, in the same laboratory, by the same operator using the same equipment within short intervals of time.28 It is usually
specified in terms of relative standard deviation (RSD). Intra-day (n = 6) RSD was 4.3% and inter-day (n = 6) RSD was 5.4%.
The precision of the method was analyzed in terms of repeatability by the Horwitz criterion.29 According to
this criterion, to consider RSD acceptable in terms of precision, the RSD experimental values should be lower than the RSD values calculated by the Horwitz formula RSD (%) = 2(1 − 0.5 logC), where C is the concentration
expressed as powers of ten. Based on the Horwitz formula the theoretical RSD was 8.9%. The inter-day dispersion was approximately 5.4%, which means the used methods can be considered precise and can be used securely for determination of reduced sugars in various samples.
Accuracy is the closeness of the test results obtained by the analytical method to the true value.30 Recovery was
determined by addition of analyte standards (glucose) to the Figure 1. Representation of the microtiter plate water bath used for the
real samples before starting the extraction procedure. Three honey samples of products were spiked with reference standard solutions of glucose (3, 5 and 7 mg glucose added to each 100 mg honey used for preparing the samples). These samples were treated as described in the sample preparation procedure. The data obtained were compared with the theoretical concentrations. Under these conditions, the accuracy was expressed as percentage recovery. The results showed recovery ranged from 91.4 to 105.8% for the analyte in all samples (mediation between 6 experiments performed in 6 different days). The RSD of the set results were determined. Table 2 presents an example of recovery experiment.
Application of the method
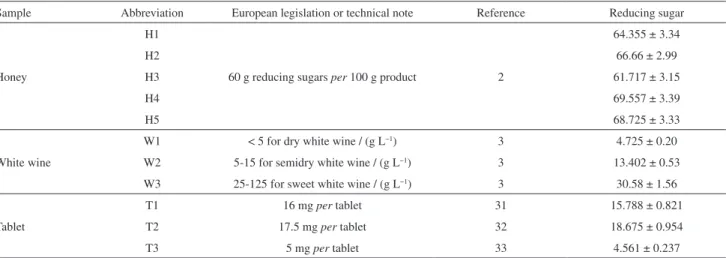
The developed method was used for the quantification of RS in various types of products, such as honey, drugs and wines (Table 3).
All honey samples had adequate RS concentrations and were within the limits set by the European Community. Moreover, the analysis of wine samples proved that they contained the right amount of RS according to the category they were classified in: dry (4.725 ± 0.20 g L−1), semidry
(13.402 ± 0.53 g L−1) and sweet (30.58 ± 1.56 g L−1). As
for the drugs, the active substances from Metoclopramid and Diclofenac, which are primary or secondary amines, react with lactose, one of the excipients, through a Maillard reaction and produce an impurity, lowering the effect of the drugs. The assay for lactose lead to the initial alleged quantities suggested by the producer companies, but, nevertheless it is advisable to replace lactose with other excipients in order to avoid the formation of undesired impurities.
Conclusions
A sound, simple and quick analytical DNS method has been developed and applied in routine determination of Table 1. Standard calibration curves in different days for inter-day
precision calculation
Day Calibration curve R
1 y = (11.409 ± 0.456)x + (−0.031 ± 0.0012) 0.997
2 y = (11.358 ± 0.545)x + (−0.061 ± 0.0029) 0.996
3 y = (11.454 ± 0.584)x + (−0.021 ± 0.0011) 0.994
4 y = (11.459 ± 0.447)x + (−0.02 ± 0.0008) 0.996
5 y = (11.357 ± 0.477)x + (−0.042 ± 0.0018) 0.996
6 y = (11.445 ± 0.561)x + (−0.055 ± 0.027) 0.995
Table 3. Quantification of reducing sugars from various products
Sample Abbreviation European legislation or technical note Reference Reducing sugar
Honey
H1
60 g reducing sugars per 100 g product 2
64.355 ± 3.34
H2 66.66 ± 2.99
H3 61.717 ± 3.15
H4 69.557 ± 3.39
H5 68.725 ± 3.33
White wine
W1 < 5 for dry white wine / (g L−1) 3 4.725 ± 0.20
W2 5-15 for semidry white wine / (g L−1) 3 13.402 ± 0.53
W3 25-125 for sweet white wine / (g L−1) 3 30.58 ± 1.56
Tablet
T1 16 mg per tablet 31 15.788 ± 0.821
T2 17.5 mg per tablet 32 18.675 ± 0.954
T3 5 mg per tablet 33 4.561 ± 0.237
Table 2. The recovery of spiked glucose in honey samplesa
Honey samples Glucose / mg per 100 mg honey Recovery / % Glucose measured / mg per 100 mg honey
Un-spiked 0 − 64.353 ± 2.703
3 100.843 ± 3.247 67.921 ± 3.192
Spiked 5 99.655 ± 3.381 69.114 ± 3.387
7 98.962 ± 3.936 70.612 ± 3.036
reducing sugars using microtiter plates. The investigated parameters (linearity, limit of detection, limit of quantification, precision and accuracy) confirm that this method is adequate, reliable and suitable for the study of RS in food, beverage and drug samples.
The time-efficiency of this method refers both to the reaction time, which was 4 min, and to the overall time of the analysis that has significantly diminished. This reduction is mainly due to the fact that the reaction occurs directly on the location where the absorbance will be read, avoiding the time-consuming step of transferring the reaction mixture of each sample to every single test tube. Furthermore, working on microtiter plates, the volume of the reagents is reduced significantly contributing to the cost-efficiency of this method.
In the present work, the developed DNS method was successfully used to determine the RS concentration for five honey samples, three wine samples and the lactose concentration in three drugs, metoclopramid, diclofenac and saprosan. The developed method is accurate, reduces both assay time and volume of reagents, decreasing the global cost of the assay, allowing the analysis of several samples at once, reason for which the method can be considered a high-throughput technique.
Acknowledgments
The authors Mincea, M. M. and Vlad-Oros, B.A. acknowledge the financial support from strategic grant POSDRU/89/1.5/S/63663, Project “Transnational Network of Integrated Management for Postdoctoral Research in the Field of Science Communication. Institutional Construction (Post-Doctoral School) and Fellowship Program (CommScie)” financed under the Sectorial Operational Programme Human Resources Development 2007-2013.
References
1. Melander, C.; Andersson, E.; Axelsson, S.; Gorton, L.; Anal. Bioanal. Chem. 2007, 387, 2585.
2. European Community; Official J. Europ. Commun., Directive 2001/110/EC, http://eur-lex.europa.eu/LexUriServ/LexUriServ. do?uri=OJ:L:2002:010:0047:0052:EN:PDF accessed on July 2, 2012.
3. European Community; Official J. Europ. Commun., Directive 1990/2676/EC, http://eur-lex.europa.eu/LexUriServ/ LexUriServ.do?uri=OJ:L:1990:272:0001:0192:EN:PDF accessed on July 3, 2012.
4. Fernández-Novales, J.; Lopez, M. I.; Sanchez, M. T.; Morales, J.; Gonzalez-Caballero, V.; Food Res. Int. 2009, 42, 285.
5. Nozal Nalda, M. J.; Bernal Yague, J. L.; Diego Calva, J. C.; Martin Gomez, M. T.; Anal. Bioanal. Chem. 2005, 382, 311. 6. Huidobro, A. L.; Barbas, C.; Anal. Bioanal. Chem. 2009, 394,
1349.
7. Carstensen, J. T.; Attarchi, F.; J. Pharm. Sci. 1988, 77, 318. 8. Qiu, Z.; Stowell, J. G.; Cao, W.; Morris, K. R.; Byrn, S. R.;
Carvajal, M. T.; J. Pharm. Sci. 2005, 94, 2568.
9. Macedo, R. O.; Gomes do Nascimento, T.; Veras, J. W. E.; J. Therm. Anal. Cal. 2002, 67, 483.
10. Riedo, C.; Scalarone, D.; Chiantore, O.; Anal. Bioanal. Chem. 2010, 396, 1559.
11. Zinellu, A.; Sotgia, S.; Usai, M. F.; Zinellu, E.; Lepedda, A. J.; Deiana, L.; Formato, M.; Carru, C.; Anal. Bioanal. Chem. 2008, 391, 2865.
12. Sawai, J.; Nakai, T.; Shimizu, M.; Food Sci. Technol. Int. 2009, 15, 89.
13. Bunger, A.; Moyano, P. C.; Vega, R. E.; Guerrero, P.; Osorio, F.; Food Sci. Technol. Int. 2004, 10, 163.
14. Moyano, P. C.; Vega, R. E.; Bunger, A.; Garretón, J.; Osorio, F. A.; Food Sci. Technol. Int. 2002, 8, 295.
15. Karanova, M. V.; Biol. Bull. 2006, 33, 587.
16. Green, F.; Clausen, C. A.; Highley, T. L.; Anal. Biochem. 1989, 182, 197.
17. Dubois, M.; Gilles, K. A.; Hamilton, J. K.; Rebers, P. A.; Smith, F.; Anal. Chem. 1956, 28, 350.
18. Deng, S. P.; Tabatabai, M. A.; Soil. Biol. Biochem. 1994, 26, 473.
19. Maiti, B.; Rathore, A.; Srivastava, S.; Shekhawat, M.; Srivastava, P.; Appl. Microbiol. Biotechnol. 2011, 90, 385. 20. Papastathopoulos, D. S.; Nikolelis, D. P.; Hadjiioannou, T. P.;
Analyst 1977, 102, 852.
21. Narinesingh, D.; Stoute, V. A.; Davis, G.; Persad, D.; Ngo, T. T.; Anal. Chim. Acta 1992, 258, 141.
22. Gonçalves, C.; Rodriguez-Jasso, R. M.; Gomes, N.; Teixeira, J. A.; Belo, I.; Anal. Methods 2010, 2, 2046.
23. Kim, S. J.; Dwiatmoko, A. A.; Choi, J. W.; Suh, Y. W.; Suh, D. J.; Oh, M.; Bioresour. Technol. 2010, 101, 8273.
24. Nagarajan, D. R.; Rajagopalan, G.; Krishnan, C.; Appl. Microbiol. Biotechnol. 2006, 73, 591.
25. Zorov, I. N.; Dubasova, M. Y.; Sinitsyn, A. P.; Gusakov, A. V. ; Mitchenko, A. A.; Baraznenok, V. A.; Gutyerres, B.; Popova, N. N.; Biokhimiya 1997, 62, 704.
26. Miller, G. L.; Anal. Chem. 1959, 31, 426.
27. Mocak, J.; Bond, A. M.; Mitchell, S.; Scollary, G.; Pure Appl. Chem. 1997, 69, 297.
28. ISO 5725-1:1994, Accuracy (Trueness and Precision) of Measurement Methods and Results - Part 1: General Principles
and Definitions, 1994, http://www.iso.org/iso/iso_catalogue/
catalogue_tc/catalogue_detail.htm?csnumber=11833 accessed on July 2, 2012.
30. Shabir, G. A.; J. Chromatogr., A 2003, 987, 57.
31. ANM Technical Sheet N. 873/2008/01-02, Diclofenac; http://www.anm.ro/_/_RCP/RCP_873_09.07.08.pdf?s_den_ com=diclofenac&s_dci=&s_firm_tar_d=&s_forma_farm=&s_ cod_atc=&s_cim=&anmPageSize=&ID=6986 accessed on July 2, 2012.
32. ANM Technical Sheet N. 242/2007/01, Metoclopramid L a r o p h a r m; h t t p : / / w w w . a n m . r o / _ / _ R C P /
RCP_242_14.09.07.pdf?s_den_com=metoclopramid&s_ dci=&s_firm_tar_d=&s_forma_farm=&s_cod_atc=&s_ cim=&anmPageSize=&ID=18394 accessed on July 2, 2012.
33. ANM Technical Sheet N. 5199/2005/01, Saprosan; http:// www.anm.ro/_/_RCP/RCP_5199_16.03.05.pdf?s_den_ com=saprosan&s_dci=&s_firm_tar_d=&s_forma_farm=&s_ cod_atc=&s_cim=&anmPageSize=&ID=28471 accessed on October 2, 2011.
Submitted: December 21, 2011