0103 - 5053 $6.00+0.00
Article
*e-mail: [email protected]
A Structure-Activity Relationship (SAR) Study of Neolignan Compounds with
Anti-schistosomiasis Activity
Claúdio N. Alvesa,b, Luiz G. M. de Macedoa, Káthia M. Honórioa, Ademir J. Camargoa, Lourival S. Santosb, Iselino N. Jardimb, Lauro E. S. Baratac and Albérico B. F. da Silva*a
a
Departamento de Química e Física Molecular, Instituto de Química de São Carlos, Universidade de São Paulo, CP 780, 13560-970, São Carlos - SP, Brazil
b
Departamento de Química, Centro de Ciências Exatas e Naturais, Universidade Federal do Pará, CP 11101, 66075-110 Belém - PA, Brazil
c
Instituto de Química, Universidade Estadual de Campinas, CP 6154, 13083-970, Campinas - SP, Brazil
Um conjunto de dezoito compostos de neolignanas com atividade antiesquistossomose foi estudado com o método semi-empírico PM3 e outros métodos teóricos com o intuito de avaliar algumas propriedades (variáveis ou descritores) moleculares selecionadas e correlacioná-las com a atividade biológica.
Análise exploratória dos dados (análise de componentes principais, PCA, e análise hierárquica de agrupamentos, HCA), análise discriminante (DA) e o método KNN foram utilizados na obtenção de possíveis correlações entre os descritores calculados e a atividade biológica em questão e na predição da atividade antiesquistossimose de algumas moléculas teste. Os descritores moleculares responsáveis pela separação entre os compostos ativos e inativos foram: energia de hidratação (HE), refratividade molecular (MR) e carga sobre o átomo C19 (Q19). Estes descritores fornecem informações a respeito do tipo de interação que pode ocorrer entre os compostos e seu respectivo receptor biológico. Após a construção do modelo para compostos ativos e inativos, os métodos PCA, HCA, DA e KNN foram empregados em um estudo de predição. Foram estudados 10 novos compostos e somente 5 deles foram classificados como ativos contra esquistossomose.
A set of eighteen neolignan derivative compounds with anti-schistosomiasis activity was studied by using the quantum mechanical semi-empirical method PM3 and other theoretical methods in order to calculate selected molecular properties (variables or descriptors) to be correlated to their biological activities.
Exploratory data analysis (principal component analysis, PCA, and hierarchical cluster analysis, HCA), discriminant analysis (DA) and the Kth nearest neighbor (KNN) method were employed for obtaining possible relationships between the calculated descriptors and the biological activities studied and predicting the anti-schistosomiasis activity of new compounds from a test set. The molecular descriptors responsible for the separation between active and inactive compounds were: hydration energy (HE), molecular refractivity (MR) and charge on the C19 carbon atom (Q19). These descriptors give information on the kind of interaction that can occur between the compounds and their respective biological receptor. The prediction study was done with a new set of ten derivative compounds by using the PCA, HCA, DA and KNN methods and only five of them were predicted as active against schistosomiasis.
Keywords: PM3, neolignans, anti-schistosomiasis, principal component analysis, hierarchical cluster analysis, discriminant analysis, Kth nearest neighbor
Introduction
Neolignans are dimers obtained from oxidative coupling of allyl and propenyl phenols occurring in the
Myristicaceae and other primitive plant families. The
Virola is the most representative Myristicaceae found
throughout the Americas.1,2 In 1970, initial studies of leaves
of Virola surinamensis showed high efficacy in the
cercariae blockage tests of Schistosoma mansoni in mice.3
isolated and identified as the natural neolignans virolin and surinamensin.
In order to determine the biological activity of neolignans, Barata et al.4 and Santos5 synthesized eighteen
analogues of neolignan compounds which were submitted to biological tests against fungi, bacteria, leishmaniasis, schistosomiasis, cancer and PAF (platelet activating
factor).6 From the eighteen neolignan compounds
synthesized, five have been classified as active and thirteen have been classified as inactive against schistosomiasis (all tests in vitro).4,5
In the present work we calculated selected molecular descriptors of the eighteen neolignan derivatives synthesized4,5 and afterwards statistical methods (principal
component analysis, PCA, hierarchical cluster analysis, HCA, and discriminant analysis, DA) were used in order to obtain the relationship between the molecular descriptors and the biological activity. The results obtained with PCA, HCA and DA were tested in a new set of neolignan compounds and the KNN method was used for activity prediction of these new compounds. The molecular descriptors calculated were selected so that some steric, electronic and hydrophobic characteristics of these compounds could be taken into account since each one of
them can contribute to the biological activity and give information about the interactions between the compounds and their respective biological receptor.
Calculations
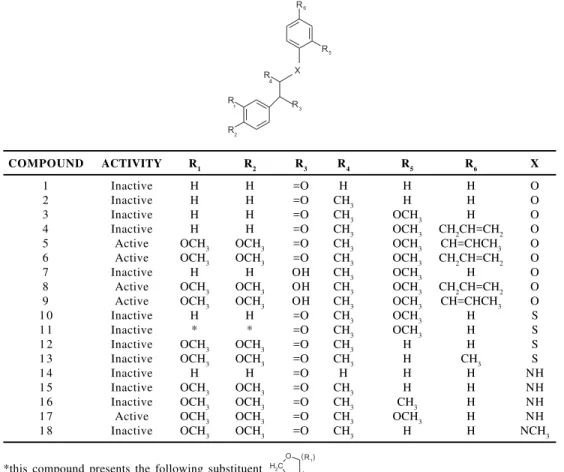
Figure 1 shows the central chemical structure and numbering used in all eighteen neolignan compounds studied here, and Figure 2 displays the individual chemical structure, along with the activity indication, for each one of the eighteen neolignan molecules.
Figure 1. The central chemical structure and numbering used in all neolignan compounds studied. The letters t and d are, respectively, dihedral and bond angles assessed in the calculations
COMPOUND ACTIVITY R1 R2 R3 R4 R5 R6 X
1 Inactive H H =O H H H O
2 Inactive H H =O CH3 H H O
3 Inactive H H =O CH3 OCH3 H O
4 Inactive H H =O CH3 OCH3 CH2CH=CH2 O
5 Active OCH3 OCH3 =O CH3 OCH3 CH=CHCH3 O
6 Active OCH3 OCH3 =O CH3 OCH3 CH2CH=CH2 O
7 Inactive H H OH CH3 OCH3 H O
8 Active OCH3 OCH3 OH CH3 OCH3 CH2CH=CH2 O
9 Active OCH3 OCH3 OH CH3 OCH3 CH=CHCH3 O
1 0 Inactive H H =O CH3 OCH3 H S
1 1 Inactive * * =O CH3 OCH3 H S
1 2 Inactive OCH3 OCH3 =O CH3 H H S
1 3 Inactive OCH3 OCH3 =O CH3 H CH3 S
1 4 Inactive H H =O H H H NH
1 5 Inactive OCH3 OCH3 =O CH3 H H NH
1 6 Inactive OCH3 OCH3 =O CH3 CH3 H NH
1 7 Active OCH3 OCH3 =O CH3 OCH3 H NH
1 8 Inactive OCH3 OCH3 =O CH3 H H NCH3
*this compound presents the following substituent
The compounds showed in Figure 2 consist of five active molecules (5, 6, 8, 9 and 17) and thirteen inactive molecules (1, 2, 3, 4, 7, 10, 11, 12, 13, 14, 15, 16 and 18). All geometry calculations were performed by using
the PM3 method7 and the geometries were fully optimized
by using the EF algorithm of the AMPAC 6.5 molecular package.8
Among many descriptors (variables) that have been
utilized in SAR studies,9-11 we have chosen the following
descriptors to be evaluated:
HOMO- The energy of the highest occupied molecular
orbital (eV);
LUMO - The energy of the lowest unoccupied molecular orbital (eV);
χ - Mulliken’s electronegativity (eV); POL - Molecular polarizability (a.u.);
QN - Net atomic charge on atom N;
t - Torsional angle (see Figure 1); d - bond angle (see Figure 1); HE - Hydration energy (kcal mol-1);
MR - Molecular refractivity (Å3);
VOL - Molecular volume (Å3);
Log P - Partition coefficient.
The calculated descriptors were selected so that they could represent electronic (HOMO, LUMO, χ, POL, Q2, Q3,
Q12, Q13, Q19, MR and HE), steric (t, d and VOL) and
hydrophobic (Log P) properties of the compounds studied. These properties (descriptors) are supposed to be important to explain the anti-schistosomiasis activity of the neolignan
molecules under study here9 and the number of calculated
descriptors was limited by the softwares we used in the calculations.
The structural descriptors t and d were obtained during the optimization procedure and the most stable structures were used to obtain the other descriptors. The descriptors
HOMO, LUMO, χ, POL and logP were obtained by using
the HyperChem/Chemplus molecular package12 and the
atomic charges were obtained by employing the
electro-static potential method of the Spartan program.13
The electrostatic potential method is based on the calculation of a set of punctual atomic charges so that they represent the possible best quantum molecular (electrostatic) potential for a set of points defined around a molecule.14,15 The routine developed by Connolly16 was
employed and this methodology uses a density of 1 point per A2 in four layers placed at distances 1.4, 1.6, 1.8 and
2.0 times the Van der Waals radii.16 The charges derived
from the electrostatic potential method are physically more satisfactory than the Mulliken’s charges,17 especially when
related to biological activity.
All the statistical analysis (PCA, HCA, DA and KNN)
employed here were performed making use of the program
MATLAB 6.0.18
Results and Discussion
Principal component analysis (PCA)
The central idea of PCA is to reduce the dimensionality of the data set explaining the variance-covariance structure. This is achieved by linear transformation of the original data set of variables into a smaller number of uncorrelated principal components (PCs). Geometrically, this transformation represents the rotation of the original coordinate system. The direction of the maximum residual variance is given by the first principal component axis. The second principal component, orthogonal to the first one, has the second maximum variance and so on. In this way, projections conserving maximum amounts of statistical information can be plotted in order to show us a more detailed study of data structure.19-21
Before applying the PCA method, each one of the variables was autoscaled so that they could be compared to each other on the same scale. Table 1 shows the correlation matrix for all calculated variables and it was initially obtained in order to eliminate the correlated variables.
After several attempts to obtain a good classification of the compounds (separation between the anti-schistosomiasis active and inactive compounds), the best separation was obtained with 3 variables (see Table 2) out of the 15 we had initially. This suggests that the other 12 variables are not important for classifying these compounds according to their anti-schistosomiasis activity. Table 3 shows the correlation matrix for the three variables used for the separation between active and inactive compounds.
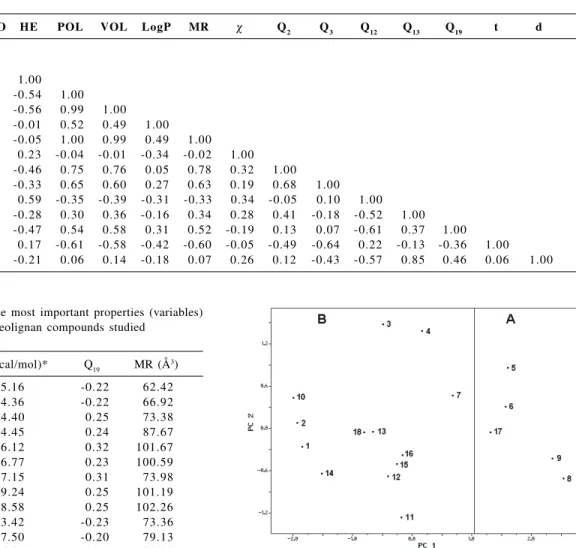
The PCA results show that the first two principal components (PC1 and PC2) describe 84.63% of the overall variance as follows: PC1 = 67.11 and PC2 = 17.52%. Since almost all of the variance is explained by the first two PCs, their score plot is a reliable representation of the spatial distribution of the points for the data set studied.
Table 2. Values of the three most important properties (variables) that classify the eighteen neolignan compounds studied
COMPOUND HE (kcal/mol)* Q19 MR (Å3)
1 -5.16 -0.22 62.42
2 -4.36 -0.22 66.92
3 -4.40 0.25 73.38
4 -4.45 0.24 87.67
5 -6.12 0.32 101.67
6 -6.77 0.23 100.59
7 -7.15 0.31 73.98
8 -9.24 0.25 101.19
9 -8.58 0.25 102.26
1 0 -3.42 -0.23 73.36
1 1 -7.50 -0.20 79.13
1 2 -6.04 -0.21 86.29
1 3 -4.63 -0.20 91.33
1 4 -5.79 -0.25 66.15
1 5 -5.90 -0.17 88.61
1 6 -5.90 -0.13 88.61
1 7 -7.54 0.21 90.04
1 8 -4.67 -0.20 87.81
* 1 cal = 4.18 J
Table 3. Correlation matrix between the three most important properties (variables)
HE Q19 MR
HE 1 -0.407 -0.515
Q19 1 0.506
MR 1
Table 1. Correlation matrix between all properties (variables) calculated
HOMO LUMO HE POL VOL LogP MR χ Q2 Q3 Q12 Q13 Q19 t d
HOMO 1.00
LUMO -0.12 1.00
HE -0.35 -0.04 1.00
POL 0.32 -0.14 -0.54 1.00
VOL 0.34 -0.19 -0.56 0.99 1.00
LogP 0.08 0.33 -0.01 0.52 0.49 1.00
MR 0.34 -0.18 -0.05 1.00 0.99 0.49 1.00
χ -0.42 -0.85 0.23 -0.04 -0.01 -0.34 -0.02 1.00
Q2 0.18 -0.45 -0.46 0.75 0.76 0.05 0.78 0.32 1.00
Q3 -0.28 -0.04 -0.33 0.65 0.60 0.27 0.63 0.19 0.68 1.00 Q12 -0.33 -0.18 0.59 -0.35 -0.39 -0.31 -0.33 0.34 -0.05 0.10 1.00 Q13 0.41 -0.54 -0.28 0.30 0.36 -0.16 0.34 0.28 0.41 -0.18 -0.52 1.00 Q19 0.26 0.05 -0.47 0.54 0.58 0.31 0.52 -0.19 0.13 0.07 -0.61 0.37 1.00
t 0.28 -0.12 0.17 -0.61 -0.58 -0.42 -0.60 -0.05 -0.49 -0.64 0.22 -0.13 -0.36 1.00 d 0.26 -0.43 -0.21 0.06 0.14 -0.18 0.07 0.26 0.12 -0.43 -0.57 0.85 0.46 0.06 1.00
Figure 3. PCA scores (PC1 and PC2) for the eighteen compounds with anti-schistosomiasis activity. The PCA methodology leads to a separation between two groups: active (Group A) and inactive (Group B)
Figure 4. PCA loading vectors (PC1 and PC2) for the three variables responsible for the separation between the active and inactive compounds: HE is the hydration energy, Q19 is the net atomic charge on atom C19 and MR is the molecular refractivity Table 4. Loadings of the two principal components
Variable PC1 PC2
Q19 0.570 0.727
MR 0.589 -0.037
displays the plot of the loading vectors for the first two principal components (PC1 and PC2).
According to Table 4, PC1 can be expressed through the following equation:
PC1 = 0.589[MR] + 0.570[Q19] - 0.572[HE]
From the equation above, we can see that active molecules can be obtained when we have higher values for MR combined with more positive charges on C19 and lower values for the variable HE (notice that HE is negative in the PC1 equation). These characteristics can be useful in the design of new neolignan compounds with effective anti-schistosomiasis activity. Here it is interesting to mention that the variables Q19, HE and MR are all electronic descriptors and represent the strength of a molecular association by electrostatic interaction.
Hierarchical cluster analysis (HCA)
Another technique very used for analyzing a complex data is the hierarchical cluster analysis (HCA). In the HCA, each object (the 18 molecules studied) is initially assumed to be a lone cluster. One similarity matrix is built, generally calculating the Euclidean distance between all the objects, and scanned for the minor values. The corresponding objects are clustered together and treated as a single cluster. Successive iterations lead to the total clustering of all objects generating a dendrogram with the objects clustered together according to their similarity level.
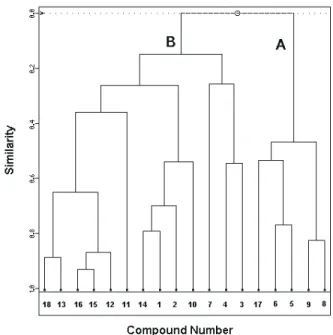
Figure 5 shows the results obtained from the HCA analysis. The horizontal lines in Figure 5 represent the compounds and the vertical lines the similarity values between pairs of compounds, a compound and a group of compounds and between groups of compounds. The similarity value between the two classes of compounds was 0.15 and this means these two classes are distinct. From Figure 5, we can see the HCA results are very similar to those obtained with the PCA analysis, i.e. the compounds studied were grouped into two categories: actives (5, 6, 8, 9 and 17) and inactives (1, 2, 3, 4, 7, 10, 11, 12, 13, 14, 15, 16 and 18).
Stepwise discriminant analysis
Discriminant analysis is a multivariate technique that has two principal goals: (1) separate objects from distinct populations; (2) allocate new objects to populations previously defined.21,22 Here we consider two groups: Group
A, that contains the active compounds (5, 6, 8, 9 and 17) and Group B, that contains the inactive compounds (1, 2, 3, 4, 7, 10, 11, 12, 13, 14, 15, 16 and 18).
The stepwise discriminant analysis is a linear discriminant method based on the Fischer test (F-test) for the significance of the variables.22 In each step one variable
will be selected on the basis of its significance. After two steps, the two more significant variables were extracted from the fifteen variables under investigation: MR and HE. The discriminant functions are given as follows:
Group A : -76.67 + 1.16 MR - 4.71 HE Group B : -45.44 + 0.93 MR - 3.22 HE
The variables MR and HE represent the strength of a molecular association by electrostatic interaction. By using the quantities given in the discriminant functions above, we can obtain the classification summary showed in Table 5.
The classification error rate was 0%, resulting in a satisfactory separation of the two groups. The allocation rule derived from the DA results, when the anti-schistosomiasis activity of a new neolignan compound is investigated, is: (a) initially one calculates, for the new
Figure 5. Dendrogram obtained for eighteen neolignan compounds studied. The compounds are grouped into two categories: A (actives) and B (inactives)
Table 5. Classification matrix
Classified group True group
A B
A 5 0
B 0 1 3
Total 5 1 3
neolignan compound, the value of the two more important variables obtained with the DA methodology (MR and HE); (b) substitute these values in the two discriminant functions obtained in this work; (c) check which discriminant function (Group A - anti-shistosomiasis active compounds or Group B - anti-shistosomiasis inactive compounds) presents the higher value. The new neolignan compound is active if the higher value is related to the discriminant function of Group A and vice versa.
Comparing the results obtained with the DA and PCA methodologies, we can notice that the variables MR and HE are important in both methodologies. Recalling the PC1 equation, one sees that MR and HE are the two variables with higher weights. Thus, combining the results obtained with DA and PCA we can say that MR and HE are key variables for explaining the anti-shistosomiasis activity of the neolignan compounds studied here, but
also Q19 is an important variable to be considered when
one is trying to obtain (design) neolignan compounds with anti-schistosomiasis activity.
It is interesting to notice that all of the three variables
(MR, HE and Q19 ) found here as having an important role
in anti-schistosomiasis activity are electronic descriptors, therefore we can conclude that electronic properties have a very important role in the anti-schistosomiasis activity of neolignan compounds. Particularly, as the descriptors
MR, HE and Q19 represent the strength of a molecular
association by electronic interaction, it is reasonable to suggest that electrostatic interactions play an important role in the mechanism of the anti-schistosomiasis activity.
Kth nearest neighbor (KNN)
The KNN method classifies a new compound (object) according to its distance to an object of the training set. The closer neighbors of the training set are found and the object will be assigned into the class that have the majority of its nearest neighbors. This method is self-validating because in the training set each sample (object) is compared with all of the others in the set but not with itself. The best value of K can be chosen based on the results from the
training set alone.23 The classical KNN approach does not
have outlier detection capability, i.e. a classification is always made whether or not the unknown object is a member of any class in the training set.
This method was used for the validation of the initial data set and Table 6 presents the results obtained with 1, 3 and 5 nearest neighbors. For the case of 1 nearest neighbor (1NN), the percentage of correct information was 100% while for 3 and 5 nearest neighbors (3NN and 5NN) the
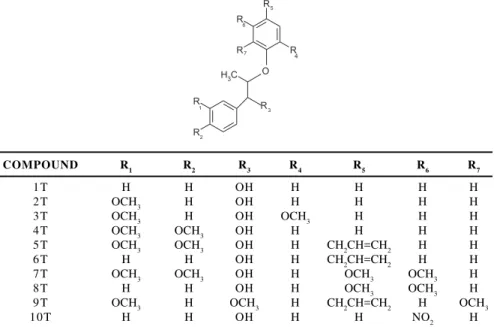
COMPOUND R1 R2 R3 R4 R5 R6 R7
1T H H OH H H H H
2T OCH3 H OH H H H H
3T OCH3 H OH OCH3 H H H
4T OCH3 OCH3 OH H H H H
5T OCH3 OCH3 OH H CH2CH=CH2 H H
6T H H OH H CH2CH=CH2 H H
7T OCH3 OCH3 OH H OCH3 OCH3 H
8T H H OH H OCH3 OCH3 H
9T OCH3 H OCH3 H CH2CH=CH2 H OCH3
10T H H OH H H NO2 H
Figure 6. The test set (the ten new neolignan compounds)
Table 6. Classification obtained with the KNN method
Category Number of Compounds
compounds incorrectly classified
1NN 3NN 5NN
Active 5 0 0 0
Inactive 1 3 0 1 1
Total 1 8 0 1 1
Percentage of
percentage was 94.4%. We decided to use 5NN instead of 1NN because the percentage of correct information is still high (94.4%) and the greater the number of nearest neighbors, the better the reliability of the KNN method.
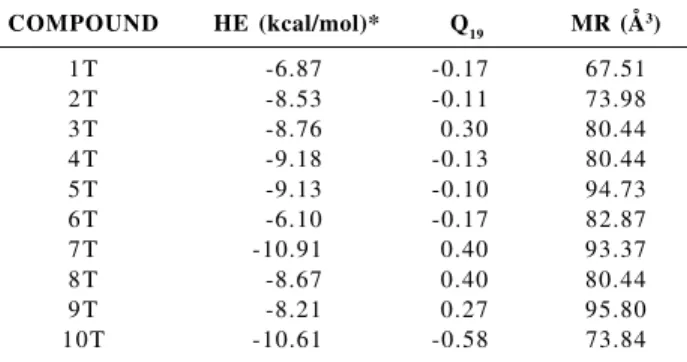
Since the experimental group we are working with had the proposal of ten new structures of neolignan compounds not yet synthesized (see Figure 6) we decided to apply our PCA, HCA and DA results, along with the KNN method, in the ten new neolignan compounds with the aim to predict the anti-schistosomiasis activity for this new set of molecules (test set). Table 7 shows the calculated values obtained for the test set with the variables HE, Q19 and MR.
The results (prediction) obtained with the PCA, HCA, DA and KNN methods for the molecules showed in Figure 6 were similar. According to these four methods, the compounds 3T, 5T, 7T, 8T and 9T were classified as active molecules against schistosomiasis while the compounds 1T, 2T, 4T, 6T and 10T were classified as inactive molecules.
It is interesting to notice that compounds 3T and 8T were classified as active molecules with PCA, DA and KNN, and as inactive molecules with HCA, and compound 10T was classified as an inactive molecule with PCA, DA and KNN, and as an active molecule with HCA. However, compounds 3T and 8T have a higher probability to be consider as active molecules and compound 10T has a higher probability to be consider as an inactive molecule as three out of the four methods used in our prediction study had the same prediction results for the compounds 3T, 8T and 10T. The prediction results obtained with the four methods are summarized in Table 8.
Conclusions
The principal component analysis (PCA) and hierar-chical cluster analysis (HCA) show that the neolignan
derivative compounds studied here can be correctly classified into two groups (A and B) according to their anti-schistosomiasis activity. The PCA results show that
the variables MR, HE and Q19 are responsible for the
separation between active and inactive compounds. The discriminant analysis (DA) shows that the two groups A (active compounds) and B (inactive compounds) are well separated and only two variables, MR and HE, are responsible for the separation between the active and inactive compounds. The error rate was 0% and suggests an allocation rule to classify new neolignan compounds as active or inactive against schistosomiasis.
Since MR, HE and Q19 are all electronic descriptors we conclude that electronic properties have an important role in anti-schistosomiasis activity of neolignan compounds.
Particularly, as the descriptors MR, HE and Q19 represent
the strength of a molecular association by electronic interaction, it is reasonable to suggest that electrostatic interactions play an important role in the mechanism of the anti-schistosomiasis activity.
The PCA, HCA, DA and KNN methods were applied to ten new neolignan derivative compounds and classified five of them as active against schistosomiasis.
Acknowledgments
The authors would like to thank CAPES, CNPq, FAPESP and FINEP (Brazilian agencies) for the financial support in this work.
References
1. Gottlieb, O.R.; Fortschr. Chem. Org. Naturst.1977, 35, 1.
2. Whiting, D.A.; Nat. Prod. Rep. 1990,349, 7.
3. Barata, L.E.S.; PhD Thesis, Universidade Estadual de
Campinas, Brazil, 1976. Table 7. Values obtained for the properties (variables) of the ten new
neolignan compounds (test set)
COMPOUND HE (kcal/mol)* Q19 MR (Å3)
1T -6.87 -0.17 67.51
2T -8.53 -0.11 73.98
3T -8.76 0.30 80.44
4T -9.18 -0.13 80.44
5T -9.13 -0.10 94.73
6T -6.10 -0.17 82.87
7T -10.91 0.40 93.37
8T -8.67 0.40 80.44
9T -8.21 0.27 95.80
10T -10.61 -0.58 73.84
* 1 cal = 4.18 J
Table 8. The prediction results obtained with the four pattern recog-nition methods for the 10 new compounds: active compound (+) and inactive compound (-)
COMPOUND ACTIVITY
PCA HCA DA KNN
1T - - -
-2T - - -
-3T + - + +
4T - - -
-5T + + + +
6T - - -
-7T + + + +
8T + - + +
9T + + + +
-4. Barata, L.E.S.; Baker, P.M.; Gottlieb, O.R.; Ruveda, E.A.;
Phytochemistry 1978, 17, 783.
5. Santos, L.S.; PhD Thesis, Universidade Estadual de Campinas,
Brazil, 1991.
6. Barata, L.E.S.; Santos, L.S.; Fernandes, A.M.A.P.; Ferri, P.H.; Paulo, M.Q.R.; Joudan, M.C.; 2nd Brazilian-German
Sympo-sium on Natural Products, Hannover, 1991.
7. Stewart, J.J.P.; J. Comput. Aided Mol. Des.1990,4, 1.
8. Dewar, M.J.S.; AMPAC 5.0; Program for semiempirical
cal-culations; University of Texas, USA, 1994.
9. Alves, C.N.; Santos, L.S.; Jardim, I.N.; J. Braz. Chem. Soc.
1998,9, 574.
10. Alves, C.N.; Pinheiro, J.C.; Camargo, A.J.; Souza, A.J. de; Carvalho, R.B.; Silva, A.B.F. da; J. Mol. Struct. 1999,491,
123.
11. Alves, C.N.; Pinheiro, J.C.; Camargo, A.J.; Ferreira, M.M.C.; Silva, A.B.F. da; J. Mol.Struct. 2000, 530, 39.
12. Ostlund, N. S.; HyperChem 4.5; Program for molecular
visu-alization and simulation; University of Waterloo, Canada,
1995.
13. Hehre, W.J.; Huang, W.W.; Klunzinger, P.E.; Deppmeier, B.J.; Driessen, A.J.; Spartan 5.0; Program for molecular mechanics
and quantum chemical calculations; University of California,
USA, 1997.
14. Williams, D.E.; Yan, J.; Adv. Atomic Mol. Phys.1998,23, 87.
15. Chirlian, L.E.; Francl, M.M.; J. Comput. Chem.1987,8, 894.
16. Connolly, M.L.; J. Appl. Crystallogr.1983,16, 548.
17. Singh, U.C.; Kollman, P.A.; J. Comput. Chem.1984, 5, 129.
18. Little, J.; MATLAB; Program for mathematical computing;
MathWorks Inc., USA, 2000.
19. Chatterjee, S.; Price, B. In Regression Analysis by Example,
John Wiley & Sons: New York, 1977, p. 228.
20. Kowalski, B.R.; Bender, C.F.; J. Am. Chem. Soc.1972, 9,
5632.
21. Johnson, R.A.; Wichern, D.W. In Applied Multivariate
Statis-tical Analysis, Prentice-Hall: Englewood Cliffs, NJ, 1992,
p. 642.
22. Mardia, K.V.; Kent, J.T.; Bibby, J. M. In Multivariate Analysis,
Academic Press: New York, 1979, p. 521.
23. Lindon, J.C.; Holmes, E.; Nicholson, J.K.; Prog. Nucl. Magn.
Reson. Spectrosc.2001, 39, 1.
Received: March 9, 2001 Published on the web: March 27, 2002