0103 - 5053 $6.00+0.00
A
r
ti
c
le
* e-mail: [email protected]
Determination of Cd, Pb, Zn and Cu in Sediment Compartments by Sequential Extraction
and Isotope Dilution Inductively Coupled Plasma Mass Spectrometry (ID-ICP-MS)
Paulo C. F. C. Gardolinski, Ana P. Packer*, Celso R. de Almeida and M. Fernanda Giné
Centro de Energia Nuclear na Agricultura, Universidade de São Paulo, Av. Centenário 303, CP 96, 13416-000, Piracicaba - SP, Brazil
As concentrações de Cd, Cu, Pb e Zn ligados as diferentes frações dos sedimentos, foram extraídos em seqüência e determinados aplicando o método da diluição isotópica por espectrometria de massas com fonte de plasma (ID-ICP-MS). Os metais ligados a cada uma das frações foram extraídos seguindo o procedimento da extração seqüencial recomendado pelo “Bureau Commun de Référence” (BCR) da Comissão das Comunidades Européias. O método da diluição isotópica foi aplicado para quantificação dos metais como alternativa ao método de calibração externa, para isto adicionou-se aos extratos os materiais enriquecidos nos isótopos 112Cd, 63Cu, 208Pb e 66Zn. A
metodologia proposta foi aplicada para a determinação de metais em um sedimento de lago que foi recuperado após a mineração de xisto, juntamente com os materiais de referência certificados, sedimento de rio (NIST-2704) e sedimento de estuário (BCR-277). Os limites de detecção variaram entre 0,31 a 0,53 µg L-1 para o Cd, 0,92 a 2,9 µg L-1 para o Cu, 0,22 a 1,1 µg L-1 para o Pb e entre 1,3
a 7,6 µg L-1 para o Zn. A soma das concentrações destes metais encontradas nas diferentes frações
dos sedimentos foram comparáveis ao nível de confiança de 95%, com a digestão completa para o sedimento da área recuperada e com aos valores certificados dos materiais de referência NIST-2704 e BCR-277.
Trace concentrations of Cd, Cu, Pb and Zn in four different sediment fractions extracted in sequence were determined by isotope dilution inductively coupled mass spectrometry (ID-ICP-MS). The metals from each fraction were extracted following the sequential extraction procedure recommended by the Bureau Commun de Référence (BCR) of the Commission of the European Communities. As an alternative to external calibration, the elements were quantified by spiking the extracted solutions with 112Cd, 63Cu, 208Pb and 66Zn and application of isotope dilution. The proposed
approach was applied to a sample collected from a lake and two standard reference materials, NIST-2704 river sediment from the National Institute of Standards & Technology and the BCR-277 estuarine sediment. Detection limits, for each extracted solution, varied from 0.31 to 0.53 µg L-1 for
Cd, 0.92 to 2.9 µg L-1 for Cu, 0.22 to 1.1 µg L-1 for Pb and 1.3 to 7.6 µg L-1 for Zn. The sum of the
metals concentration in the different fractions was compatible with 95% confidence level found amounts obtained with complete digestion of the samples and with the certified values of the standard reference materials.
Keywords: isotope dilution, inductively coupled plasma mass spectrometry, sequential extraction of metals, sediment analysis, BCR protocol
Introduction
Since total concentration does not yield information on mobility, origin or bioavailability of metallic elements, metals in sediments have to be associated with the different fractions present. For soils and sediments the term speciation refers to the process of identification and quantification of metals in phases, such as carbonates,
oxides, organic matter and others, which may be extracted in sequence.1 There are several sequential extraction
procedures (SEP) available in the literature for different purposes, such as determination of trace elements in soils
containing natural mineral and humic-acid,2 metal
speciation in aquatic sediments,3 pH influence on the Cd
form in soils,4 and others.5-8 To harmonize the extraction
methods proposed,9 the Bureau Commun de Référence
procedure for inter-laboratory comparison.10-12 This
protocol emphasizes the extraction of metals using acetic acid for exchangeable and soluble compounds, hydroxylamine chloride for Mn and Fe oxides, hydrogen peroxide plus ammonium acetate for those bound to organic matter and sulphides, and aqua regia plus perchloric acid for the mineral fractions.
The BCR extraction procedure was applied to marine reference sediments to be analysed by inductively coupled plasma-mass spectrometry (ICP-MS) with quantification via standard solutions prepared for each extracting solution.13 Accuracy was assessed by comparing the sum
of metal concentrations obtained in the dissolved compartments with the certified value of a reference material.13-17 Recoveries between 85 and 112 % of the
certified value have been reported in the literature.13
The aim of this work was to use isotope dilution method to quantify with ICP-MS Cd, Cu, Pb and Zn in solutions extracted from sediments. The Isotope ratios of 112Cd/114Cd, 63Cu/65Cu, 208Pb/206Pb and 66Zn/68Zn were measured twice
in each of the spiked and unspiked solutions. Accuracy was assessed as outlined earlier.13
Experimental
Apparatus
A VG Plasma Quad PQII ICP-MS (VG Elemental, Winsford, Cheshire, UK) ICP-MS instrument was used with a concentric nebulizer and a cooled (5 °C) double-pass Scott-type spray chamber. Solution was propelled to the nebulizer by a peristaltic pump (Gilson, Miniplus3-M312, Villiers le Bel, France).
The sequential extractions were performed using a heater bath (Fanem 14), horizontal mechanical shaker and centrifuges (Excelsa Baby II) from Fanem (Guarulhos, SP,
Brazil). Digestion of the residual sediment was performed in closed PTFE bombs in a heated block, Tecnal (Piracicaba, SP, Brazil).
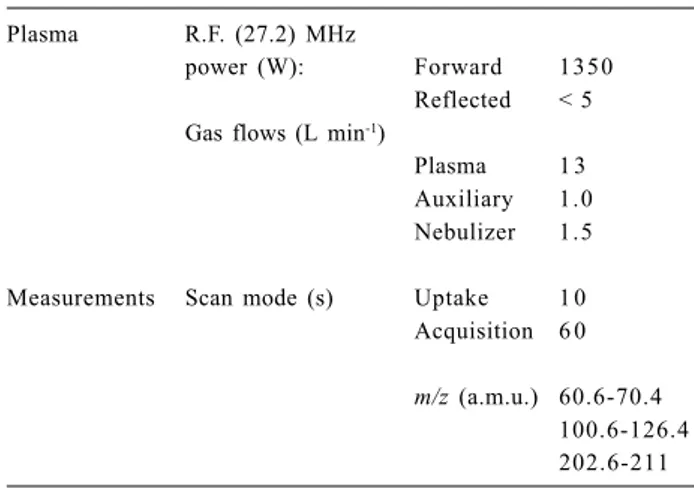
Typical instrument operating conditions for the ICP-MS are listed in Table 1. A fiberglass filter placed in a Tygon tube was used to prevent nebulizer clogging and allow an uptake rate of 1 mL min-1. The Cd, Cu, Pb and Zn
isotope ratios were measured in the scanning mode, with variation of the acquisition time depending on each elemental concentration in the extract. The isotope ratio data were obtained by scanning the masses from 60.6 to 70.4 for Cu and Zn, from 100.6 to 126.4 for Cd and Sn, and from 202.6 to 211.4 for Pb, respectivelly. These conditions were used for all measurements.
Reagents and Solutions
Purified water (18.2 MΩ cm-1) produced by a Milli-Q
system (Millipore, Bedford, MA, USA) and nitric, hydrochloric and acetic acid (Merck, Darmstadt, Germany) purified by sub-boiling distillation were used throughout. In addition, analytical grade hydrofluoric and perchloric acid, 30% w/v hydrogen peroxide, ammonium acetate and hydroxylamine chloride were obtained from Merck. All solutions were prepared using material and glassware previously decontaminated, by overnight soaking in 10% v/v HNO3 and copious washing in purified water.
External calibration analysis was carried out using standard solutions containing Cd, Cu, Pb and Zn in concentrations of 50 and 100 µg L-1 in 0.014 mol L-1 HNO
3
prepared from a 10 mg L-1 multi-element solution of the
CLMS-2 standard from Spex (Spex Ind., Edison, NJ, USA). The extracting solutions, prepared by following the BCR protocol,10 were acetic acid (0.11 mol L-1), hydroxylamine
chloride (0.1 mol L-1), hydrogen peroxide (8.8 mol L-1) and
ammonium acetate (1 mol L-1). The residue remaining after
the extraction procedure was digested in aqua regia (3:1 v/ v), hydrofluoric, perchloric and nitric acids.
The following enriched isotopic compounds fromCIL
(Cambridge Isotope Laboratories, Andover, MA, USA) were used: 112CdO (97 atom %), 63CuO (98.8 atom %), 208PbCO
3
(99.8 atom %) and 66ZnO (99 atom %). The working spike
solutions were 0.250, 1.00 and 10.0 mg L-1 of 112Cd; 100
and 500 mg L-1 of 63Cu; 10.0, 100 and 500 mg L-1 of 208Pb
and 100 mg L-1 of 66Zn. All these solutions were prepared
in 1 % v/v HNO3.
Sample Processing
A lake sediment sample (SED) from a recovered shale mining area located in São Mateus do Sul (Paraná, Brazil)
Table 1. Instrumental and operational parameters of the ICP-MS
Plasma R.F. (27.2) MHz
power (W): Forward 1350
Reflected < 5 Gas flows (L min-1)
Plasma 1 3 Auxiliary 1.0 Nebulizer 1.5
Measurements Scan mode (s) Uptake 1 0 Acquisition 6 0
was processed together with the Buffalo River Sediment from the National Institute of Standards & Technology
(NIST- SRM 2704) and the Estuarine Sediment from the
Commission of the European Communities, Community Bureau of Reference (BCR - 277).
The lake sediment (SED) was previously dried, sieved (1 mm) and homogenized. The homogeneity test was applied to Ca, Mg, Fe and Ti in the total dissolved sub-samples following the procedure described elsewhere.11
The sequential extraction procedure started by shaking 1 g of sediment with 40 mL of acetic acid (0.11 mol L-1)for
16 h in a horizontal mechanical shaker at 40 rpm. After centrifugation at 4000 rpm for 15 min, the first extract A was collected in a polypropylene bottle and stored at 4 °C until analysis. The insoluble residue was washed with 20 mL water by shaking at 40 rpm for 15 min and then adding 40 mL of hydroxylamine chloride (0.1 mol L-1) adjusted to pH
2 with nitric acid. The second extract, B, was collected and the insoluble residue washed as described before. In sequence, the residue received five aliquots of 2 mL of hydrogen peroxide (8.8 mol L-1), waiting some minutes
between additions to avoid losses due to the violent reaction with organic matter. Finally, the solution was diluted to 50 mL with ammonium acetate (1 mol L-1) and pH adjusted to
2 with nitric acid. The extraction was repeated. The extract C was collected and the residue washed. The insoluble residue was dried at 40 °C and transferred to PTFE bombs, received 15 mL of aqua regia, were closed and heated to 160 °C for 12 h. After cooling, the bombs were opened and the acids were evaporated to near dryness. For a second time, the aqua regia was added, the bombs were closed, heated, cooled, opened and the acids evaporated. Then, 20 mL of concentrated hydrofluoric acid was added, the bombs were closed and heated to 140 °C for 8 h. The bombs were once more opened and the acids evaporated to near dryness. Finally, an aliquot of 5 mL of concentrated HClO4 was added, heated to 210 °C and taken to complete dryness. After cooling, the sample volume was completed to 100 mL with 0.5 mol L-1 HNO
3.
Isotope Dilution Method
The ID method is based on spiking the sample with a known amount of the enriched isotope, thus changing the natural isotopic ratio.18 The analytical procedure began
by analysing the samples to estimate the elemental concentrations (C) and to verify the isotopic abundances (A and B).18,19 In addition, the isotopic abundances and
the concentrations of the spike solutions were verified. Hence, using the sample and spike isotopic abundances the masses of enriched materials to be added to the samples
were calculated. Considering the best precision, the target solution must attain an isotope ratio close to one.18
However, the spikes 63Cu, 208Pb and 66Zn are enriched
naturally in the most abundant isotope and 112Cd is not
depleted enough to reach an isotope ratio near to one, without significantly increasing the propagated error in
the final calculated concentration.20 Therefore, to
minimize the propagated error, the optimum isotope ratio was calculated according to equation 1, described in detail elsewhere:19
(1)
where Rot = optimum isotope ratio; Rn = natural isotope ratio in the sample and Rs = isotope ratio in the enriched material.
Subsequently, the spike mass (Ms) to be added was calculated by the reverse isotope dilution equation (equation 2):
(2)
where Ms = spike mass (µg); K = natural atomic mass/ enriched atomic mass; M = sample mass (µg); Rot = optimum isotope ratio; A and B are the isotopic abundances in the sample (at. %), AS and BS are the spike isotopic abundances (at. %).
Next, the altered isotope ratio (R) was measured. Using this value, the element concentration in the sample was calculated by the isotope dilution equation (equation 3):18
(3)
where C = analyte concentration (µg L-1); R= measured
isotope ratio in the final solution; Ws = spike volume (L); W = sample volume (L).
Results and Discussion
Repeated determinations of Ca, Mg, Fe and Ti in five sediment sub-samples by ICP-MS present less than 5% variability, confirming the homogeneous distribution of these elements.
The detection limits (DL) calculated using 3σ of each blank solution are presented in Table 3. Despite the high DL’s obtained in this work, the limits for all the extracts were adequate to determine the target elements in all samples.
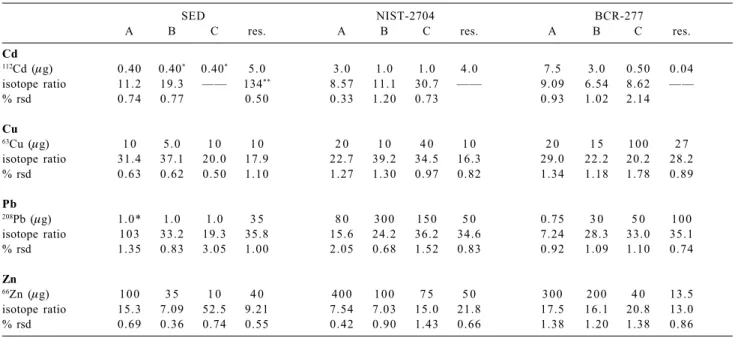
Next, the sediments SED, NIST-2704 and BCR-277 were spiked with the amounts of enriched material
presented in Table 4. For the elements not detected in the extracted solutions, presented in Table 2 (Pb in extract A and Cd in extracts B and C), the spike was estimated assuming an initial concentration of 5 µg L-1.
The 63Cu, 65Cu, 66Zn, 68Zn, 112Cd, 114Cd, 206Pb and 208Pb
isotopes were measured in scanning mode to monitor for possible matrix interferences. The isotope ratios and precisions are presented in Table 4. In some cases the measured ratios disagree with the optimum isotope ratio (112Cd/114Cd = 9; 63Cu/65Cu = 14; 208Pb/206Pb = 45 and 66Zn/ 68Zn = 25) because of errors in estimating the concentration
due to the complexity of the matrices.
The concentration of Cd in the residue solution of SED was over-estimated in the quantitative analysis because of the interferences of Sn at m/z 112 and 114. Consequently, this sample was over-spiked, affecting the 112Cd/114Cd
isotope ratio. To compensate this interference, the signal
Table 2. Estimated concentrations (µg L-1)in the extracted solutions
(n = 3)
Cd Cu Pb Zn
SED
Extract A 8 1 2 3 - 2099
Extract B - 9 1 6 5 1 4
Extract C - 1 5 6 7 1 6 6
Residue 2* 1 8 0 2 2 9 6 0 6
(130)**
NIST-2704
Extract A 9 0 3 3 5 6 7 2 5650
Extract B 2 0 1 2 6 2000 1900
Extract C 2 0 7 4 7 1050 1100
Residue 1 1 0 1 6 6 2 8 0 9 4 2
BCR - 277
Extract A 2 0 0 1 3 5 1 0 8900
Extract B 9 0 1 0 5 3 3 0 4800
Extract C 4 8 5 0 4 5 0 1100
Residue 1 2 1 5 6 3 0 3 9 5
- < detection limit
Cd calculated using *111Cd and ** 112Cd
Table 3. Detection limits (µg L-1)(n=11)
Solutions Cd Cu Pb Zn
CH3COOH 0.31 1.24 0.34 3.3
(0.11 mol L-1)
NH2OH-HCl 0.37 0.92 0.22 1.3
(0.1 mol L-1) at pH=2
CH3COONH4 0.53 2.9 1.1 7.6
(1 mol L-1) at pH=2
Table 4. Amounts of enriched isotope added to the different extract solutions (A, B and C) and to the residue (res.). Mean and relative standard
deviation (% rsd) of the altered isotope ratio measured
SED NIST-2704 BCR-277
A B C res. A B C res. A B C res.
Cd
112Cd (µg) 0.40 0.40* 0.40* 5.0 3.0 1.0 1.0 4.0 7.5 3.0 0.50 0.04
isotope ratio 11.2 19.3 —— 134** 8.57 11.1 30.7 —— 9.09 6.54 8.62 ——
% rsd 0.74 0.77 0.50 0.33 1.20 0.73 0.93 1.02 2.14
Cu
63Cu (µg) 1 0 5.0 1 0 1 0 2 0 1 0 4 0 1 0 2 0 1 5 1 0 0 2 7
isotope ratio 31.4 37.1 20.0 17.9 22.7 39.2 34.5 16.3 29.0 22.2 20.2 28.2
% rsd 0.63 0.62 0.50 1.10 1.27 1.30 0.97 0.82 1.34 1.18 1.78 0.89
Pb
208Pb (µg) 1.0* 1.0 1.0 3 5 8 0 3 0 0 1 5 0 5 0 0.75 3 0 5 0 1 0 0
isotope ratio 1 0 3 33.2 19.3 35.8 15.6 24.2 36.2 34.6 7.24 28.3 33.0 35.1
% rsd 1.35 0.83 3.05 1.00 2.05 0.68 1.52 0.83 0.92 1.09 1.10 0.74
Zn
66Zn (µg) 1 0 0 3 5 1 0 4 0 4 0 0 1 0 0 7 5 5 0 3 0 0 2 0 0 4 0 13.5
isotope ratio 15.3 7.09 52.5 9.21 7.54 7.03 15.0 21.8 17.5 16.1 20.8 13.0
% rsd 0.69 0.36 0.74 0.55 0.42 0.90 1.43 0.66 1.38 1.20 1.38 0.86
of 122Sn and its respective abundance was used to calculate
the counts of 112Sn. From the total counts of m/z 112 the
calculated counts of 112Sn were subtracted and the
remaining counts were assumed to be from 112Cd. In this
case, Cd isotopes ratio were 112Cd/111Cd, due the absence
of isobaric interferences at m/z 111. The isotope ratio precision for three successive determinations of the same solution was less than 2.5 % for all elements, which is considered acceptable for environmental applications.21
The isotope ratio precision could be increased by increasing the measurement time and measuring in peak hopping mode.
Results of SED and NIST-2704 from 5 sets of the sequential extraction solutions, with three measurements,
are presented in Table 5. The in-set variations were determined using the propagation of errors, where the standard deviation of an individual solution (n = 3) propagate throughout the sub-samples of the extraction procedure (n = 5). These results were characterized by a relative standard deviation (RSD) below 5 %, which is in agreement with results reported in the literature for the BCR extraction procedure.21
Concentrations expressed in dry-weight are presented in Table 6. For SED and NIST-2704 the results of 5 sets in the extracted solutions produced were analyzed in three days (n = 45). The standard deviations of analyte concentrations in each of the extracted solutions and the sum of these extracts were determined using the
Table 5. Analyte concentrations (µg L-1) in the extracted solutions of SED and NIST-2704 obtained by the ID approach. Values correspond to
the mean and standard deviation of three measurements in 5 independent extracts (n = 15)
SED Cd Cu Pb Zn
Extract A 7.43 ± 0.20 110 ± 3 2.29 ± 0.09 1865 ± 33
Extract B 3.89 ± 0.12 86.5 ± 2.7 8.76 ± 0.34 918 ± 14
Extract C —— 176 ± 4 16.4 ± 0.6 57.6 ± 1.1
NIST-2704 Cd Cu Pb Z n
Extract A 80.7 ± 2.5 441 ± 9 1067 ± 26 5741 ± 30
Extract B 12.6 ± 0.2 80.9 ± 2.2 1876 ± 51 1807 ± 23
Extract C 2.76 ± 0.09 631 ± 20 564 ± 18 831 ± 12
Residue —— 450 ± 18 206 ± 4 884 ± 18
Table 6. Concentrations (µg g-1) of metals in sediment sample phases
Cd Cu Pb Zn
SED
Exchangeable and acid soluble 0.298 ± 0.013 4.43 ± 0.23 0.095 ± 0.004 73.8 ± 2.4
Reducible 0.151 ± 0.011 3.53 ± 0.22 0.351 ± 0.014 36.7 ± 1.7
Oxidizable —— 8.61 ± 0.31 0.831 ± 0.041 2.75 ± 0.16
Residue 0.587 ± 0.014 40.2 ± 0.5 20.3 ± 0.20 132 ± 1
Sum* 1.04 ± 0.09 56.8 ± 5.2 21.6 ± 1.6 245 ± 20
Total digestion 1.08 ± 0.04 57.3 ± 0.4 22.9 ± 0.23 241± 7.9
Recovery % 96.3 99.0 94.0 102.1
NIST-2704
Exchangeable and acid soluble 3.25 ± 0.15 17.9 ± 0.7 41.7 ± 1.5 238 ± 2
Reducible 0.495 ± 0.022 3.25 ± 0.20 75.0 ± 2.0 70.9 ± 3.8
Oxidizable 0.142 ± 0.011 31.7 ± 1.5 28.2 ± 1.6 41.8 ± 2.2
Residual —— 43.7 ± 1.8 20.1 ± 1.0 90.4 ± 6.0
Sum* 3.88 ± 0.38 96.6 ± 9.2 165 ± 15 441 ± 44
Certified values 3.45 ± 0.22 98.6 ± 5.0 161 ± 17 438 ± 12
BCR-277
Exchangeable and acid soluble 7.47 ± 0.08 6.15 ± 0.09 1.71 ± 0.02 246 ± 7
Reducible 4.53 ± 0.14 6.27 ± 0.09 13.0 ± 0.2 181 ± 6
Oxidizable 0.664 ± 0.017 57.3 ± 1.8 23.2 ± 1.0 34.8 ± 0.9
Residual —— 21.4 ± 0.2 85.3 ± 0.7 39.5 ± 0.4
Sum* 12.7 ± 0.5 91.1 ± 3.5 123 ± 6 502 ± 26
Certified values 11.9* 102 ± 1.6 146 ± 3 547 ± 12
propagation of errors. The BCR-277 results were obtained from a single-day analysis of 3 sets of samples (n = 15). The overall recovery rates of SED for the 4 elements are in a range of 94 to 102.1% (Table 6). For NIST-2704 and BCR-277 sediments, Table 6, the sum of the analyte concentrations in the extracts were compared with the certified values, applying a paired t-test. The results present no significant difference at the 95% confidence level, which demonstrates that the proposed methodology could be applied to different kinds of sediment samples.
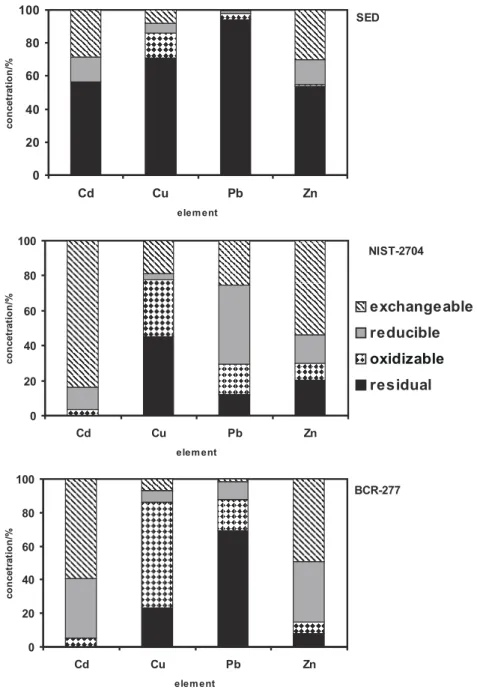
The percentages of each analyte released from the sediment compartments are presented in Figure 1. The greatest part of the analytes in the lake sediment is
Figure 1. Percentage of metals found in different compartments of SED, NIST-2704 and BCR-277 samples
associated with minerals in the crystalline phase (residual phase). The riverine sediment NIST-2704 presented a better distribution of analytes in the different compartments. However, Cd, Cu and Zn distributions in the BCR-277 sediment are similar to those of NIST-2704, with the exception of Pb, of which the bulk is associated with the crystalline phase.
Conclusions
sediment samples. The sum of the amounts extracted in each step was representative of the total amount in the sample.
Despite the necessity of doing a pre-analysis when applying the isotope dilution method, it is less time-consuming compared to external calibration, owing to the need to prepare daily the hydroxylamine chloride standard solution and the use of different standard solutions. Although, both techniques involve previous analysis of the sample, the isotopic dilution procedure is less time-consuming than matrix-matching calibration using an internal standard. The cost per analysis using matrix-matching is dependent on the number of samples, while ID analysis is not.
The reproducibility of in-set variation of the sequential extraction procedure and quantification by ID-ICP-MS were acceptable, with deviations lower than 5%.
The need to employ the ID method was due to the complexity of the matrices produced in the sequential extraction procedure.
References
1. Ure, A.M.; Quevauviller, P.H.; Muntau, H.; Griepink, B.; Int. J. Environ. Anal. Chem.1993, 51, 135.
2. Shan, X.Q.; Bin, C.; Anal. Chem.1993, 65, 802. 3. Kheboian, C.; Bauer, C.F.; Anal. Chem. 1987, 59, 1417. 4. Mann, S.S. and Ritchie, G.S.P.; Aust. J. Soil Res.1993, 31,
255.
5. Chang, A.C.; Page, A.L.; Warneke, J.E.; Grgurevic, E.; J. Environ. Qual.1984,13, 33.
6. Hickey, M.G.; Kittrick, J.A.; J. Environ. Qual.1984, 13, 372.
7. Förstner, U.; Int. J. Environ. Anal. Chem.1993, 51, 5. 8. Wallmann, K.; Kersten, M.; Gruber, J.; Förstner, U.; Int. J.
Environ. Anal. Chem.1993, 51, 187.
9. Griepink, B.; Int. J. Environ. Anal. Chem.1993, 51, 123. 10. Quevauviller, P.H.; Rauret, G.; Muntau, H.; Ure, A.M.;
López-Sánchez, J.F.; Fiedler, H.D.; Griepink, B.; Fresenius’ J. Anal. Chem.1994, 349, 808.
11. Davidson, C.M.; Thomas, R.P.; McVey, S.E.; Perala, R.; Littlejohn, D.; Ure, A.M.; Anal. Chim. Acta1994, 291, 277. 12. Thomas, R.P.; Ure, A.M.; Davidson, C.M.; Littlejohn, D.;
Rauret, G.; Rubio, R.; López-Sanchez, J.F.; Anal. Chim. Acta
1994, 286, 423.
13. Marin, B.; Valladon, M.; Polve, M.; Monaco, A.; Anal. Chim. Acta1997, 342, 91.
14. Tisdell, S.E.; Breslin, V.T.; J. Environ. Qual.1995, 24, 827. 15. Whalley, C.; Grant, A.; Anal. Chim. Acta1994, 291, 287. 16. Li, X.; Coles, B.J.; Ramsey, M.H.; Thornton, I.; Analyst1995,
120, 1415.
17. Hall, G.E.M.; Gauthier, G.; Pelchat, J.C.; Pelchat, P.; Vaive, J.E.; J. Anal. At. Spectrom.1996, 11, 787.
18. Heumann, K.G.; Int. J. Mass Spectrom. Ion Process.1992, 118, 575.
19. Fassett, J.D.; Paulsen, P.J.; Anal. Chem.1989, 61, 643A. 20. De Bièvre, P.J.; Debus, G.H.; Nucl. Instrum. Methods1965,
32, 224.
21. Lopez-Sanchez, J.F.; Rubio, R.; Rauret, G.; Int. J. Environ. Anal. Chem.1993, 51, 113.
Received: July 26, 2001 Published on the web: May 9, 2002