N
o
ta
T
é
c
ni
c
a
*e-mail: [email protected]
PERFORMANCE CHARACTERISTICS OF BIOASSAY UV-SPECTROPHOTOMETRY AND HIGH PERFOMANCE LIQUID CHROMATOGRAPHIC DETERMINATION OF GATIFLOXACIN IN TABLETS
Cristiani Capistrano Gonçalves de Oliveira Lopes* e Hérida Regina Nunes Salgado
Departamento de Fármacos e Medicamentos, Faculdade de Ciências Farmacêuticas, Universidade Estadual Paulista, Rod. Araraquara-Jaú, km 1, 14801-902 Araraquara - SP, Brasil
Recebido em 13/4/07; aceito em 7/3/08; publicado na web em 22/9/08
The microbiological bioassay, UV-spectrophotometry and HPLC methods for assaying gatiloxacin in tablets were compared. Validation parameters such as linearity, precision, accuracy, limit of detection and limit of quantitation were determined. Beer’s law was obeyed in the ranges 4.0-14.0 µg/mL for HPLC and UV-spectrophotometric method, and 4.0-16.0 µg/mL for bioassay. All methods were reliable within acceptable limits for antibiotic pharmaceutical preparations being accurate, precise and reproducible. The bioassay and HPLC are more speciic than UV-spectrophotometric analysis. The application of each method as a routine analysis should be investigated considering cost, simplicity, equipment, solvents, speed, and application to large or small workloads.
Keywords: luoroquinolone; gatiloxacin; pharmaceutical analysis.
INTRODUCTION
Gatiloxacin (Figure 1), a third generation luoroquinolone, is a potent antibacterial agent active against a wide range of Gram-positive and Gram-negative organisms including Mycobacteria.1,2 Chemically gatiloxacin is a (±)-1-cyclopropyl-6-luoro-1,4-dihydro-8-methoxy-7-(3-methyl-1-piperazinyl)-4-oxo-3-quinolinecarboxylic acid sesquihydrated and this luoroquinolone has high oral bioavai-lability (96%), and, therefore, oral and intravenous formulations are bioequivalent and interchangeable.3
Although many chromatographic methods have been reported for the determination of luoroquinolones,4-8 just few methods have been found in the literature for determination of luoroquinolones in phar-maceutical formulations using spectrophotometry9,10 and bioassay.11-14 More speciically, few reports about analytical methods of gatiloxacin in pharmaceutical formulations are available in the literature.15-21 In this paper, the results of three methods is compared with respect to accuracy, precision and speed. They included the bioassay (BA), the spectrophotometric analysis (SPA) and the high performance liquid chromatographic determination (HPLC). The proposed methods were applied to the determination of gatiloxacin in pharmaceutical formulation. No interference was observed in the assay of gatilo-xacin from common excipients in levels found in pharmaceutical
formulation. These methods are validated by the statistical data. The proposed methods are simple and suitable for routine determination of gatiloxacin. The aim of this work was to determine the performance characteristics of these methods considering simplicity, cost, time and sensitivity to quantify gatiloxacin.
EXPERIMENTAL
Material and reagents
The gatiloxacin reference substance (assigned purity 99.99%) were generous gift from Bristol-Myers Squibb (Sao Paulo, Brazil), as well as gatiloxacin tablets. The tablets were claimed to contain 400 mg of drug and excipients. The GATX reference substance, as well as the tablets, was always kept protected from light. Methanol (HPLC grade), acetonitrile (HPLC grade) and acetic acid (analytical grade) were obtained from Merck®. Ultrapure water was obtained from a Milli-Q® Plus apparatus (Millipore®) and was used to prepare all solutions for the HPLC method and bioassay. Distilled water was used to prepare all solutions for the UV method.
Instrumentation and analytical conditions
HPLC analysis as performed on a Varian 2550 chromatograph equipped with a variable-wavelength detector (set at 287 nm) and a spectra physics integrator and Rheodine injection valve with a 20-µL loop. The analytical column was a Phenomenex Luna (250 mm x 4.6 mm i.d., 5 µm particle size) column. The mobile phase used was aqueous 5% acetic acid-methanol-acetonitrile (70:15:15, v/v/v). All analyses were done under isocratic conditions at a low-rate of 1.0 mL/min and at room temperature. The sensitivity was 0.5 AUFS and the chart speed was 0.5 cm/min. The HPLC system was operated at ambient temperature (25 ± 1OC). The mobile phase was iltered by a membrane ilter (Supelco) 0.45 µm x 47 mm and degassed with a helium sparge for 15 min. UV method was performed on a UV–vis spectrophotometer, UV-1601 (Shimadzu®) with the signal at 287.0 nm spectrum and using 1.0 cm quartz cell. The bioassay was perfor-med with antibiotic perfor-media Grove-Randall number 1 and number 11 (Merck), the indicator organism was Bacillus subtilis ATCC 9372 at Figure 1. The chemical structure of gatifloxacin (CAS number
37 oC overnight diluted in nutrient broth 1:50 inoculated to the surface of each plate. Six 8 mm diameter cylinders were used and 200 µL of each sample as added to each cylinder.
Preparation of standard solutions
HPLC method
For the calibration curve, a stock solution of 100 µg/mL was prepared in 100 mL volumetric lask by dissolving 10 mg GATX reference standard in ultrapure water. Appropriate aliquots of the stock solution were diluted with ultrapure water, yielding concentrations of 4.0, 6.0, 8.0, 10.0, 12.0, and 14.0 µg/mL. Triplicate injections of each concentration were performed. The recoveries were determined at four concentration levels, by adding known amounts of reference substance in the beginning of the process. Twenty tablets were weighed to obtain the average tablet weight. The tablets were ground up and 1800.00 mg (representing three times the average weight of each tablet) were transferred to a 500 mL volumetric lask; 250 mL water were added and the lask was shaken for 20 min by a mechanical shaker, followed by addition of ultrapure water to volume. Aliquots of 1 mL of this solution were transferred to a 100 mL volumetric lask followed by making up to volume with water to give a stock solution with concentration 240 µg/mL. Portions of 1.0 mL of this stock solution were transferred to 25 mL volumetric lasks where 0.1, 0.2, 0.4 and 0.6 mL of GATX reference solution (100 µg/mL), equivalent to 10.0, 10.4, 11.2 and 12.0 µg/mL of GATX, were added. After this procedure, dilutions were made with water to give inal concentrations of 104.1, 108.3, 116.6 and 125.0%, respectively, of the sample concentrations used in the assay.
UV method
For the calibration curve, solutions of gatiloxacin powder in water (100 µg/mL) were prepared by accurately weighing 10 mg of gatiloxacin to a 100 mL volumetric lask, adding 50 mL water and shaken for 20 min in ultrasonic bath, followed by adding distilled water to make up the volume. The gatiloxacin standard solution was diluted in 100 mL volumetric lasks with distilled water to give a range of solutions with inal concentrations of 4 to 14 µg/mL. The absorbance value of each solution was performed at 287 nm. For the recoveries were determined by adding known amounts of gatiloxa-cin reference substances (2.0, 4.0 and 6.0 µg/mL) to the samples at beginning of the process. A recovery exercise was then performed.
Bioassay
The standard solution in water (100 µg/mL) was diluted in potassium phosphate buffer pH 6.0 and assayed at concentrations of 4.0, 8.0 and 16.0 µg/mL. The bioassay plates were incubated at measured with calipers. A standard curve was prepared by measuring the zone diameters of three concentrations (4.0; 8.0 and 16.0 µg/mL) of Gatiloxacin. Accuracy was determined by adding known amounts of GATX reference substance to the samples at the beginning of the process. Accurately weighted amounts of tablets equivalent of 10 mg GATX were placed in three 100 mL volumetric lask. 0.5, 1.0 and 1.5 mL of Gatiloxacin reference solution (100 µg/mL) were added. Water (50 mL) was added and the lasks were shaken for 10 min. This was followed by making up to volume with water. The dilutions were made in potassium phosphate buffer, pH 6.0, to give a inal concentration of 105.0, 110.0 and 115.0%, respectively. The solutions were applied the cylinder plate assay described above. The percentage recovery of GATX reference added was calculated using the formula proposed by the AOAC.22
Preparation of sample solutions
Bioassay
An amount of powder equivalent to 10 mg of gatiloxacin was transferred to a 100 mL volumetric lask with 50 mL water and shaken for 10 min. This was followed by making up to volume with water. The dilutions were made with potassium phosphate buffer pH 6.0 to give a inal concentration of 4.0, 8.0 and 16.0 µg/mL.
Spectrophotometric analysis
To analyze the concentration of gatiloxacin in tablets, each tablet was weighed to obtain the average tablet weight. The tablets were ground up and 1800.00 mg (representing three times the average weight of each tablet) were transferred to a 1000 mL volumetric lask; 500 mL water were added and shaken for 20 min in ultrasonic bath, followed by adding distilled water to make up the volume. Aliquots of 5 mL of this solution were transferred to 100 mL volumetric lask and distilled water added to volume to give an estimated concentration of 60 µg/ mL. An aliquot of the 10 mL of this solution was transferred to a 100 mL volumetric lask and water added to make up the volume in order to give a inal concentration of 6 µg/mL. This solution as prepared six times and the absorbance of each determined at 287 nm.
HPLC
To analyze the concentration of gatiloxacin in tablets, twenty tablets were weighed to get the average tablet weight the samples of the powdered tablets. A quantity of the powdered tablets containing 1200.0 mg of GATX was transferred to 500 mL volumetric lask with 250 mL water and shaken for 20 min in ultrasonic bath, followed by adding water to make up the volume. This sample solution had a concentration of 2400 µg/mL. Aliquots of 10 mL of this solution was transferred to a 200 mL volumetric lask and water added to make up the volume (concentration of 120 µg/mL). An aliquot of the 5 mL of this solution was transferred to a 50 mL volumetric lask and water added to make up the volume in order to give a inal concentration of 12 µg/mL. The solution was homogenized and iltered. All deter-minations were conducted in triplicate.
Method validation
The methods were validated according to the International Con-ference on Harmonization24 and AOAC International22 guidelines for validation of analytical methods. Tests F were used to compare the proposed methods.
Linearity
The calibration curve was obtained at six concentrations levels of GATX solutions (4.0–14.0 µg/mL for HPLC and UV method). For bioassay, the calibration curve was obtained at three concentrations levels (4.0 – 16.0 µg/mL). The linearity was evaluated by the least square regression method with triplicate determinations at each concentration level.
Precision
of the assay method was evaluated by carrying out six independent assays of gatiloxacin test sample against a qualiied reference stan-dard and calculated the % R.S.D. of assay.
Accuracy
The recoveries were determined by adding known amounts of gatiloxacin reference substances to the samples at the beginning of the process.23 A recovery exercise was then performed.
Detection Limit (LOD) and Quantification Limit (LOQ)
The LOD and LOQ of gatiloxacin by the proposed methods were determined using calibration standards. LOD and LOQ were calculated as 3.3 σ/S and 10 σ/S, respectively, where S is the slope of the calibration curve and σis the standard deviation of y-intercept of regression equation (n = 9).
RESULTS AND DISCUSSION
HPLC method
The development of the HPLC method for the determination of drugs has received considerable attention in recent years because of their importance in routine quality control analysis. A reversed- phase HPLC method was proposed as a suitable method for the estimation of gatiloxacin in pharmaceutical dosage form. The chromatographic conditions were adjusted in order to provide a good performance of the assay. Figure 2 shows a typical chromatogram obtained from the analysis of a standard and sample solution of gatiloxacin using the proposed method. As shown in this igure, GATX was eluted forming symmetrical peak, well separated from the solvent front. The retention time observed (5 min) allows a rapid determination of the drug, which is important for routine analysis. The calibration curves for
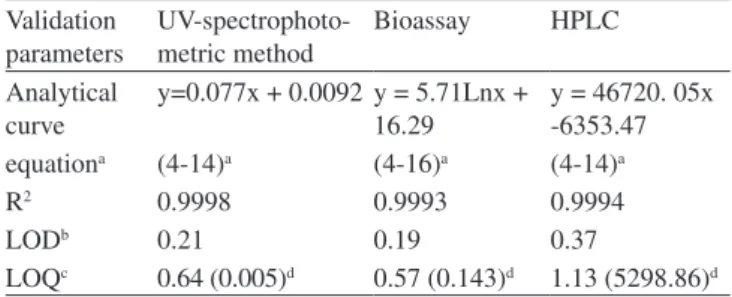
gatiloxa-cin were constructed by plotting concentration versus peak area and showed good linearity over the concentration range from 4 to 14 µg/ mL (r2 = 0.9994). The method limits of detection and quantiication were 0.37 and 1.13 µg/mL, respectively (Table 1).
The validity of the assay was veriied by means of the ANOVA. According to ANOVA (Table 2) there is linear regression (Fcalculated >/Fcritical; P = 0.05) and there is no deviation from linearity (Fcalculated < /Fcritical; P = 0.05). The precision of the method was determined by repeatability (intra-day) and intermediate precision (inter-day) and was expressed as R.S.D. (%) of a series of measurement. The experimental values obtained for the determination of gatiloxacin in samples are present in Table 3. The result obtained shows R.S.D. of 0.98 to 1.48% indicating good intra-day precision. Inter-day variability was calculated from assays on 3 days and shows a mean R.S.D. of 1.56%. The accuracy of the method was determined and the mean recovery was found to be 100.17% (Table 4) indicating an agreement between the true value and the value found.
UV method
The proposed UV method allows a rapid and economical quantitation of gatiloxacin in powder for injection without any time-consuming sample preparation. Moreover, the spectrophoto-metric methods involve simple instrumentation compared with other instrumental techniques. The absorption spectrum of gatiloxacin in aqueous solution is shown in Figure 3. The λmax was found to be 287 nm. This wavelength was used for all measurements. For more accurate analysis, Ringbom curve was constructed and the linear range was observed. The range of calibration curves were constructed from 4 to 14 µg/mL The results showed good linearity over this con-centration range with a correlation of 0.9998 (Table 1). The method limits of detection and quantiication were 0.21 and 0.64 µg/mL, respectively. According to ANOVA (Table 2) there is linear regression
Table 1. Validation parameters of gatiloxacin in tablets
Validation parameters
UV-spectrophoto-metric method
Bioassay HPLC
Analytical curve
y=0.077x + 0.0092 y = 5.71Lnx + 16.29
y = 46720. 05x -6353.47
equationa (4-14)a (4-16)a (4-14)a
R2 0.9998 0.9993 0.9994
LODb 0.21 0.19 0.37
LOQc 0.64 (0.005)d 0.57 (0.143)d 1.13 (5298.86)d arange of concentration; bs/n = 3; cs/n= 10; dstandard error of mean, n = 3
Figure 2. HPLC chromatograms of gatifloxacin reference substance (A) and gatifloxacin tablets (B). Chromatographic conditions: column C18 (250 mm x 4.6 mm i.d., 5 µm particle size), mobile phase: 5% acetic acid-methanol-acetonitrile (70:15:15, v/v/v), flow rate:1.0 mL/min, detection wavelength:
(Fcalculated >/Fcritical; P= 0.05) and there is no deviation from linearity (Fcalculate d< /Fcritical; P= 0.05). Table 3 shows the experimental values obtained for the determination of gatiloxacin in samples, indicating a satisfactory intra-day variability (R.S.D. of 0.11-1.26%) and inter-day variability (R.S.D. of 1.32%) A good accuracy of the method was veriied with a mean recovery of 98.60% (Table 4).
Bioassay
In this work experimental 3×3 design using three dose levels for each standard and sample were used following the procedure described in Brazilian and European Pharmacopoeias.26,27 The calculation pro-cedure normally assumes a direct relationship between the observed zone diameter and logarithm of applied dose. The calibration curve for gatiloxacin was constructed by plotting log of concentrations (µg/ mL) versus zone diameter (mm) and showed good linearity on the 4-16 µg/mL range. The coeficient of regression was r=0.9993. The experimental values obtained for the determination of gatiloxacin in samples are present in Table 1. According Brazilian, European, and British Pharmacopoeias,26-28 if a parallel-line model is chosen, the two log dose-response lines of the preparation to be examined and the reference preparation must be parallel and they must be linear over the range of doses used in the calculation. These conditions must be veriied by validity tests for a given probability, usually P = 0.05. The assays were validated by means of the analysis of variance, as
descri-Table 3. Percentual amount of gatiloxacin in tablets by three
di-fferent methods
Method Theoretical
amountb (mg)
Experimental amounta (mg) ± RSD (%) intra-day
Purity (%)
R.S.D.(%) Inter-day
Bioassay 400 397.84 ± 0.45 99.46
402.88 ± 0.28 100.72 0.87 404.56 ± 0.44 101.14
Spectropho-tometric 400 392.49 ± 1.26 98.12
393.80 ± 0.11 98.45 1.32
402.17 ± 0.89 100.54
HPLC (%) 400 396.04 ± 1.48 99.01
403.64 ± 0.99 100.91 1.56 408.52 ± 0.98 102.13
a Mean of six replicate analysis. b Theoretical amount: 400 mg per tablet. R.S.D. = relative standard deviation
Table 4. Recovery data of standard solutions added to the samples
analyzed by using the proposed HPLC, bioassay and UV-spectrometry method
Sample Added amount
(mg/mL)
Found amount (mg/mL)
Recoverya (%) ± R.S.D.
Bioassay 0.5 0.48 100.20 ± 0.26
1.0 0.96 97.60 ± 0.65
1.5 1.48 100.13 ± 1.0
UV- 2.0 2.02 101.65 ± 0.19
spectrometry 4.0 3.97 100.05 ± 0.43
6.0 5.91 100.74 ± 0.52
HPLC 0.4 0.39 99.47 ± 0.41
0.8 0.78 97.50 ± 0.29
1.6 1.67 104.79 ± 0.45
2.4 2.37 98.94 ± 0.37
a Mean of three replicate analysis. R.S.D. = relative standard devia-tion
Table 2. Statistical results of linear regression analysis in the determination of gatiloxacin by proposed spectrophotometric method, bioassay
and HPLC
Statistical parameters UV-spectrophotometric method Bioassay HPLC
Regression analysis
Slope (S.E.a) 0.077 (5.26x10⁻⁴) 2.4814 (0.066) 46720.05 (550.45)
95% conidence limits of slope 0.076-0.079 1.63-3.32 45191.98-48248.15
Intercept (S.E.a) 0.0092(0.005) 16.297 (0.143) -6353.47 (5298.86)
95% conidence limits of intercept -0.005-0.023 14.47-18.12 -21063.68-8356.06
Analysis of variance
Linear regressionb 16600.14 (4.75) 6679.94 (4.24) 14260.64 (4.75)
Linearity deviationc 1.87 (3.26) 0.93 (4.24) 1.69 (3.26)
a Standard error of mean. bTheoretical value of F is based on one-way ANOVA test at P = 0.05 level of signiicance. cValues in parentheses are the corresponding critical values for F at P = 0.05
bed in these oficial codes. There are no deviation from parallelism and linearity with results obtained here (P = 0.05). Table 3 shows the experimental values obtained for the determination of gatiloxacin in samples, indicating a satisfactory intra-day variability (R.S.D. of 0.28 - 0.45%) and inter-day variability (R.S.D. of 0.87%). A good accuracy of the method was veriied with a mean recovery of 99.31% (Table 4). The quantiication of antibiotic components by chemical methods such as HPLC and UV spectrophotometry, although precise, cannot provide a true indication of biological activity. Attempts to correlate antibio-tic bioassay results with those from chemical methods have proved disappointing. Therefore, bioassays continue to play an essential role in manufacturing and quality control of antibiotic medicines, and still demand considerable skill and expertise to assure success.29
Although the biological assays have a high variability, the analysis of the obtained results could demonstrate that the proposed method is very useful to the determination of this drug in pharmaceutical dosage forms.
Analysis of variance of analytical methods
We had developed three methods of analysis of gatiloxacin both raw material and tablets.15-17 All methods showed good linearity (r2 > 0.9993) in the concentrations of 4 –16 µg/mL. Repeatability, intra-day and inter-intra-day variability were evaluated for the precision of the methods (Table 3). This paper compared these methods on the basis of precision, accuracy, repeatability, cost and ease of handling. All proposed methods yielded coeficients of variation less than 2%. These results can indicate a good precision.25
The reported methods for the determination of gatiloxacin in pharmaceutical forms give accurate and precise results. It is evident that HPLC was the most expensive method. This procedure requires specialized equipment and expensive solvents as well. The spectro-photometric analysis also requires specialized equipment but cost of spectrophotometer is less than an HPLC apparatus. The bioassay is clearly the least expensive method studied, and requires no specialized equipment. Ease of handling, as measured by technician time required for performance of a single assay can be another determination factor to select a laboratory routine method. However, bioassay is limited by incubation and counting time resulting 20 h. Spectrophotometry and HPLC both provide results in 2 h.
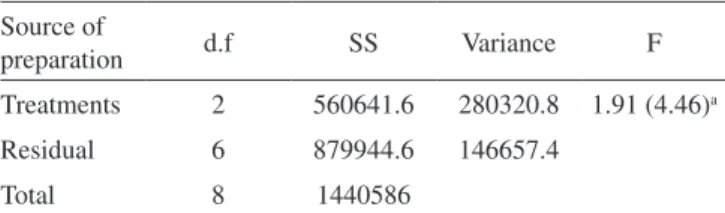
The data obtained by bioassay, spectrophotometric analysis and HPLC were statistically comparable by ANOVA test. The mean percent levels determined by the method proposed did not differ signiicantly at the P < 0.05. On the other hand, HPLC technique can show interfering peaks and bioassay can quantify antibacterial activity. Our study leads to conclude that the bioassay and HPLC have clearly displayed advantages. The application of each method as a routine analysis should be investigated considering cost, sim-plicity, equipment, solvents, speed, and application to large or small workloads.
ACKNOWLEDGEMENTS
The authors thank the Brystol-Myers Squibb (São Paulo, Brazil) for providing gatiloxacin reference substance and gatiloxacin tablets and Prof. M. L. de Menezes (UNESP, Bauru, SP, Brazil) for providing HPLC equipment. This work was supported by PACD-FCFAr-UNESP and CNPq. C. C. G. O. Lopes was funded by CAPES and H. R. N. Salgado was funded by CNPq.
Table 5. Analysis of variance of the different method to quantify gatiloxacin in dosage forms
Source of
preparation d.f SS Variance F
Treatments 2 560641.6 280320.8 1.91 (4.46)a
Residual 6 879944.6 146657.4
Total 8 1440586
*P, 0.05. aTheoretical value of F is based on one-way ANOVA test at P = 0.05 level of signiicance.
REFERENCES
1. Dong, Y.; Xu, C.; Zhao, X.; Domagala, J.; Drlica, K.; Antimicrob. Agents Chemother. 1998, 42, 2978.
2. Jones, R. N.; Pfaller, M. A.; Diagn. Microbiol. Infect. Dis.1998, 31, 379.
3. Grasela, D. M.; Clin. Infect. Dis. 2000, 31(suppl. 2), 51.
4. Souza, M. J.; Bittencourt, C. F.; Morsch, L.M.; J. Pharm. Biomed. Anal.
2002, 28, 1195.
5. Marona, H. R. N.; Schapoval, E. E. S.; J. Pharm. Biomed. Anal. 1999, 20, 413.
6. Santoro, M. I. R. M.; Kassab, N. M.; Singh, A. K.; Kedor-Hackmann, E. R. M.;J. Pharm. Biomed. Anal. 2006, 40, 179.
7. Tozo, G. C. G.; Salgado, H. R. N.; J. AOAC Int. 2006,89, 1305. 8. Belal, F.; Al-Majed, A. A.; Al-Obaid, A. M.;Talanta1999, 50, 765. 9. Gomes, G. C.;Salgado, H. R. N.; Acta Farm. Bonaerense2005, 24,
406.
10. Marona, H. R. N.; Schapoval, E. E. S.; J. Pharm. Biomed. Anal.2001, 26, 501.
11. Marona, H. R. N.; Schapoval, E. E. S.; Información Tecnológica1998, 9, 251.
12. Ev, L. S.; Schapoval, E. E. S.; J. Pharm. Biomed. Anal.2002, 27, 91. 13. Souza, M. J.; Bittencourt, C. F.; Souza Filho, P. S.;Int. J. Pharm. 2004,
271, 287.
14. Gomes, G. C.; Salgado, H. R. N.; J. AOAC Int. 2006, 89,1077. 15. Salgado, H. R. N.; Lopes, C. C. G. O.; Pharmazie 2005, 60, 263. 16. Salgado, H. R. N.; Lopes C. C. G. O.; Lucchesi, M. B. B.; J. Pharm.
Biomed. Anal.2006a, 40, 443.
17. Salgado, H. R. N.; Lopes, C. C. G. O.; J AOAC Int. 2006b, 89,642. 18. Marona, H. R. N.; Oliveira, C. C. L. G.; Cardoso, S. G.; Acta Farm.
Bonaerense 2003, 22, 339.
19. Venugopal, K.; Saha, R. N.; Il Farmaco2005, 60, 906.
20. Amin, A. S.; Goudab, A. A. E-F.; El-Sheikh, R.; Zahran, F.; Spectrochim. Acta Part A2007, 67, 1306.
21. Suhagia, B. N.; Shah, S. A.; Rathod, I. S.; Patel, H. M.; Shah, D. R.; Marolia, B. P.; Anal. Sci. 2006, 22, 743.
22. AOAC (1990) Association of Official Analytical Chemists, Official Methods of Analysis, 15th ed., p.xvii. Arlington, VA, November 1995,
Geneva, Switzerland.
23. ICH Steering Committee (1996) International Conference on Harmo-23. ICH Steering Committee (1996) International Conference on Harmo- ICH Steering Committee (1996) International Conference on Harmo-ICH Steering Committee (1996) International Conference on Harmo-nization of Technical Requirements for Registration of Pharmaceutical for Human Use, Validation of Analytical Procedures: Methodology, 6 November 1995, Geneva, Switzerland.
24. ICH, Validation of Analytical Procedures; Methodology. Harmonized tripartite Guideline, 1996.
25. The United States Pharmacopeia, 28th ed., United States Pharmacopoeial
Convention: Rockville, 2005.
26. Farmacopéia Brasileira, 4a ed., Atheneu: São Paulo, 1988.
27. European Pharmacopoeia, 3a ed., 1997.
28. British Pharmacopoeia, Her Majesty’s Stationery Ofice: London, 2004.