Article
J. Braz. Chem. Soc., Vol. 25, No. 1, 143-151, 2014. Printed in Brazil - ©2014 Sociedade Brasileira de Química 0103 - 5053 $6.00+0.00
A
*e-mail: [email protected]
An Easy and Fast Procedure for the Determination of Ca, Cu, Fe, Mn, Mg, Na, K and Si
in Biodiesel by ICP OES Using Emulsification as Sample Preparation Strategy
Meibel T. Lisboa,a Caroline D. Clasen,a Daiane C. de Sousa Vellar,a Eliézer Q. Oreste,a
Tatiana D. Saint’Pierre,b Anderson S. Ribeiroa and Mariana A. Vieira*,a
aCentro de Ciências Químicas, Farmacêuticas e Alimentos,
Programa de Pós-Graduação em Química, Laboratório de Metrologia Química, Universidade Federal de Pelotas, 96010-900 Capão do Leão-RS, Brazil
bPontifícia Universidade Católica do Rio de Janeiro (PUC-Rio),
Departamento de Química, 22451-900 Rio de Janeiro-RJ, Brazil
Apresenta-se um procedimento alternativo para o preparo das amostras de biodiesel para a determinação elementar por espectrometria de emissão óptica com plasma indutivamente acoplado (ICP OES), baseado na formação de emulsão da amostra (10% m/v) com ácido fórmico (15% v/v) e Triton X-100 (0,1% m/v). Estas concentrações foram otimizadas e os padrões e amostras emulsionados mostraram-se estáveis por pelo menos 3 h. As condições experimentais (1500 W de potência da radiofrequência e 0,5 L min-1 de vazão do Ar nebulizador) foram otimizadas a partir das
recomendadas pelo fabricante do equipamento, com uma solução contendo 10 mg L-1 de todos os
analitos, preparada com óleo base nas mesmas condições da emulsão. Os efeitos de matriz foram investigados, observando as inclinações das curvas de adição de analito para diferentes amostras de biodiesel. Os resultados mostraram que a calibração externa com soluções contendo padrões inorgânicos emulsionados pode ser utilizada. Os limites de detecção encontrados (em mg kg-1)
foram 0,121; 0,008; 0,006; 0,001; 0,006; 0,071; 0,241 e 0,024 para Ca, Cu, Fe, Mn, Mg, Na, K e Si, respectivamente. A exatidão do procedimento para o Ca, Mg, K e Na foi avaliada por meio da análise de um padrão multielementar de biodiesel B100 (Conostan) e as recuperações variaram entre 91 a 107%. O procedimento proposto usa reagentes com baixa toxicidade e mostrou ser uma alternativa simples e direta de preparação de amostras para determinação de metais em biodiesel por ICP OES com limites de detecção adequados para essas análises.
It is presented an alternative procedure for preparation of biodiesel samples for elemental determination by inductively coupled plasma optical emission spectrometry (ICP OES), based on the sample (10% m/v) emulsion formation with formic acid (15% v/v) and Triton X-100 (0.1% m/v). These concentrations were optimized and the stability of emulsified aqueous standards and samples was found to be of at least 3 h. Experimental conditions (1500 W of RF power and 0.5 L min-1 of Ar nebulizer flow rate) were optimized from those recommended by the equipment
manufacturer, with a solution containing 10 mg L-1 of each analyte prepared with mineral oil in
the same conditions of the emulsion. Matrix effects were investigated by observing the slopes of analyte addition curves for different biodiesel samples. Results showed that external calibration with inorganic aqueous standard solutions in the emulsion medium should be used. Limits of detection obtained (in mg kg-1) were 0.121, 0.008, 0.006, 0.001, 0.006, 0.071, 0.241 and 0.024
for Ca, Cu, Fe, Mn, Mg, Na, K and Si, respectively. The accuracy of the procedure for Ca, Mg, K and Na was assessed by the analysis of a multi-element standards B100 biodiesel (Conostan) and the recoveries ranged from 91 to 107%. The proposed procedure used low toxicity reagents and showed to be a simple and straightforward alternative of sample preparation for metal determination in biodiesel by ICP OES with limits of detection adequate for those analyses.
Introduction
Biodiesel is considered non-toxic, biodegradable and ecologically advantageous due to its renewable sources, when compared to fossil fuels. For these reasons, blended biodiesel has been increasingly employed into diesel oil in many countries and regulatory norms have been established for its characterization and quality evaluation.1-3 Concerning
elements that have a limited concentration in biodiesel, alkaline (Na + K) and earth alkaline metals (Ca + Mg) as well as non-metals (P and S) are contaminants that can affect the emission quality and motor performance.1,4 The
current specifications for biodiesel imposed by the Brazilian Fuel Agency (ANP) defines a limit of 5 mg kg-1 as the
maximum allowed concentration for Na + K or Ca + Mg and 10 mg kg-1 for P and S.5
These elements can be originated from the raw material or incorporated during the production process. Alkaline metals can remain in the biodiesel due to no proper washing out of the catalysts from the final product, causing corrosion in the engine above certain levels. Earth alkaline, mainly Ca and Mg, may be present in biodiesel due to the use of hard water in the washing process necessary to clean the final product from byproducts such as glycerin. Non-metals can be originated from the raw material (P from the phospholipids present in the oil) or from the process (S from sulfuric acid used for neutralize the excess of catalysts).1,2 Others metals such Cu, Pb, Cd
and Zn may catalyze oxidation in contact with biodiesel, thereby creating residues (sediments) at the motor and also may be a pollution source.4
For the determination of contaminants Na, K, Mg, K and P in biodiesel, European,6-8 American9 and Brazilian10,11 norms
recommend sample dilution with organic solvent, xylene or kerosene, and external calibration with organometallic standards in base oil dissolved in the same solvent as for the samples, after viscosity adjustment of the calibration solutions with a mineral oil. The instrumental determination can be performed by atomic spectrometry techniques, such as inductively coupled plasma optical emission spectrometry (ICP OES)10 or flame atomic absorption spectrometry
(F AAS).11 Despite the calibration curves are prepared with
organometallic standards, matching the response of the analyte in the sample compared to the calibration solutions can be questionable due to the presence of different species. Moreover, special care is necessary for handling, working and storing organic solvents due their toxicity, corrosiveness, volatility, and inflammability.12
Alternative procedures for the determination of trace elements in biodiesel by atomic spectrometric techniques were reviewed by Lepri et al..4 In Brazil, several research
groups have focused on the development of these procedures using different sample preparation methods such as acid digestion, formation of microemulsions to improve the sensitivity and limits of detection for the analytes of interest in biodiesel.13-27
The emulsion formation is a simple procedure, since it does not require the use of organic solvents or the destruction of the sample matrix and offers additional advantages, such as the use of aqueous inorganic standards for the preparation of the calibration curves, analyte stability for several days, and lower cost of analysis. Also, when the emulsified sample is properly stabilized, it is compatible with most analytical instrumentation and any potential loss of analytes due to volatilization or precipitation during sample processing is eliminated. The emulsion can be classified according to its formulation and to the oil/water ratio. In oil-in-water (o/w) emulsions, the oil phase (biodiesel) is dispersed into the aqueous phase as micro droplets stabilized by micelles or vesicles generated by the addition of a detergent.28-30 In case of elemental analysis,
the addition of an acid (nitric acid is the most employed) to the emulsion is also important to extract and stabilize the analytes in the aqueous phase. In the literature, there are several methods using emulsion formation for vegetable oils. However, for the determination of metals in biodiesel samples, most found methods employ microemulsion with short chain alcohols (n-propanol or n-butanol) and a surfactant, mostly Triton X-100.14-25 A studied published
by Aranda et al.31 employed emulsions with nitric acid and
Triton X-100 for biodiesel samples, but in this case it was applied for the determination of total and inorganic Hg by flow injection cold vapor atomic fluorescence spectrometry (FI-CV-AFS).
Formic acid has been widely used as an alternative acid, especially for the dissolution of biological tissues, wherein the analytes are released to the aqueous phase before determination, besides it is easy to obtain, presents low toxicity and it is safer to be used when compared with organic solvents. It is miscible with water, somewhat soluble in hydrocarbons and makes hydrogen bonds. Certainly, these characteristics are important for the emulsion formation with biodiesel sample, since the analytes can be extracted without the needing of destroying the organic matrix.In addition, it can be used in polypropylene flasks, and, in most cases, it does not require external energy for the dissolution of the samples.32-33 When compared to
In this context, the present work proposes an alternative sample treatment based on the emulsion formation with formic acid and Triton X-100 for the determination of Ca, Cu, Fe, Mn, Mg, Na, K, and Si in biodiesel samples by ICP OES. The proposed method is easy and simple to perform, avoids the use of organic solvents, and it is an alternative to the procedures based on the dilution with xylene or microemulsion with alcohols.
Experimental
Instrumentation
For this study, the inductively coupled plasma optical emission spectrometer Optima 4300 DV (PerkinElmer, Norwall, CT, USA) was employed. Different flow rates of 99.9996% argon (Linde, Rio de Janeiro, Brazil) were used. The operational conditions were initially adjusted as those recommended by the equipment manufacturer for organic solutions (1300 W RF power and 0.5 L min-1 nebulizer
Ar), since the emulsion has a high organic content, which was expected to require high energy for dissociation in the plasma. A fast optimization with a solution containing 10 mg L-1 of all analytes prepared with mineral oil in the same
conditions as the sample emulsion showed that higher robustness of the plasma was obtained with higher RF power. Table 1 shows the optimized operational conditions and the analytical lines employed in this work. For sample introduction, a concentric pneumatic nebulizer (Meinhard TR-30-K3, 36 psi) was employed coupled to a 50 mL glass cyclonic spray chamber (both from Glass Expansion, West Melbourne Vic, AU) and a 2.0 mm inner diameter injector. For the introduction of samples diluted in xylene, a Meinhard K-type nebulizer coupled to a Twister spray chamber for organics (also Glass Expansion) and a 1.8 mm injector were employed. Oxygen 99.96% (Linde, Rio de Janeiro, Brazil) was introduced in the nebulizer flow and adjusted to not be observed the typical carbon green emission. In this case, the operational conditions have been previously optimized in our lab and are also shown in Table 1. A peristaltic pump was used to feed the nebulization system with the solutions. All samples were weighed using an Ohaus Adventurer analytical balance (Model AR 2140, Pine Brook, NJ, USA) with a precision of 0.1 mg.
Materials and Reagents
All reagents were of analytical grade. All solutions were prepared using high-purity water with a minimum resistivity of 18.3 MΩ cm, obtained from a Direct-Q 3 Water Purification System (Millipore Corporation,
Bedford, MA, USA). Multi-element working standard solutions were prepared by appropriate dilution of the stock ICP multi-element standard IV (Merck, Darmstadt, Germany) 1000 mg L-1 of Ca, Cu, Fe, Mn, Mg, Na, K and
Si in 0.2% (v/v) HNO3. A 1000 mg L
-1 yttrium solution
(Merck) was used for the internal standard. Also, a multi-elemental organometallic standard solution (Conostan S21+ K, Champlain, NY, USA) with analyte concentration of 885 µg g-1 was used. For sample preparation, formic
acid 95% (v/v), Triton X-100 (both from Sigma-Aldrich, Germany), mineral oil (viscosity ranging from 10.8 to 13.6 mm2 s-1 and specific mass of 0.856 g mL-1 (Vetec,
Rio de Janeiro, Brazil) and antifoam A (Fluka, Buchs, Germany) were used. Xylene (Vetec, Rio de Janeiro, Brazil) was employed for the direct introduction of samples.
Samples
For the emulsions preparation, biodiesel samples from different raw materials (soybean, algae and castor oils) were analyzed. Biodiesel from soybean and castor oils are already well-studied concerning performance and are commonly employed in Brazil blended to diesel oil, while the production and performance of biodiesel from algae are still being studied. A biodiesel plant located in Southern Brazil provided the samples. The accuracy of the developed method was evaluated by the analysis of multi-element standards for Ca, K, Mg, Na and P in B100 Biodiesel (Conostan B-100, SCP Science, Canada) containing 20 mg kg-1 of these analytes.
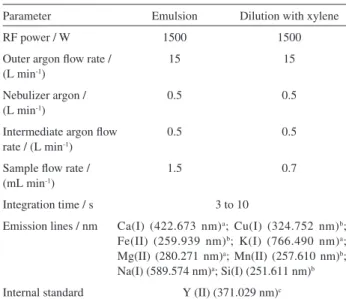
Table 1. Instrumental parameters for determinations by ICP OES
Parameter Emulsion Dilution with xylene
RF power / W 1500 1500
Outer argon flow rate / (L min-1)
15 15
Nebulizer argon / (L min-1)
0.5 0.5
Intermediate argon flow rate / (L min-1)
0.5 0.5
Sample flow rate / (mL min-1)
1.5 0.7
Integration time / s 3 to 10
Emission lines / nm Ca(I) (422.673 nm)a; Cu(I) (324.752 nm)b;
Fe(II) (259.939 nm)b; K(I) (766.490 nm)a;
Mg(II) (280.271 nm)a; Mn(II) (257.610 nm)b;
Na(I) (589.574 nm)a; Si(I) (251.611 nm)b
Internal standard Y (II) (371.029 nm)c
Atomic line (I); ionic line (II). aradial mode; baxial mode cY was measured
Emulsion preparation
Emulsions were prepared in a 10 mL polyethylene flask by mixing approximately 1.0 g of the biodiesel sample with 1.5 mL of formic acid and 1.0 mL of Triton X-100 1.0% (m/v). Antifoam (2-3 droplets) was also added in order to avoid foam during the analysis. The volume was filled up to 10 mL with deionized water. Before the analysis, the emulsions were shaken vigorously. Blanks and calibration solutions were prepared similarly to the sample emulsion, but using 1 g of mineral oil to match for the samples viscosity, with 15% (v/v) formic acid and 0.1% (m/v) Triton X-100. Appropriate amounts of the multi-element inorganic standard were added to the calibration solutions. For all samples and calibration solutions, yttrium was used as internal standard at the final concentration of 0.2 mg L-1.
Results and Discussion
Emulsion composition optimization
In order to choose the ideal composition of the emulsion, as well as the compatibility of reagents with the plasma, the concentration of formic acid and Triton X-100 were evaluated. The blank solution for each reagent (formic acid or Triton X-100) was analyzed individually and the intensity values were low, indicating no contamination with the analytes.
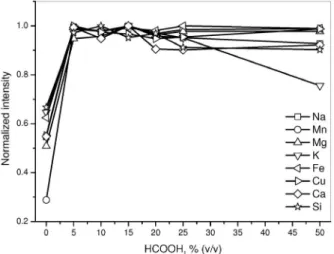
The effect of the formic acid concentration on the signal intensity (Figure 1) was evaluated in the range of 0.0 to 50% (v/v) using a calibration solution containing 1.0 mg L-1 of the
analytes and prepared as emulsion with 1 g of mineral oil and 0.1% (m/v) Triton X-100. The mineral oil was used for matching the viscosity with those of the sample solutions.34
In accordance to the results displayed in Figure 1, a similar
behavior for all analytes was observed from 5% to about 20% (v/v) of formic acid. After, a slight decrease in the signal was observed for Ca, Cu and Si. In order to determine all analytes simultaneously using the same concentration of formic acid, the concentration of 15% (v/v) was chosen, that is, 1.5 mL of formic acid was employed for the preparation of 10 mL of the emulsion in presence of Triton X-100 and mineral oil. Formic acid has a Ka of 1.6 × 10
-4. At the concentration chosen
for the work (15% v/v), the calculated ionization coefficient was 0.65% and the ionic strength was 0.025 mol L-1. Thus,
we believe that this high concentration of formic acid was necessary to provide the ionic strength necessary to maintain the stability of the micelles along the analysis time.
The surfactant Triton X-100 was used in the emulsion preparation, in order to make easier the dispersion between the water and the oil phase, increasing the micelles’ stability and, consequently, the precision of the results. Initially, 3 or 4 droplets of Triton X-100 were added to each 1.5 mL of formic acid. However, we observed a high blank signal for Na. Then, a solution of 1.0% (m/v) of Triton X-100 in water was prepared and the effect of the emulsifier concentration was tested in the range of 0.01 to 0.5% (m/v) for a solution containing 1 mg L-1 of each analyte, 15%
(v/v) of formic acid and 1.0 g of mineral oil. In this way, a lower blank signal for Na was obtained. As can be observed in Figure 2, the analytes signals trend to increase up to the concentration of 0.10% (m/v) Triton X-100, remaining constant for higher concentrations. Thus, this emulsifier concentration was used as optimum for further experiments.
The optimum concentrations of formic acid and Triton X-100 for the system based on oil-in-water (o/w) emulsion formation did not cause any instability in the plasma because of the high power and low sample flow rate, which increase the robustness of the plasma, do not requiring the addition of oxygen to decompose the organic compounds
Figure 2. Effect of Triton X-100 concentration on the analytes’ signal intensity (1 mg L-1). Formic acid: 15% (v/v).
in the plasma. The background emission was evaluated with a solution containing 15% (v/v) formic acid and with the correction by the instrument software. This amount of formic acid did not increase the background and no carbon deposition was observed in the injector.
An important part of a routine procedure is that the analytes in the sample and calibration solutions (or emulsions) remained stable for at least a few hours so that the analysis could be carried out without signal loss. Several papers have shown that organic solutions containing trace metals may suffer from losses just a few minutes after preparation.4,28 Thus, the stability of the analytes in the
emulsified medium was evaluated along a period of 4 h in the biodiesel emulsion, after its enrichment with 1.0 mg L-1
of analytes. Results demonstrated that the analytes were stable in the emulsified medium for 3 h, just needing a slight shaking prior to analysis. Thus, in order to get accurate results, the samples should be analyzed within this period, after the emulsion preparation.
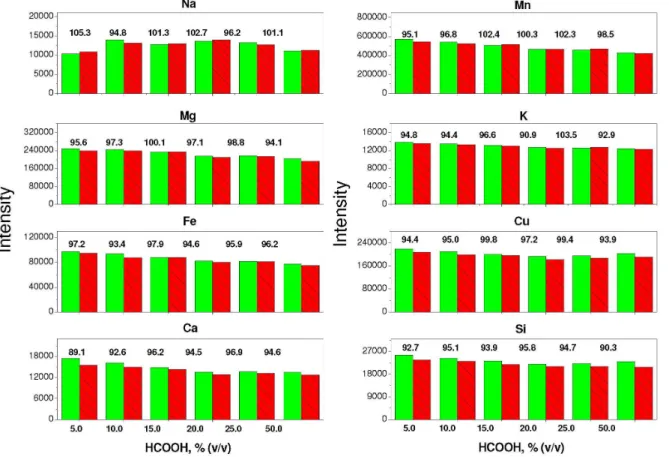
In order to obtain information about the necessity of organometallic standards for calibration, it was carried out a study to evaluate the signal intensity, varying the concentration of formic acid with fixed concentration of Triton X-100 in 0.1% (m/v) and adding 1 mg L-1 of inorganic
or organometallic standards for all analytes in each solution. This study is presented on Figure 3. The results showed that even with the increasing concentration of formic acid, the signal intensity of all analytes were similar and the recoveries of added concentrations ranged between 92 to 103%. From these results, it could be concluded that the determinations can be performed using inorganic standards.
Calibration curve
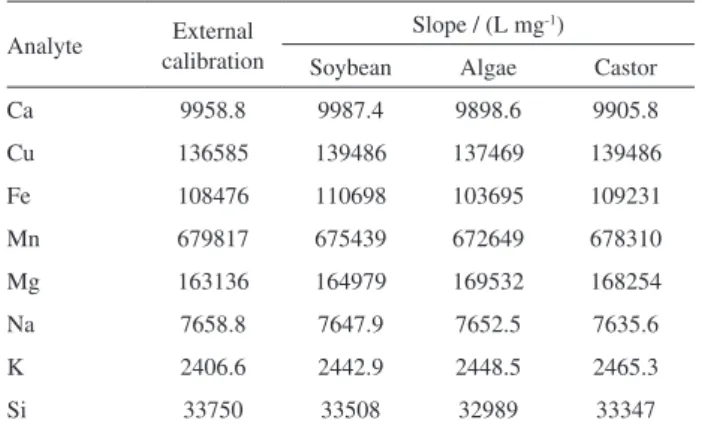
Since biodiesel of different sources present different compositions (and consequently, different properties, such as viscosity and density), the matrix influence was investigated by observing the slopes of analyte addition curves with three biodiesel samples (soybean, algae and castor oil). Also, in order to define the calibration mode, the slope of an external calibration curve was compared to those obtained from analyte addition curves relative to samples. External calibration curves were prepared with mineral oil in formic acid and Triton X-100 and the analyte addition curves were prepared by spiking the emulsions of the biodiesel samples with formic acid and Triton X-100, as described in experimental section, with appropriate volumes of aqueous inorganic standards.
Figure 3. Intensity of signal for Na, Mn, Mg, K, Cu, Ca, Fe and Si after addition of 1 mg L-1 of inorganic standard (green) or organometallic standard (red)
Results presented on Table 2 show no significant multiplicative matrix effects in relation to the external calibration curve (t test, p < 0.05), since the slope values were similar. Thus, the external calibration curve with inorganic standards prepared using mineral oil, formic acid and Triton X-100 was used to analyze the biodiesel samples.
Analytical applications
The accuracy of the proposed procedure was evaluated using the multi-element standards in B100 biodiesel (Conostan) containing 20 mg kg-1 of Ca, Mg, K and Na. The
concentrations were obtained by external calibration and the emulsion was prepared as described on experimental section. Table 3 shows the obtained results.
Since this multi-element standards B100 biodiesel does not present certified or informed values for Fe, Mn, Cu and Si, the accuracy was also assessed through recovery tests carried out by adding the inorganic standard to the original samples (soybean, algae and castor oil) at three concentration levels for each analyte (1.0, 2.0 and 5.0 mg L-1). Results are shown in Figure 4. Recoveries
ranged from 91 to 107% supported the accuracy of the proposed method.
Figures of merit
Table 4 summarizes the main figures of merit obtained with the proposed procedure with external calibration curve prepared in 1% (m/v) mineral oil, 15% (v/v) formic acid, 0.1% (m/v) Triton X-100 and yttrium as internal standard.
Table 2. Slopes of analyte addition curves in biodiesel samples of different raw materials by ICP OES
Analyte External calibration
Slope / (L mg-1)
Soybean Algae Castor
Ca 9958.8 9987.4 9898.6 9905.8
Cu 136585 139486 137469 139486
Fe 108476 110698 103695 109231
Mn 679817 675439 672649 678310
Mg 163136 164979 169532 168254
Na 7658.8 7647.9 7652.5 7635.6
K 2406.6 2442.9 2448.5 2465.3
Si 33750 33508 32989 33347
Table 3. Concentration of Ca, Mg, K and Na obtained in the multi-element standards in B100 biodiesel (Conostan) containing 20.0 ± 0.5 mg kg-1 of
each analyte, by the proposed procedure (n = 3)
Analyte Found value / (mg kg-1) RSD / %
Ca 19.80 ± 0.17 0.8
Mg 19.23 ± 0.23 1.2
K 20.11 ± 0.37 1.8
Na 19.95 ± 0.12 0.6
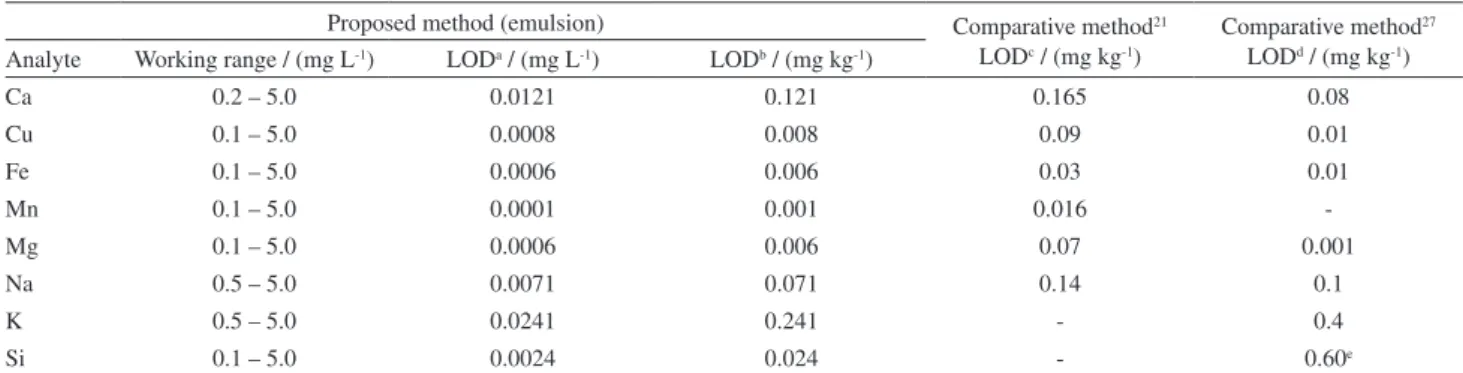
The instrumental limits of detection (LOD) were calculated as three times the standard deviation of 10 measurements of the blank signals divided by the slope of the respective calibration curve for each analyte. Also, the LOD was calculated for the original sample considering 1.0 g of biodiesel in 10 mL of final solution. In order to evaluate the analytical potential of the proposed procedure, the values of LOD were compared with those reported by De Souza et al.21 and Chaves et al.,27 which used the ICP OES
to determine the same analytes in biodiesel samples by formation of emulsion with nitric acid and Triton X-100 or by dilution with alcohol. According to Table 4, the proposed procedure showed limits of detection in the same order of magnitude or even better than those of the comparative methods. In addition, we observed that not all biodiesel samples can dissolve in ethanol, making the emulsion formation a fast and attractive method for biodiesel preparation.
The obtained values of LOD for the proposed procedure are adequate for the analysis of the biodiesel in accordance to the established limits in the Brazilian legislation, mainly for Ca, Mg, Na and K. When compared with the values of LOD obtained with others works
(F AAS, F AES or ICP OES13) for biodiesel samples
prepared as a microemulsions16-18 or by microwave-assisted
decomposition,13 the emulsion with formic acid and Triton
X-100 showed better values. In the same way, the values of LOD for this work were better in comparison with the results obtained by De Oliveira et al.,33 which used the
procedure recommended by the ABNT NBR 15556 using LS F AAS and HR-CS F AAS with sample diluted with xylene for determination of Na, K, Mg and Ca.
Another important figure of merit is the background equivalent concentration (BEC), which is the concentration calculated for the blank signal. Except for Ca, which BEC (0.005 mg L-1) was lower than the half of the LOD, the
calculated values for BEC were in the same order of the LOD for all other analytes. It means that the values of the blanks were as low as the LOD and then, are not expect to interfere in the analysis of the samples, unless for very low concentrations.
The procedure developed using emulsion with formic acid and Triton X-100 was applied to determine the analytes in three biodiesel samples (soybean, algae and castor) and the results of measured concentration are shown in Table 5. The values of the concentrations measured in 3 replicates of
Table 4. Limits of detection of the proposed procedure (emulsion formation) and the comparative methods
Proposed method (emulsion) Comparative method21
LODc / (mg kg-1)
Comparative method27
LODd / (mg kg-1)
Analyte Working range / (mg L-1) LODa / (mg L-1) LODb / (mg kg-1)
Ca 0.2 – 5.0 0.0121 0.121 0.165 0.08
Cu 0.1 – 5.0 0.0008 0.008 0.09 0.01
Fe 0.1 – 5.0 0.0006 0.006 0.03 0.01
Mn 0.1 – 5.0 0.0001 0.001 0.016
-Mg 0.1 – 5.0 0.0006 0.006 0.07 0.001
Na 0.5 – 5.0 0.0071 0.071 0.14 0.1
K 0.5 – 5.0 0.0241 0.241 - 0.4
Si 0.1 – 5.0 0.0024 0.024 - 0.60e
ainstrumental limit of detection; blimit of detection in the original sample (10 times dilution factor); cmicroemulsion with 0.2% (v/v) HNO
3 and 6 % (m/v)
Triton X-100; ddilution of 0.45 g of biodiesel with HNO
3 and ethanol or propanol; evalue of LOD for Si obtained with samples diluted in xylene (reference 26).
Table 5. Concentrations of Ca, Cu, Fe, Mn, Mg, Na, K and Si obtained in biodiesel samples (n = 3) using the proposed procedure and dilution with xylenea
Analyte Soybean / (mg kg
-1) Algae / (mg kg-1) Castor / (mg kg-1)
Emulsion Dilution with xylene Emulsion Dilution with xylene Emulsion Dilution with xylene
Ca 0.27 ± 0.01 < 0.10 < 0.12 < 0.10 3.2 ± 0.3 3.5 ± 0.1
Cu < 0.008 < 0.009 0.303 ± 0.005 0.280 ± 0.005 < 0.008 0.061 ± 0.002
Fe < 0.006 0.029 ± 0.002 2.2 ± 0.1 2.1 ± 0.1 0.31 ± 0.01 0.30 ± 0.01
Mn < 0.001 < 0.001 0.030 ± 0.003 0.022 ± 0.005 0.033 ± 0.002 0.031 ± 0.002
Mg < 0.006 0.045 ± 0.006 < 0.006 0.022 ± 0.004 1.49 ± 0.16 1.20 ± 0.50
Na 0.30 ± 0.01 < 0.04 2.0 ± 0.1 1.7 ± 0.2 3.5 ± 0.1 3.4 ± 0.1
K < 0.24 < 0.10 < 0.24 < 0.10 < 0.24 < 0.10
Si 0.40 ± 0.01 < 0.60 0.34 ± 0.01 < 0.60 < 0.024 < 0.60
each sample did not vary more than 8.7%. For comparison, samples were also analyzed after dilution with xylene, following the method recommended by the Brazilian legislation.10 Results presented in table 5 were mostly in
agreement, confirming the accuracy of the proposed method.
Conclusions
The use of emulsification as a sample preparation strategy using formic acid and Triton X-100 was found to be a very effective technique for ICP OES analysis of trace metals in biodiesel. Formic acid has never been used for this purpose and showed a good reagent instead to use organic solvent such as xylene or others solvents. The proposed procedure is direct and simple, employs low toxicity reagents, is easy to implement, and is fast. It is a good alternative for the determination of the metals in biodiesel using a single preparation oil-in-water (o/w) emulsion, and allows calibration to be performed with aqueous inorganic standards. The limits of detection, at the optimized conditions, were better than those obtained by the method recommended by the regulatory norms and are adequate for the determination of these elements in biodiesel, in accordance to the established limits by the Brazilian and international legislation.
Acknowledgements
The authors are grateful to Conselho Nacional de Desenvolvimento Científico e Tecnológico (CNPq) and Coordenação de Aperfeiçoamento de Pessoal de Nível Superior (CAPES) for research scholarship. Also, to the CNPq (Edital Universal 14/2010 - Process 473497/2010-7) and to the Fundação de Amparo à Pesquisa do Estado do Rio Grande do Sul (FAPERGS/Edital ARD/2010- Process 10/0234-9) for financial support through research projects. Also, are grateful to Mauricio Duppin, from PUC-Rio by ICP OES analysis.
References
1. Knothe, G.; Gerpen, J. V.; Krahl, J; The Biodiesel Handbook; 1st ed., AOCS Press: Champaign, 2005.
2. Knothe, G.; Progr. Energ. Combust. 2010, 36, 364. 3. Bozbas, K.; Renew. Sustain. Energy Rev. 2008, 12, 542. 4. Lepri, F. G.; Chaves, E. S.; Vieira, M. A.; Ribeiro, A. S.; Curtius,
A. J.; Oliveira, L. C. C.; Campos, R. C.; Appl. Spectrosc. Rev.
2011, 46, 175.
5. Agência Nacional do Petróleo, Gás Natural e Biocombustíveis, Resolução ANP No. 14, de 11.5.2012 - DOU 18.5. 2012.
6. BS EN 14108/2003: Fat and Oil Derivatives. Fatty Acid Methyl Esters (FAME). Determination of Sodium Content by Atomic
Absorption Spectrometry, 2003.
7. BS EN 14109/2003: Fat and Oil Derivatives. Fatty Acid Methyl Esters (FAME). Determination of Potassium Content by Atomic
Absorption Spectrometry, 2003.
8. DIN EN 14538/2006: Fat and Oil Derivatives. Fatty Acid Methyl Esters (FAME). Determination of Ca, K, Mg and Na Content by
Optical Emission Spectral Analysis with Inductively Coupled
Plasma (ICP OES), 2006.
9. ASTM D6751-10: Standard Specification for Biodiesel
Fuel Blend Stock (B100) for Middle Distillate Fuels, West
Conshohocken, PA, USA, 2010.
10. ABNT NBR 15553:2008: Fat Oil and Derivatives. Fatty Acid Methyl Esters. Determination of the Calcium, Magnesium,
Sodium, Phosphorus and Potassium Contents by Inductively
Coupled Plasma Optical Emission Spectrometry (ICP OES),
São Paulo, 2008.
11. ABNT NBR 15556:2008: Fat Oil and Derivatives. Fatty Acid Methyl Esters. Determination of the Sodium, Potassium,
Calcium and Magnesium Contents by Atomic Absorption
Spectrometry, São Paulo, 2008.
12. Korn, M. G. A.; Santos, D. S. S.; Welz, B.; Vale, M. G. R.; Teixeira, A. P.; Lima, D. C.; Ferreira, S. L. C.; Talanta 2007,
73, 1.
13. Korn, M. G. A.; Santos, D. C. M. B.; Guida, M. A. B.; Barbosa, I. S.; Passos, M. L. C.; Saraiva, M. L. M. F. S.; Lima, J. L. F. C.;
J. Braz. Chem. Soc. 2010, 21, 2278.
14. Silva, J. S. A.; Chaves, E. S.; Dos Santos, E. J.; Saint’Pierre, T. D.; Frescura, V. L. A.; Curtius, A. J.; J. Braz. Chem. Soc. 2010, 21, 620.
15. Vieira, M. A.; Oliveira, L. C. C.; Gonçalves, R. A.; Souza, V.; Campos, R. C.; Energy Fuels 2009, 23, 5942.
16. Chaves, E. S.; Saint’Pierre, T. D.; Santos, E. J.; Tormen, L.; Frescura, V. L. A.; Curtius, A. J.; J. Braz. Chem. Soc. 2008, 19, 856.
17. Jesus, A.; Silva, M. M.; Vale, M. G. R.; Talanta 2008, 74, 1378. 18. Lobo, F. A.; Goveia, D.; Oliveira, A. P.; Pereira-Filho, E. R.;
Fraceto, L. F.; Dias Filho, N. L.; Rosa, A. H.; Fuel 2009, 88, 1907.
19. Jesus, A.; Zmozinski, A. V.; Barbará, J. A.; Vale, M. G. R.; Silva, M. M.; Energy Fuels 2010, 24, 2109.
20. Chaves, E. S.; Lepri, F. G.; Silva, J. S. A.; Quadros, D. P. C.; Saint’Pierre, T. D.; Curtius, A. J.; J. Environ. Monit. 2008, 10, 1211.
21. De Souza, R. M.; Leocádio, L. G.; Da Silveira, C. L. P.; Anal. Lett. 2008, 41, 1614.
22. Amais, R. S.; Garcia, E. E.; Monteiro, M. R.; Nogueira, A. R. A.; Nóbrega, J. A.; Microchem. J. 2010, 96, 146.
24. Nunes, L. S.; Barbosa, J. T. P.; Fernandes, A. P.; Lemos, V. A.; Dos Santos, W. N. L.; Korn, M. G. A.; Teixeira, L. S. G.; Food Chem. 2011, 127, 780.
25. Amais, R. S.; Donati, G. L.; Nóbrega, J. A.; J. Braz. Chem. Soc. 2012, 23, 797.
26. Oliveira, L. C. C.; Vieira, M. A.; Ribeiro, A. S.; Lisboa, M. T.; Gonçalves, R. A.; Campos, R. C.; Energy Fuels 2012, 26, 7041. 27. Chaves, E. S.; De Loos-Vollebregt, M. T. C.; Curtius, A. J.;
Vanhaecke, F.; Spectrom. Acta Part B. 2011, 66, 733. 28. Burguera, J. L.; Burguera, M.; Talanta 2012, 96, 11. 29. Platteau, O.; Carrilo, M.; Fuel 1995, 74, 761.
30. Pelizzeti, E.; Pramauro, E.; Anal. Chim. Acta 1985, 169, 1. 31. Aranda, P. R.; Pacheco, P. H.; Olsina, R. A.; Martinez, L. D.;
Gil, R. A.; J. Anal. At. Spectrom. 2009, 24, 1441.
32. Scriver, C.; Kan, M.; Willie, S.; Soo, C.; Birnboim, H.; Anal. Bioanal. Chem. 2005, 381, 1460.
33. Nunes, A. M.; Acunha, T. S.; Oreste, E. Q.; Lepri, F. G.; Vieira, M. A.; Curtius, A. J.; Ribeiro, A. S.; J. Braz. Chem. Soc. 2011,
22, 1850.
34. Oliveira, L. C. C.; Vieira, M. A.; Ribeiro, A. S.; Baptista, P. M.; Gonçalves, R. A.; Campos, R. C.; J. Braz. Chem. Soc. 2012,
23, 1400.
Submitted: June 15, 2013