Nota Técnica
*e-mail: [email protected]
DERIVATIVE SPECTROPHOTOMETRIC METHOD FOR DETERMINATION OF ACYCLOVIR IN POLYMERIC NANOPARTICLES
Guilherme Diniz Tavares*, Gisele Miki Ishikawa, Talita Ferreira Monteiro, Carolina Zanolini, Érika Rosa Maria Kedor-Hackmann, Nádia Araci Bou-Chacra e Vladi Olga Consiglieri
Faculdade de Ciências Farmacêuticas, Universidade de São Paulo, Av. Prof. Lineu Prestes, 580, 05508-900 São Paulo - SP, Brasil
Recebido em 28/2/11; aceito em 13/6/11; publicado na web em 8/8/11
A derivative spectrophotometric method was validated for quantification of acyclovir in poly (n-butylcyanoacrylate) (PBCA) nanoparticles. Specificity, linearity, precision, accuracy, recovery, detection (LOD) and quantification (LOQ) limits were established for method validation. First-derivative at 295.2 nm eliminated interferences from nanoparticle ingredients and presented linearity for acyclovir concentrations ranging from 1.25 to 40.0 µg/mL (r = 0.9999). Precision and accuracy data demonstrated good reproducibility. Recovery ranged from 99.3 to 101.2. LOD was 0.08 µg/mL and LOQ, 0.25 µg/mL. Thus, the proposed method proved to be easy, low cost, and accurate, and therefore, an useful alternative to quantify acyclovir in nanoparticles.
Keywords: acyclovir; polymeric nanoparticles; derivative spectrophotometry.
INTRODUCTION
In recent decades, there has been a considerable interest in the research of drug delivery using particulate systems as carriers for small and large molecules. Accordingly, nanoparticles have been used as a physical approach to modify and improve the pharmacokinetic and pharmacodynamic properties of a large number of drugs.1 Nanocarriers
are currently being investigated for many therapeutic applications to overcome typical drug delivery challenges, such as increasing physi-cochemical stability, enhancing cellular uptake of poorly permeable molecules, reducing cellular and tissue clearance of drugs, as well as sustaining drug delivery.2,3 So, the therapeutic efficacy and safety
of drugs can be significantly improved by targeted delivery using nanoparticles.4
Nowadays, much attention has been paid to the poly(alkylcyano--acrylate) (PACA) nanoparticles due to their ease of preparation, low toxicity and biodegradability. Thus, these systems are already employed in clinical development for cancer therapy.5 After oral
administration, PACA nanoparticles can protect the active molecules and control their release by an erosion mechanism.6 On the other
hand, the surface modification of these nanocarriers using polymers with specific properties has been reported to be a promising way to improve the oral bioavailability of drugs.7 Thereby, studies have
established that a partially quaternized derivative of chitosan, N,N,N--trimethylchitosan (TMC), can be used as an absorption enhancer for large and/or hydrophilic compounds across intestinal epithelium.8-10
TMC acts mainly by opening the tight junctions between epithelial cells to allow the paracellular transport of these compounds.11
As a consequence, recent nanoparticle systems exhibit new analytical challenges because of the wide variety of compounds in their composition and also, the need to detect smaller amounts of drugs. A significant number of techniques, specially spectrophoto-metry12-14 and high-performance liquid chromatography (HPLC),15-17
are described for the quantification of drugs in PACA nanoparticles. Conventional spectrophotometric methods are very susceptible to the presence of interferences in complex mixtures such as nanoparticules, requiring prior treatment or extraction of the analyte, and not always
providing adequate response. Despite the undoubted advantages of using HPLC technique, this one has some limitations such as the high cost of instrumentation and operation, relatively long time for analysis and the need of experience in handling the equipment and processing samples. In addition, the disadvantages related to the use of solvents such as discharge, operator health and environmental damage encourage the development of simpler and faster methods, with smaller amounts of solvents and without prior extraction steps. In this sense, derivative spectrophotometric method with detection in UV is low cost and is easily applied to analysis of raw materials and pharmaceuticals, as well as in kinetic studies of drug release, detection of analyte in the presence of decomposition compounds, and many other applications.18
Derivative spectrophotometry (DS) is based on so called derivative spectra which are generated from conventional or zero-order scan. The derivatization of zero-order spectrum can lead to the separation of overlapped signals and elimination of background caused by pre-sence of other compounds in a sample without previous separation or purification. Nowadays, this technique is considered a very useful additional tool which helps to solve various analytical problems. Several applications have been found in many areas of analysis, especially in pharmaceutical.19-21
Some methods employing DS were reported to the quantification of acyclovir (9-[2-hydroxyethoxymethyl]-9H-guanine, ACV) (Figure 1) in order to quantify this drug in pharmaceutical dosage forms, such as injections and creams22 or in the presence of guanine, its main
impurity.23 Nevertheless, according to our knowledge, there are no
reports concerning the quantification of ACV in PACA nanoparticles by this technique.
In this sense, the aim of this work was to purpose a rapid and effective first-order spectrophotometric method to quantify ACV in
Tavares et al.
204 Quim. Nova
empirical formulation containing poly(n-butylcyanoacrylate) (PBCA) nanoparticles coated or uncoated with TMC.
EXPERIMENTAL
Apparatus and conditions
A Shimadzu® UV-1601 double-beam spectrophotometer with 1.0 cm
quartz cells and data processing capacity was used. The first-order deriva-tive (zero-crossing method) spectra were obtained over the 220.0-320.0 nm range, ∆λ = 2.0 nm, scaling factor = 1.0 and amplitude = ± 0.1. The
determinations were made at 295.2 nm (1D
295.2). Methanol:Acetonitrile
(MeOH:ACN) (8:2 v/v) was used as solvent mixture. Chemicals
Acyclovir reference standard (~99% purity) was kindly supplied by Aché Pharmaceuticals Laboratories (São Paulo, SP, Brazil). Acyclovir raw material of pharmaceutical grade was kindly donated by Medley Pharmaceutical Industry (Campinas, SP, Brazil). The monomer n-butylcyanoacrylate was purchased from B. Braun La-boratories (Tuttlingen, Baden-Württemberg, Germany). Chitosan (low molecular weight, 92% deacetylated, viscosity 20000 cps) and Dextran 70.000 were obtained from Sigma Chemical Company (St Louis, MO, USA). Methyl iodide was purchased from Merck (Dar-mstadt, Hessen, Germany). All other chemicals and solvents used were of analytical grade. N,N,N-trimethylchitosan was synthesized by reductive methylation of chitosan based on apreviously described method24 and 1H-nuclear magnetic resonance spectra was obtained
(Figure 1S, supplementary material). Nanoparticles preparation
Synthesis of PBCA nanoparticles
Poly(n-butylcyanoacrylate) nanoparticles (PBCA) were obtained by emulsion polymerization according to the method described by Couvreur and Vauthier25 with some modifications:
n-butylcyanoa-crylate monomer (1.0%) was added dropwise under magnetic stirring (800 rpm) into 10.0 mL of aqueous solution (pH 2.5), containing Dextran 70 (1.0%). After 4 h, about 100.0 µL of 0.1 M NaOH was added, until neutralization of colloidal suspension.
Preparation of PBCA-TMC nanoparticles
Coated nanoparticles were prepared by incubation of TMC aqueous solution (2.5 mL, 0.5% w/v) in 5.0 mL of nanoparticles suspension under magnetic stirring (50 rpm) for 1 h.
Method validation
Reference standard stock solutions
Standard ACV was accurately weighed (100.0 mg) and transferred to a 250.0 mL volumetric flask. HCl solution (0.1 M, 1.0 mL) was added to promote total dissolution and the volume was completed with MeOH:ACN (8:2 v/v). This solution was diluted with the same solvent, obtaining the ACV concentration of 20.0 µg/mL.
Placebo solutions
PBCA nanoparticles (placebo 1) and PBCA-TMC nanoparticles (placebo 2)
An aliquot of 10.0 mL of the PBCA nanoparticles suspension (or PBCA-TMC nanoparticles suspension) was transferred to a 250.0 mL volumetric flask followed by addition of HCl solution (0.1 M, 1.0 mL), and the volume was completed with MeOH:ACN (8:2 v/v).
Then, 5.0 mL were transferred to a 100.0 mL volumetric flask and the volume was completed with the same solvent. Finally, 15.0 mL were centrifugated (10.000 rpm, 60 min, at room temperature) and the supernatant was used for measurements.
Sample solutions
PBCA nanoparticles with ACV (sample 1) and PBCA-TMC nanoparticles with ACV (sample 2)
Aliquots of 100.0 mg of ACV and 10.0 mL of PBCA nanopar-ticles suspension (or PBCA-TMC nanoparnanopar-ticles with ACV) were transferred to a 250.0 mL volumetric flask followed by the addition of HCl solution (0.1 M, 1.0 mL) to promote total dissolution of ACV and the volume was completed with MeOH:ACN (8:2 v/v). Then, 5.0 mL of this solution were transferred to a 100.0 mL volumetric flask and the volume was completed with the same solvent. The final ACV concentration was 20.0 µg/mL. Finally, 15.0 mL of this last solution was centrifugated (10.000 rpm, 60 min, at room temperature) and the supernatant was used for measurements.
Blank solution
Blank solution was prepared by transferring 1.0 mL of 01.M HCl solution to a 250.0 mL volumetric flask and completing volume with MeOH:ACN (8:2 v/v).
Specificity
The specificity of the method was evaluated by the analysis of standard solution, placebo solutions (1 and 2) as well as sample so-lutions (1 and 2). Zero-order spectra were obtained over the 220-320 nm range. From this, first-order derivative spectra were obtained. Linearity
Aliquots from the stock solutions of ACV were transferred to volumetric flasks and diluted with blank solution to obtain the final concentrations of 1.25, 2.5, 5.0, 8.0, 10.0, 16.0, 20.0 and 40.0 µg/mL. Each solution was prepared in triplicate. The first-order derivative spectra (zero-crossing method) were obtained over the 220.0-320.0 nm range and determinations were made at 295.2 nm. The linearity was evaluated by linear regression analysis, which was calculated by the least square regression method.
Precision and accuracy
Aliquots of 10.0 mL from placebos 1 and 2 were added to kno-wn amounts of standard solutions of ACV (25.0, 100.0 and 200.0 µg/mL). Each sample was diluted with blank solution to analytical concentrations (2.5, 10.0 and 20.0 µg/mL), centrifugated (10.000 rpm, 60 min, at room temperature) and supernatants were used for measurements. Precision and accuracy were calculated intra- and inter-day as RSD and E, respectively, as established by ICH in the Validation of Analytical Procedure–Methodology.26
Detection (LOD) and Quantification (LOQ) limits
Detection and quantification limits were estimated by the slope and mean standard deviation of standard ACV concentrations em-ployed to construct the calibration curve.26
Recovery
RESULTS AND DISCUSSION
The literature describes the use of different solvents in order to disrupt the PBCA nanoparticles for subsequent quantification of the associated drug, such as chloroform,12 ethanol,13 methanol16 and
acetonitrile.27 These solvents, as well as their mixtures in different
proportions, were evaluated through visual observation with regard to their ability of efficiently disrupt nanoparticles. The best solvent composition was found to be MeOH:ACN (8:2, v/v); however, a previous addition of HCl solution (0.1 M, 1.0 mL) (pH 1.2) was necessary to ensure complete solubilization of ACV.
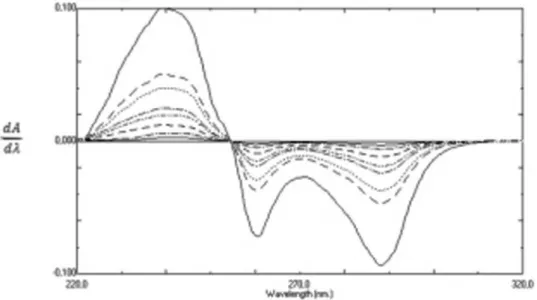
The zero-order spectra from ACV in PBCA or PBCA-TMC nanoparticles showed complete overlapping as can be observed in Figure 2. Therefore classical UV method cannot be applied. So, to assure no significance of these signals from placebos, nominal derivative values were evaluated. The first-derivative (1D) spectra
from placebo 1 and 2, ACV, and nanoparticle systems (uncoated and coated with TMC) were presented by Figure 3. In this figure, it is possible to observe that all interferences were cancelled out at the wavelength of 295.2 nm.
In addition, in order to improve the 1D method, different
smooth-ing and scalsmooth-ing factors were tested, where a smoothsmooth-ing factor of∆λ
= 2.0 and a scaling factor = 1.0 showed a suitable signal-to-noise ratio and spectra showed good resolution. A linear correlation (r = 0.9999) was obtained between peak amplitude at 295.2 nm and the corresponding concentration for ACV in the range of 1.25 and 40.0 µg/mL (Figure 2S, supplementary material). The linear
regres-sion equation was found to be: y = 0.0024x + 0.0004.
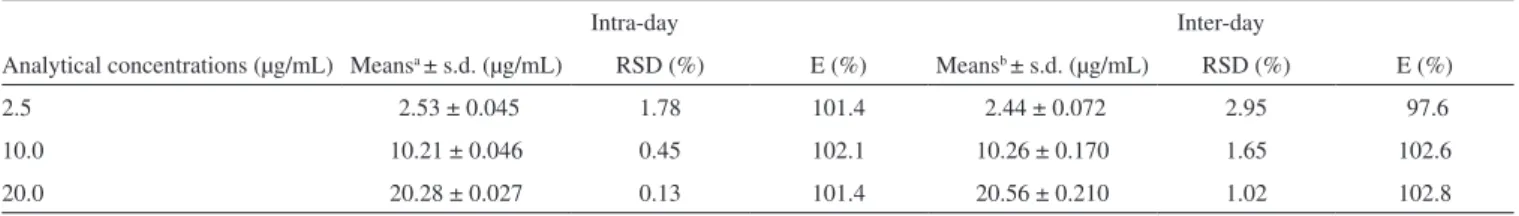
Intra- and inter-day precision, calculated as RSD, and accuracy values are reported in Tables 1 and 2. Relative small amount of RSD, not exceeding the limit of 5.0%, with mean values for intra- and inter-run assays were 0.79 and 1.87% for the PBCA nanoparticles (placebo 1). For the PBCA-TMC nanoparticles (placebo 2) these values were 0.65 and 2.89%, respectively, and confirmed the precision, reproduc-ibility and repeatability of the first derivative method at 295.2 nm. Accuracy mean values (intra- and inter-day) were 101.6 and 101.0% for the PBCA nanoparticles (placebo 1), whereas for the PBCA-TMC nanoparticles (placebo 2) were 100.3 and 100.7%.
LOD and LOQ were estimated as 0.08 µg/mL and 0.25 µg/mL, respectively. Recovery experiment was conducted to corroborate the accuracy of the proposed zero-crossing first-derivative spectro-photometric method. The mean recovery value (n = 9) for PBCA and PBCA-TMC samples with standard ACV was 100.3 and 100.2, respectively (Tables 3 and 4), indicating acceptable accuracy. CONCLUSIONS
Up to now, no derivative procedures have been described for assay of ACV present in PACA nanoparticles preparations. As a result, a new derivative spectrophotometric method was developed for determina-tion of this drug in polymeric nanoparticles coated or uncoated with TMC. This described method has eliminated the interference from excipients, allowing the quantification of ACV in these formulations with good accuracy. The method showed to be simple, rapid, sensitive Figure 2. Zero-order absorbance spectra of (a) PBCA-TMC with ACV (20.0
µg/mL), (b) PBCA with ACV (20.0 µg/mL), (c) ACV (20.0 µg/mL), (d) PBCA-TMC, (e) PBCA. Abs = absorbance
Figure 3. First-order derivative spectra of (a) PBCA with ACV (20.0 µg/mL), (b) ACV (20.0 µg/mL), (c) PBCA-TMC with ACV (20.0 µg/mL), (d) PBCA, (e) PBCA-TMC
Table 2. Intra- and inter-day assays for determination of precision and accuracy of DS method (295.2 nm, zero-crossing) for placebo 2
Intra-day Inter-day
Analytical concentrations (µg/mL) Meansa ± s.d. (µg/mL) RSD (%) E(%) Meansb ± s.d. (µg/mL) RSD (%) E (%)
2.5 2.49± 0.024 0.96 99.68 2.46 ± 0.10 4.06 98.4
10.0 10.05± 0.08 0.79 100.50 10.31 ± 0.26 2.52 103.1
20.0 20.19 ± 0.039 0.19 100.95 20.16 ± 0.42 2.08 100.8
a n = 3; b n = 9; s.d. = standard deviation; precision = relative standard deviation (RSD); E = accuracy.
Table 1. Intra- and inter-day assays for determination of precision and accuracy of DS method (295.2 nm, zero-crossing) for placebo 1
Intra-day Inter-day
Analytical concentrations (µg/mL) Meansa ± s.d. (µg/mL) RSD (%) E (%) Meansb ± s.d. (µg/mL) RSD (%) E (%)
2.5 2.53 ± 0.045 1.78 101.4 2.44 ± 0.072 2.95 97.6
10.0 10.21 ± 0.046 0.45 102.1 10.26 ± 0.170 1.65 102.6
20.0 20.28 ± 0.027 0.13 101.4 20.56 ± 0.210 1.02 102.8
Tavares et al.
206 Quim. Nova
Table 3. Results obtained from recovery tests of ACV from PBCA
nanopar-ticles by DS method (295.2 nm, zero-crossing) Concentration (µg/mL) Standard Sample Final
concentration
Found (meana ± s.d.)
Recovery (%) 80.0 20.0 10.0 10.01 ± 0.014 100.1 130.0 20.0 15.0 14.97 ± 0.024 99.8 180.0 20.0 20.0 20.24 ± 0.041 101.2 an = 3; s.d. = standard deviation.
Table 4. Results obtained from recovery tests of ACV from PBCA-TMC
nanoparticles by DS method (295.2 nm, zero-crossing) Concentration (µg/mL)
Standard Sample Final concentration
Found (meana ± s.d.)
Recovery (%) 80.0 20.0 10.0 9.93 ± 0.019 99.3 130.0 20.0 15.0 15.12 ± 0.028 100.8 180.0 20.0 20.0 20.10 ± 0.060 100.5 an = 3; s.d. = standard deviation.
and precise and could be easily applied in the determination of ACV associated to these nanocarries. Hence, first-derivative presented to be an useful analytical method for precise and accurate determination of ACV in PBCA and PBCA-TMC nanoparticles.
SUPPLEMENTARY MATERIAL
Available at http://quimicanova.sbq.org.br, in pdf file, with free access.
ACKNOWLEDGMENTS
The authors would like to thankCNPq and CAPES for scholar-ships financial support, and also Aché Pharmaceuticals Laboratories and Medley Pharmaceutical Industry for gently supply acyclovir pharmaceutical grade.
REFERENCES
1. Mohanraj, V. J.; Chen, Y.; Trop. J. Pharm. Res. 2006, 5, 561. 2. Mallipeddi, R.; Rohan, L. C.; Int. J. Nanomedicine2010, 5, 533. 3. Ishihara, T.; Mizushima, T.; Expert Opin. Drug Deliv. 2010, 7, 565. 4. Suri, S. S.; Fenniri, H.; Singh, B.; J. Occup. Med. Toxicol. 2007, 2, 16. 5. Vauthier, C.; Dubernet, C.; Fattal, E.; Pinto-alphandary, H.; Couvreur,
P.; Adv. Drug Deliver. Rev. 2003, 55, 519.
6. Chauvierre, C.; Leclerc, L.; Labarre, D.; Appel, M.; Marden, M. C.; Couvreur, P.; Vauthier, C.; Int. J. Pharm. 2007, 338, 327.
7. Bravo-osuna, I.; Vauthier, C.; Chacun, H.; Ponchel, G.; Eur. J. Pharm. Biopharm. 2008, 69,436.
8. Jonker, C.; Hamman, J. H.; Kotzé, A. F.; Int. J. Pharm. 2002, 238, 205. 9. Mourya, V. K.; Inamdar, N. N.; J. Mater. Sci.: Mater. Med. 2009, 20,
1057.
10. Werle, M.; Takeuchi, H.; Bernkop-Schnürch, A.; J. Pharm. Sci. 2009, 98, 1643.
11. Polnok, A.; Borchard, G.; Verhoef, J. C.; Sarisuta, N.; Junginger, H. E.; Eur. J. Pharm. Biopharm. 2004, 57, 77.
12. Weiss, K.; Lorenz, M.; Landfester, K.; Mailander, V.; Macromol. Biosci.
2007, 7, 883.
13. Mulik, R.; Mahadik, K.; Paradkar, A.; Eur. J. Pharm. Sci.2009, 37, 395. 14. Liu, H.; Chen, J.; PDA J. Pharm. Sci. Tech. 2009, 63, 207.
15. Xi-xiao, Y.; Jan-hai, C.; Shi-ting, L.; Dan, G.; Xv-xin, Z.; Reg. Tox. Pharm. 2006, 46, 211.
16. He, M.; Zhao, Z.; Yin, L.; Tang, C.; Yin, C.; Int. J. Pharm. 2009, 373, 165.
17. Luo, D. Q.; Guo, J. H.; Wang, F. J.; Jin, Z. X.; Cheng, X. L.; Zhu, J. C.; Peng, C. Q.; Zhang, C.; J. Biomater. Sci., Polym. Ed.2009, 20, 21. 18. Siqueira-Moura, M. P.; Lira, M. C. B.; Santos-Magalhães, N. S.; Rev.
Bras. Cienc. Farm. 2008, 44, 621. 19. Karpinska, J.; Talanta2004, 64, 801.
20. Bosch Ojeda, C.; Sanches Rojas, F.; Anal. Chim. Acta2004, 518, 1. 21. Mendez, A. S. L.; Deconto, L.; Garcia, C. V.; Quim. Nova 2010, 33, 981. 22. Mahrous, M. S.; Abdel-Khalek, M. M.; Daabees, H. G.; Beltagy, Y. A.;
Anal. Lett. 1992, 25, 1491.
23. Daabees, H. G.; Anal. Lett. 1998, 31, 1509.
24. Curti, E.; Britto, D.; Campana-Filho, S. P.; Macromol. Biosci. 2003, 3, 571.
25. Couvreur, P.; Vauthier, C.; J. Controlled Release 1991, 17, 187. 26. ICH - International Conference on Harmonization of Technical
Requeri-ments for Registration of Pharmaceuticals for Human Use, Q2B(R1): Guideline on Validation of Analytical Procedure–Methodology, 2005. 27. Maksimenko, O.; Pavlov, E.; Toushov, E.; Molin, A.; Stukalov, Y.;
Prudskova, T.; Feldman, V.; Kreuter, J.; Gelperina, S.; Int. J. Pharm.
Supplementary Material
*e-mail: [email protected]
DERIVATIVE SPECTROPHOTOMETRIC METHOD FOR DETERMINATION OF ACYCLOVIR IN POLYMERIC NANOPARTICLES
Guilherme Diniz Tavares*, Gisele Miki Ishikawa, Talita Ferreira Monteiro, Carolina Zanolini, Érika Rosa Maria Kedor-Hackmann, Nádia Araci Bou-Chacra e Vladi Olga Consiglieri
Faculdade de Ciências Farmacêuticas, Universidade de São Paulo, Av. Prof. Lineu Prestes, 580, 05508-900 São Paulo - SP, Brasil
Tavares et al.
S2 Quim. Nova