The Public Good Game on Graphs: Can the Pro-Social Behavior Persist?
Roberto da Silva Instituto de Inform´atica - UFRGS Av. Bento Gonc¸alves, 9500 - Campus do Vale
Bairro Agronomia - Porto Alegre - RS -Brasil CEP: 91501-970 Caixa Postal: 15064
Received on 10 September, 2007
This communication proposes new alternatives to study the pro-social behavior in artificial society of players in the context of public good game via Monte Carlo simulations. Here, the pro-social aspect is governed by a binary variable called motivation that incites the player to invest in the public good. This variable is updated according to the benefit achieved by the player, which is quantified by a return function. In this manuscript we propose a new return function in comparison with other one explored by the same author in previous contribu-tions. We analyze the game considering different networks studying noise effects on the density of motivation. Estimates of pro-sociability survival probability were obtained as function of randomness (p) in small world networks. We also introduced a new dynamics based on Gibbs Sampling for which the motivation of a player (now aq−state variable) is chosen according to the return of its neighbors, discarding the negative returns.
Keywords: Public good game; Monte Carlo Simulations; Artificial societies
I. INTRODUCTION
The Evolutionary game theory [1, 3] has contributed mean-ingfully for the understanding of the emerging aspects in ar-tificial societies modeled with players rules that evolve along time. This approach has incorporated dynamic aspects to the classical game theory, becoming an interesting laboratory to study economic and social quantities of an artificial society like wealth distribution, pro-social behavior, cooperation and other similar measures that can model some real situations.
Many games have been considered to explain properties originated from bargaining, cooperation, competition and why not altruism, fairness, selfishness. From the experimental eco-nomics1, an interesting game was proposed to explain the pro-social behavior (the behavior intended to benefit others in the society as a whole), i.e., how altruistic actions can lead to good situations where benefits are distributed for a group of people. This game is known as the public good game [1, 2, 7]. The original version of this game models the public spending for the community, like roads, bridges, libraries. Players are of-fered the opportunity to invest their money into a common pool. The profits, which are obtained from tolls and member-ship fees are equally distributed among all participants irre-spective of their contributions after the duplication or tripli-cation of the stored amount in the pool to encourage the con-tribution. However, each player unaware of the contribution of the other players would invest nothing which corresponds to the rational behavior. Thus, for purely rational players the dominant solution is to default, i.e., absence of pro-social be-havior!
Several aspects of this game have been studied by econo-mists in experiments with human beings. [4] has conducted
1http://en.wikipedia.org/wiki/Experimental economics
experiments in United States and Japan aiming to study the voluntary participation in the public goods. The work claims that japanese are more likely to act spitefully which leads to more efficient contributions when compared with American subjects.
Other experimental results from [5] show that in institu-tions, i.e., group of people interacting according to the public good game are more competitive when punishments among the participants are adopted, i.e., sanctioning institutions are more efficient. Group size effects are also studied in the provi-sion of public good via experiments of voluntary contributions [6] which shows that a group’s ability to provide the optimal level of a public good is not inversely proportional to group size as expected previously by premises.
Alternatively, computational and analytical results can also give some understanding of important properties of public goods game. In our previous contributions [7–9], a version of this game with a binary motivation parameter was introduced to lead the investment among the players where the return per agent is calculated according to
Ri(t) =(a+br) L
L
∑
k=1
σk(t) +h(ρ(k)(t)−1/2)
−σi(t) +h(ρ(k)(t)−1/2)
, (1)
where
ρ(k)(t) = 1
∑Lj=1Ak j L
∑
j=1σj(t)Ak j (2)
governed by two parameters: one is deterministic and is de-noted byaand the other is non-deterministic, which stands for the noise which amplitude isbsinceris an uniform random variable distributed in[−1,1]. Each player is characterized by its motivation level, a variable initially defined asσi∈ {0,1}: the players are motivated or unmotivated.
Each playerk=1, ...,Linvests a quantitySk=σk+h(ρ(k)− 1/2)where the investment is a function of the individual moti-vationσkand the motivation of the neighborhood represented by the functionh(ρ(k)−1/2). This neighborhood influence
assumes the values 0,1 or 2 respectively ifρ(k)is smaller than
1/2, exactly 1/2 and higher than 1/2, where the quantityρ(k)
corresponds to density of motivation of the neighborhood of the playerk.
A first original contribution of this communication is to ex-tend some of the explored results in other contributions by the same author of this manuscript and collaborators. In this pa-per, I obtained new results for the game in one dimensional lattices, small worlds and in the complete graph under mean field approximation. We have introduced a new alternative re-turn function that considers a continuous contribution of the neighborhood. Basically, we replacedh(ρ(k)−1/2)byρ(k)in
1:
RCi(t) =(a+br) L
L
∑
k=1
σk(t) +ρ(k)(t) −σi(t) +ρ(i)(t)
(3) More precisely we have studied the effects of this continu-ous influence in diagramsa×ρ0, when the noise is off (b=0)
for different networks. In these diagrams, for each pair(a,ρ0)
is attributed a symbolic value corresponding to the kind of be-havior ofρ(t)for long times (for the symmetry of the problem just 3 possible behaviors are observed in the 2-state motivation model). In our model, the evolutionary aspect comes from the update of the motivation to be performed according to the re-turn achieved by each player. The rere-turn function as exposed in the equation 3 is particularly important in small world net-works (SW) because in this case the survival probability is strongly dependent ofpas we will see in the future sections.
We also explore in this contribution a dynamics for evolu-tion of the density considering the update of motivaevolu-tion ac-cording to the return of neighbors prescribed by Boltzmann weights (Gibbs sampling dynamics). In this case we extended the granularity of motivation, i.e.,σi∈ {0,1, ...,q−1}. Plots of the density of motivation as a function of time for different values of noise and different values ofqwere performed.
Our manuscript is organized as follows: in the section II we present a brief overview about the model. Section III exposes a novel dynamics based on Gibbs sampling dynamics. In the section IV we present the diagrams a×ρ0 that describe all
possible behaviors of the density of motivation as function of time for all possible values ofastarting from a initial density
ρ0. We have built a program that discover all possible
”pat-terns” forρevolving along time. We compare the diagrams using the two return functions (equations 1 and 3) here pro-posed. In the section V we present the results for the model in two dimensions. And last but not least, we present some
conclusions of our results in the section VI.
II. THE MODEL AND PREVIOUS WORKS
We considerLagents in the context of public good game, where each agent can invest a particular quantitySi. Agents invest cooperatively, i.e.,the average profit of the group influ-ences the investment motivation level of each agent, modelled by a binary variableσi∈ {0,1}(σi=1 means an agent is mo-tivated whileσi=0 means it is not). This abstraction aims at capturing issues such as insider information and economic prospects as perceived by agents.
We update the motivation at each time step by the profit rate gk(t):
σk(t+1) =
1 2(1+
Rk(t)
|Rk(t)|) ifRk(t)=0
0 otherwise
(4)
This update is based on a simple principle: an agent’s wealth relies on the wealth of the group. However, since agents are autonomous and there is room for cheating, we end up with two kinds of situations: one in which everyone is cooperative, and another where different types of individual behaviors are simulated.
Our previous work [7] has explored a particular one di-mensional lattice (1DP) with periodic boundary conditions (σ0=σL). For this particular contribution, the investment of
playeri depends only of the motivation of the player in the left (σi−1) and its proper motivation (σi) that are added, i.e., Si=σi+σi−1which assumes values in{0,1,2}. In this case,
we concluded (see [7]) that this dynamical system can be seen as a kind of cellular automata (CA) and we proved that the long-time behavior for the density of motivation is an oscilla-tion between two positive values (ρ1→ρ2→ρ1→ρ2...) or
the system goes to the fixed pointsρ→0 orρ→1.
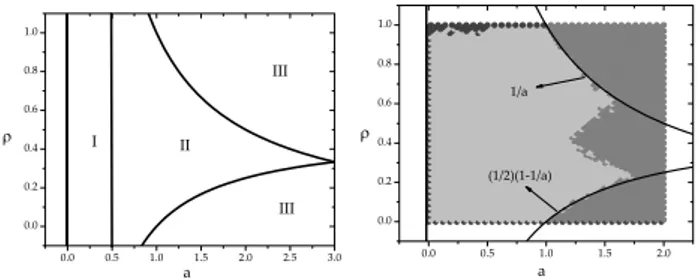
FIG. 1:Left plot: Phase diagram for the game in the caseb=0 for 1DP (analytical results). Right plot: Computing simulations corre-sponding to 1DP.
More precisely, the system is divided in three regions in the diagrama×ρ0, as can be seen in the Fig. 1: Region I
represents the situation where the system is attracted to an os-cillatory behavior, except forρ0=1 or 0. In these two cases,
two densities (no other situation can be observed). Inregion III, the system is always attracted toρ=1. However, the an-alytical results are not precise enough to say where exactly in the region II the system goes to oscillatory case and where the system goes to 1. In the next section, we will show simula-tions that explain this indetermination.
The same model was initially explored in small world net-works [8] also just for the profit function of equation 1. In this case, simulations were performed changing the influence of randomness of the small world (p) on the probability of a particular player to reach the bankruptcy, i.e., different power laws are observed for this probability as a function of the time. Finally the case of complete graph (the player interacts with all other players in the limitL→∞) has been studied by the author and collaborators in other contribution [9]. The authors analytically proved that the density just can assume four val-uesρ0, 1−ρ0, 0 and 1 and for any region of diagram(a,b), a
four states Markov chain describes the equilibrium states for density of motivation.
In the next section we present a novel dynamics that will be applied for simulations of the model in two dimensions.
III. A MODIFIED GIBBS SAMPLING FOR EVOLVING
THE PUBLIC GOOD GAME ON GRAPHS
In this part we propose a new dynamics for the public goods game to explore some other interesting evolutionary aspects alternatively to updating rules based on 4. First of all we ex-tended the possibilities of motivation, which now it is aq-state variable:σiassumes values in{0,1, ...,q−1}.
An interesting evolutionary dynamics in the public good game can be simply based on the return of all neighbors. For updating its motivation the player copies the motivation of one of the neighbors giving higher probability as much higher as is its return. A natural choice is a sampling process known as Gibbs sampling or heath bath algorithm that prescribes a transition probability between two motivation level as:
Pr(σi→σj;t) =
Ai jexp[Gj(t)/T]
∑nk=1Aikexp[Gk(t)/T]
. (5)
whereGj(t) is the return function (in this manuscriptRi(t) orRCi(t)) andT is an expansion parameter of the model that mimics the temperature in a magnetic model.
However, the use of these probabilities as so nullifies the effects ofa andbsince these probabilities are invariant over changes ofaandbfor both return functions used in this pa-per as can be easily seen. To solve this problem we added a extra rule in dynamics that considers only neighbors with positive return function for the sampling, reestablishing the dependency on parametersaandb. In this case the formula 5 is rewritten as
Mod
Pr(σi→σj;t) =
Ai jf(Gj)exp[Gj/T]
∑nk=1Aikf(Gk)exp[Gk(t)/T] (6) where f(Gj) =1 ifGj≥0 and f(Gj) =0 elsewhere.
In the section V we will show simulations of density of mo-tivation based on the dynamics here described. We have stud-ied the influence of noise, number of motivation levels (q) and temperature in the public good game in two dimensions.
IV. RESULTS I: COMPARING PHASE DIAGRAMS
UNDER DIFFERENT PROFIT FUNCTIONS
We performed numerical simulations to build diagrams de-scribing all possible evolutions starting from an initial config-uration with densityρ0=1/L∑Li=1σi(0)for each parameter ain absence of noise(b=0). Here, it is considered a binary motivation level (σi∈ {0,1}) and for a suitable comparison, both return functions (see equations 1 and 3) were used.
In these conditions, the graphs studied in this manuscript presented 3 distinct behaviors: (1) the system goes to oscil-latory behavior between two densitiesρ1 and ρ2 or (2) all
players become motivatedρ→1 or all players become un-motivatedρ→0.
A simplified version of the algorithm used to build these diagrams is shown in the table I. This algorithm attributes
ρ∞=0 for the case which all players remain unmotivated
att→∞ ,ρ∞=1 when they remain motivated t→∞and ρ∞=1/2 for oscillatory behavior at long times (here the
attri-bution is symbolical). A thresholdnrepis employed to recog-nize a ”pattern” ofρ∞=1 (a robust sequence of 1’s) because
for the recognition ofρ∞=0 is necessary just to find the first
occurrenceρ=0 and complementarilyρ∞=1/2 is assumed
when none of the two first situations occur. In the Fig. 1 (right side) we show computing experiments that complete the lacks from theoretical predictions for 1DP (left side in the same fig-ure). In the region II, we now can see clearly where is the region corresponding toρ=1 and where the oscillatory be-havior happens. The theoretical predictions [7] have claimed coexistence of these two behaviors in the region I, but it does not state anything about its partition. Clearly the most part is in oscillatory behavior since the dark gray corresponds to phaseρ=0, the light gray to the oscillatory behavior while the gray corresponds to phaseρ=1.
FIG. 2: Left plot: Diagrama×ρ0 for theρ(t→∞)in the one-dimensional public good game using the return function from equa-tion 1Right plot: The same plot of left plot considering the alterna-tive return function (eq.3).
Pseudocode: Diagrama×ρ0
input: amin,amax,ρmin,ρmax,∆a,∆ρ0,nmc,L,[Ai j]i,j=1,...,L,nrep
output: ρ∞(a,ρ0)
1 forafromaminby∆atoamax
2 forρ0fromρminby∆ρ0toρmax
3 ·Generate a network with densityρ0
4 j=1;
5 while ( (j<nmc).and.(ρ(j)=0) ) then
6 ·ComputeRi(j)for all players (i=1, ...,L);
7 ·Update the motivation level :σi(j) = (1/2)(1+Ri(j)/|Ri(j)|);
8 ·Store the density of motivated playersρ(j)and j=j+1;
9 endfor
10 count0=0;count1=0;count1/2=0;
11 if (ρ(j) =0) then 12 count0=nrep;
13 else
14 count1=1; j=1;
15 while (count1<nrep) then
16 j:= j+1; α:=ρ(j−1) +ρ(j); count1:=δα,2·(1+count1);
17 endwhile
18 endif
20 if (count0=nrep) then
21 ρ∞=0; 22 else
23 If (count1=nrep) thenρ∞=1;elseρ∞=1/2;endif 24 endif
25 print(a,ρ0,ρ∞) 26 endfor
27 endfor 28 end
TABLE I: Algorithm
two nearest neighbors. We elaborate two diagrams consid-ering for each one of them a different return function: Ri(t) (Si∈ {0,1,2,3}) andRCi(t)(Si∈ {0,1,3/2,2}), respectively shown in the left and right side plots of the Fig. 2. In the left plot, we can note the arising of the one new ”sawtooth” inside of oscillatory behavior region (region II from the Fig. 1). Sur-prisingly, when the return functionRCi(t)is used (right plot of 2), two smaller sawtooth appear.
The problem becomes more interesting if we consider time evolving in small world networks. For the sake of simplic-ity we consider in this paper small world networks generated from rings with nearest first and second neighbors (k=2). First of all, we performed many simulations to test the influ-ence of the different initial small worlds generated with same p on the diagramsa×ρ0. Although we found the results to
be highly sensible to different pvalues, the diagramsa×ρ0
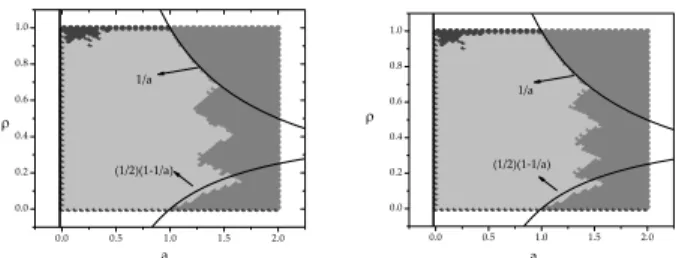
remain qualitatively unchangeable under different initial con-figurations of small worlds with the same p. After this check, we perform simulations changing the value ofp. In the Fig. 3, we can see the different diagrams for different values ofp. It
was usedp=0, 0.5 and 1 for building the diagrams. The left plots were obtained usingRi(t)and the right plots using the return functionRCi(t). It is particularly interesting the effects for the second return function.
For instance, ifp=0.5, a lot of dark gray regions (no mo-tivation regions) emerge in the diagram, differently from the plot usingRi(t). This behavior motivated us to study the den-sity of dark gray in an effective region of the diagrama×ρ0.
More precisely we are interested in the complement of this amount, that in our problem can be interpreted as thesurvival probability of pro-social behavior:
Pr(ρ→0|p) =1− 1
Nn(ρ→0|p),
wheren(ρ→0|p)is the number of points(a,ρ0)such that ρ→0 given a small world with parameter p andN points on the grid [amin,amax]×[ρmin,ρmax]. For our experiments, ∆a=0.025 and ∆ρ0=0.025 were used as well as amin = ρmin=0 andamax=2 andρmax=1, resulting inN=3200
FIG. 3: The plots in the left side shows different diagrams for the different small worlds, respectively (from top to bottom)p=0,p= 0.5 andp=1 using 1. The right side plots corresponds to the same plots from return functionRCi(t).
the Fig. 4 (10 pvalues were simulated). A convex behavior as function of pis observed for the probability of the popu-lation to remain motivated whent→∞. A minimum for this probability happens when p∼0.6, indicating less pro-social behavior in intermediate small worlds.
It is important to mention that we also simulated under the same conditionsb=0 and using binary motivation level, the diagramsa×ρ0for the model in two dimensions using lattices
50×50 and both return functions here defined. The results found were highly similar to the case of a small world when p=0 (see again the two plots on the top of the Fig. 3) and for this reason were not shown in this paper.
We also explore some simulations for the case where a player interacts with all players in a complete graph (Ai j=1 for alli,j=1, ...,L) under mean field approximation ρ(t) = limL→∞(1/L)∑Li=1σi(t). In this case the possibilities are
re-duced to four state of densities, since the population starts in
ρ(0) =ρ0,ρ(t)just will assume values in {0,ρ0,1−ρ0,1}.
No other possibility can occur because players in the same state can only change to the same state (for a extensive analy-sis of mean field approximation for this model, using the profit function 1 see [9]).
We have also compared the effects of two return functions
FIG. 4: Survival probability of motivation, Pr(ρ→0|p)as function of disorderpin the small world network.
for the complete graph under mean field behavior. For that, a graph withL=105points was used. In the Fig. 5, the left side plot shows the diagram for return functionRi(t). The straight lines comes from analytical results (see [9]) and are
ρ=7/2−(5/2)a, ρ= (5/2)(a−1), ρ= (15/4)(a−2/3) andρ= (7/2)−(15/4)a. We can observe that our numer-ical simulations corroborate the analytnumer-ical predictions. Cu-riously, when we use the return function from equation 3 the region corresponding to ρ→0 was reduced and the re-gion corresponding to the oscillatory behavior enlarged. The region of oscillatory behavior before determined by straight linesρ=7/2−(5/2)a andρ= (5/2)(a−1)in the right is now determined by functionsρ=a−1.75 andρ=1−a−1.75 respectively, which were numerically adjusted.
FIG. 5: Diagrama×ρ0for the complete graph (mean field approxi-mation). The left plot corresponds to the first return function and the right plot to second one.
V. RESULTS II: MONTE CARLO SIMULATIONS FOR THE TWO DIMENSIONAL MODEL
The noise effects (b=0)can highly influence the density of states in function of the time and performing simulations with a large number of repetitions is more interesting in this case. Looking for the model in two dimensions but still in two-level motivation, simulations were performed using only dynamics explored until now, which the updating is given according to the equation 4. In this case only the return functionRC
i(t)was used.
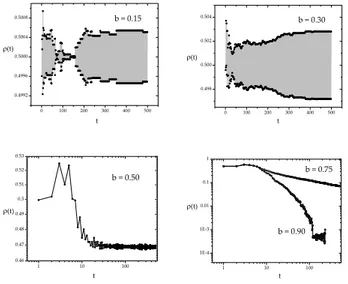
Considering ansample=1000 repetitions in a system 50× 50, we analyzed time evolving ofρ(t)consideringρ0=1/2. In the Fig.6 are presented 4 plots, the three first corresponding tob=0.15,b=0.30,b=0.50 respectively and the last plot in this same figure shows two cases: b=0.75 andb=0.90. For all plots we consider a=1, which is exactly the border line between profit and financial damage.
FIG. 6: Time evolution of density of motivation averaged over nsample=1000 for different values of noise keepinga=1.
We can observe that lower values of noise b=0.15 and b=0.30 shows that in the most of repetitions the system goes to an oscillatory behavior whent→∞(ρ1→ρ2→ρ1→ρ2...)
withρ1andρ2being different for different runs. In some of
the runsρ→0 orρ→1 can occurs, justifying the interesting behavior observed in the plot.
Finally for an intermediate value the model presents a sat-uration phenomena in the density of motivation as can be ob-served forb=0.50. For higher values ofbwe finally arrive on a power law behavior whenb=0.75,ρ(t)∼t−θ where
θ=0.335(3). After setting b=0.90 an exponential tail is observed.
Here we test the approach developed in the section III for the two dimensional public good game. First of all we test the modified Gibbs sampling procedure fixingT =103(β= 10−3)for the samen
sample=1000, but now usinga=2 and
b=0, changing the number of motivation levels (q)1, as can be observed in the Fig. 7.
FIG. 7: Monte Carlo simulations of public good game in two di-mensions using the modified Gibbs sampling. This figure shows the effects of the number of motivation states in time evolving of the density of motivation. For all cases,a=2 andb=0 were used .
The inside plot in this same figure shows particularly the caseq=3, that notoriously present a power law behavior dis-carding the initial 50 MCsteps. We foundθ=0.433(2).
Last but not least a complete analysis we study the noise and temperature effects on the two dimensional simulations using the modified gibbs sampling dynamics.
FIG. 8: This figure shows the noise effects (left plot) and temperature effects (right plot) in the density of motivated players using the Gibbs sampling dynamics.
Considering here also the parametersa=2 andb=0 we can see the noise effects (left side plot) and temperature effects (right side plot) in the Fig. 8. Both plots show that the system is highly sensible to these parameters, changing the density of motivation as a function of the time. In these plots we used q=3.
VI. CONCLUSIONS
We have analyzed in this contribution a new way to explain how the pro-social behavior can emerge in an artificial
soci-1Here the density of motivation is normalized:ρ(t) = (qL)−1
ety based in a known game from experimental economics: the public good game. To model this behavior a motivation variable was introduced, based on previous contributions of the same author of this manuscript. This motivation initially imagined a binary variable which corresponds to the player being motivated or not, and is updated according to a return function. The investment in the public good is obtained ac-cording to combinations of motivations among neighbor play-ers and an analysis of different graphs is performed. Our first contribution was to perform a comparative analysis of diagrams for the motivation average behavior at long times starting from a graph with different initial values of density of the motivated players,ρ0, and different values of
determinis-tic return parametera. We introduced a new return function that directly considers the motivation average of the neigh-borhood. A comparison with the return function of previous works was performed. In small world networks our results shows the survival probability of the pro-social behavior has
its lowest value in small worlds withp∼0.6.
Finally we have introduced a evolutionary dynamics to ex-plore the game in the two dimensional lattice. In this case we analyzed the model considering the motivation with more pos-sibilities (q−states motivation). The motivation change of a player follows a modified Gibbs sampling prescription which establishes higher probability of copying the motivation of the neighbor with higher payoff – discarding the negative ones. Our results show a strong dependence of density of motiva-tion withqandb(the noise amplitude of the return).
Acknowledgments
R. da Silva thank CNPq for the financial support to this work.
[1] G. Sz¨ab´o, G. F´ath, Evolutionary games on graphs, Phys. Rep. 446, 97 (2007).
[2] D. Ashlock,Evolutionary Computation for Modeling and Opti-mization, Springer, New York, (2005)
[3] J. M. Smith, Evolution and the Theory of Games,Cambridge University Press (1982)
[4] T. N. Cason, T. Saijo, and T. Yamato, Voluntary Participation and Spite in Public Good Provision Experiments: An International Comparison, Experimental Economics,5, 133 (2002).
[5] O. Gurerk, B. Irlenbusch, and B. Rockenbach, Science,312, 108 (2006).
[6] R. Mark Isaac, J. M. Walker, and A. Williams, Journal of Public
Economics54, 1 (1994).
[7] R. da Silva, A. L. C. Bazzan, A. T. Baraviera, and S. R. Dahmen, Physica A,371, 610 (2006).
[8] R. da Silva, A. T. Baraviera, S. R. Dahmen, and A. L. C. Baz-zan, Dynamics of a Public Investiment Game: from Nearest-Neighbor Lattices to Small-World Network, Lecture Notes in Economic and Mathematical Systems584, 221 (2006). [9] R.da Silva, L. F. Guidi, and A. T. Baraviera, The public good