www.ccarevista.ufc.br ISSN 1806-6690
Optimum experimental plot size in the castor bean
1Tamanho ótimo da parcela experimental em mamoneira
Orlando Melo Sampaio Filho2, Sebastião de Oliveira e Silva3*, Sérgio Luiz Rodrigues Donato4, Simone Alves
Silva3 and Mauricio dos Santos da Silva5
ABSTRACT - Optimum plot size is of fundamental importance for the results, precision and cost-effectiveness of experiments. The aim of this study therefore, was to estimate optimum plot size in a strain of the castor bean by means of the Linear Response Plateau Model (LRPM). The experiment consisted of a test for uniformity, carried out in Cruz das Almas, in the State of Bahia, Brazil. The UFRB-222 strain was used, which was planted at a spacing of 3 m x 1 m, in 10 rows of 37 plants each. The eight central rows were considered, each with 35 plants per row giving a total of 280 plants and a working area of 840 m2. For the evaluations, each plant was taken as one basic unit (bu) with an area of 3 m2, resulting in 280 bu.
The characteristics under evaluation were the number of racemes harvested, the mean length of the first three racemes, number of seeds per raceme, seed weight per raceme, raceme weight per plant, number of seeds per plant and productivity. For productivity and its components, the optimum plot size is 11 experimental units in an area of 33 m2, at a spacing of 3 m
between rows and 1 m between plants.
Key words:Ricinus communis L.. Plateau model. Experimental accuracy. Uniformity.
RESUMO - O tamanho ótimo de parcelas é de fundamental importância para o aproveitamento, precisão e relação custo benefício em experimentos. Assim, objetivou-se estimar o tamanho ótimo de parcela envolvendo linhagem de mamoneira por meio do Modelo Linear de Resposta Platô (MLRP). O experimento constituiu-se de um ensaio de uniformidade, conduzido em Cruz das Almas, BA. Utilizou-se a linhagem UFRB-222, que foi plantada no espaçamento de 3 m x 1 m, com 10 fileiras de 37 plantas cada. Foram consideradas como úteis as oito fileiras centrais, com 35 plantas por fileira, num total de 280 plantas e área útil de 840 m2. Nas avaliações aferidas, cada planta foi considerada como uma unidade básica (ub), área de 3 m2, perfazendo
assim, 280 unidades básicas (ubs). Os caracteres avaliados foram o número de racemos colhidos, média do comprimento dos três primeiros racemos, número de sementes do racemo, peso de sementes do racemo, peso do racemo por planta, número de sementes por planta e produtividade. O tamanho ótimo de parcela é de 11 unidades experimentais, para a produtividade e seus componentes, sendo a área de 33 m2 com espaçamento de 3 m entre fila e 1 m entre plantas.
Palavras-chave:Ricinus communis L.. Plateau model. Experimental accuracy. Uniformity.
DOI: 10.5935/1806-6690.20190032 *Author for correspondence
Received for publication in 21/10/2017; approved in 15/04/2018
1Parte da Tese de Doutorado do primeiro autor apresentada na Universidade Federal do Recôncavo da Bahia
2Instituto Federal de Educação Ciência e Tecnologia Baiano,Campus Governador Mangabeira, Governador Mangabeira-BA, Brasil, nandaoagrufba@
hotmail.com (ORCID ID 0000-0002-5357-0301)
3Centro de Ciências Agrárias Ambientais e Biológicas, Universidade Federal do Recôncavo da Bahia, Cruz das Almas-BA, Brasil, [email protected]
(ORCID ID 0000-0002-1276-5233), [email protected] (ORCID ID 0000-0002-3017-6133)
4Instituto Federal de Educação Ciência e Tecnologia Baiano,Campus Guanambi, Guanambi-BA, Brasil, [email protected] (ORCID ID
0000-0002-7719-4662)
5Programa de Pós-Graduação em Ciências Agrárias, Universidade Federal do Recôncavo da Bahia, Centro de Ciências Agrárias Ambientais e Biológicas,
INTRODUCTION
The castor bean (Ricinus communis L.) was
introduced to Brazil by the Portuguese during the colonial period. The oilseed, whose main products or byproducts are the oil and cake, has considerable economic potential (SILVAet al., 2016).
Among the work carried out with the castor bean crop in Brazil and abroad, it is important to highlight experiments conducted by Guoet al. (2014), who verified
ricin toxicity in living beings; Boer and Cotingting (2014), who found wide use of the castor bean in medicinal compounds; Severino, Mendes and Lima (2015), who investigated the relationship between the composition characteristics of the castor bean seed and the oil content; and Fiorezeet al. (2016), who associated the influence of
sowing density and the method of growing the plants with the agronomic characteristics of the species. On the other hand, research related to estimating the size and shape of experimental plots in the castor bean is still scarce, but includes the work of Patelet al. (2005) and Paludoet al.
(2015).
In agronomic experimentation, the choice of plot size for field experiments should be made with the aim of minimising variations that exist between observations made in different plots submitted to the same treatments
(OLIVEIRA et al., 2014). There are methodologies for
this purpose, such as the maximum curvature of the coefficient of variation and the linear response plateau
method (OLIVEIRA et al., 2014; PARANAÍBA;
FERREIRA; MORAES, 2009); the antitonic regression
test method (BRITOet al., 2012); the maximum distance
method (LORENTZ; ERICHSEN; LÚCIO, 2012) and the method of bootstrap simulation and substitution (BRITO
et al., 2014). Each of these is used to determine plot
size without the need to calculate the number of plots
(CELANTIet al., 2016).
The Linear Response Plateau Model allows the comparison of alternative combinations of lines and plateaus, and chooses the combination with the smallest sum of squared deviations as the best adjustment option
(LEONARDOet al., 2014). This method has been used
in various areas and for different purposes, as seen in the work of Silvaet al. (2012), in experiments with the
radish; Acunha et al. (2014), in estimating sugarcane
production; Nomelini et al. (2014), in applying seed
germination test methodology in Acacia polyphylla
D.C.; Oliveiraet al. (2014), for estimating the optimum
size of plots in banana genotypes; Bheringet al. (2015),
in determining the minimum number of Jatropha
curcas L. required plants to maintain and expand
the germplasm bank; and Castro et al. (2016), in the
methionine + cystine ratio in quails.
In view of the above, the aim was to estimate the optimum plot size in experiments involving castor bean genotypes by means of the Linear Response Plateau Model (LRPM).
MATERIAL AND METHODS
The trial was carried out between April 2014 and March 2015, under a rainfed system, in the experimental area of the Nucleus for Genetic Improvement and Biotechnology (NBIO) at the Centre for Agricultural, Environmental and Biological Sciences (CCAAB) of the Federal University of Recôncavo da Bahia (UFRB), in Cruz das Almas, located at 12°40’19’’ S and 39°06’22’’ W and an altitude of 220 m. According to the Köppen classification, The climate is type Aw to Am, tropical warm and humid, with an annual mean temperature of 24.5 °C, relative humidity of 80% and annual average rainfall of 1,249.7 mm (AGRITEMPO, 2017). The soil is classified as a well-drained, deep, dystrophic Yellow Latosol, of medium texture and a medium clay content (BRAZILIAN AGRICULTURAL RESEARCH CORPORATION -EMBRAPA, 1993).
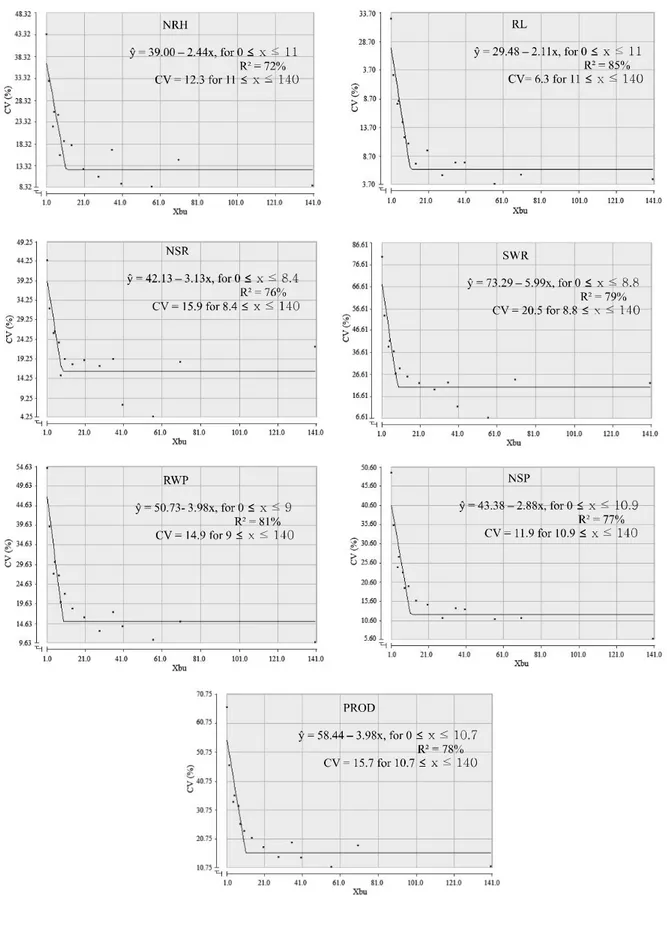
Seeds developed by the Centre for Genetic Improvement and Biotechnology (NBIO) of the CCAAB were used for sowing, and the following characteristics were evaluated: NRH - the number of racemes harvested, RL the mean length of the first three racemes, NSR -number of seeds per raceme, SWR - seed weight per raceme, RWP - raceme weight per plant, NSP - number of seeds per plant, and PROD - productivity. Each measurement was taken as per the Instructions for applying the tests of distinguishability, homogeneity and stability in cultivars of the castor bean (Ricinus communis L.) (BRASIL, 2008).
The experiment consisted of a test of uniformity, carried out on 10 rows of 37 plants each at a spacing of 3 m x 1 m, considering the eight central rows with 35 plants per row, giving a total of 280 plants and a working area of 840 m². For the evaluations, each plant was considered as one basic unit (bu) with an area of 3 m², to give 280 bu, based on a blank map of the experiment. These units were combined to form 15 different plot sizes, with the number of replications for each plot size being limited by its working area.
The Linear Response Plateau Model (LRPM) originates from an adjustment of the regression between the value of the coefficient of variation and the value of the
plot in basic units (CASTRO et al., 2016). The optimum
the increase in plot size in basic units (Xi). This model is explained by the equation:
(1)
where: CVi corresponds to the coefficient of variation (%) seen in the experiment; Xi is the size of the plot in basic units, Xcis the optimum plot size represented by the point of intersection for a plateau relative to the abscissa; P is
the coefficient of variation at the point corresponding to the plateau; εi is the error associated with CVi, considered
to be normally and independently distributed, with a mean value of0 and constant variance of σ2ε.
The estimated value of Xc is the optimum plot
size (in basic units) that is recommended for this type of experiment. Thus, the optimum plot size was estimated by the expression , where: , and represent the estimated values of the equation parameters.
Adjustments for each variable were made using the SAEG software (RIBEIRO JÚNIOR, 2001).
RESULTS AND DISCUSSION
High coefficients of variation are usually found in studies carried out with the castor bean, as demonstrated
by Fernandes et al. (2015), who evaluated fertiliser and
raceme order in the agronomic performance of the ‘BRS Nordestina’ castor bean in Remígio in the State of Paraíba, and found CV values ranging from 9.64 to 170.72%. This is probably due to the low number of replications and/or the inadequate plot size.
Mean coefficients of variation for the characteristics under evaluation (Table 1) were obtained for each plot size by dividing the area into 15 distinct plot sizes. The values for the coefficients of variation varied from 3.71% for raceme length to 79.96% for seed weight per raceme.
It was also found that values for the coefficients of variation of the various planned plot sizes generally decreased with the increase in plot size, but at differing rates, i.e. non-linear. The trend of an inverse relationship between plot size and CV, although showing some variation, is a result of changes in the shape of the plot, which may contribute to the increase in variability. This result agrees with those obtained by Brum et al. (2016),
who calculated the optimum plot size for evaluating the weight and diameter of broccoli heads, and determined that the highest CV was seen at the smallest plot size, i.e. they found reductions in CV at various decreasing rates for increases in plot size.
The shape of the plot, expressed by the ratio between its length and width, affects experimental precision, which
Table 1 - Coefficients of variation (CV), as a function of plot size in basic units (Xbu), for yield component characteristics in the castor bean
1NRH: number of racemes harvested; RL: raceme length; NSR: number of seeds per raceme; SWR: seed weight per raceme; RWP: raceme weight per
plant; NSP: number of seeds per plant; PROD: productivity; R x P/R: shape of the plot in number of rows and number of plants per row
Shape Dimensions X(bu) CV(%)1
R x P/R NRH RL NSR SWR RWP NSP PROD
Plant 1 x 1 1 43.39 32.49 44.39 79.96 53.96 48.94 66.14
Row 2 x 1 2 32.54 22.72 32.00 53.11 39.16 35.37 45.89
Row 4 x 1 4 22.05 17.76 25.55 39.18 27.20 24.36 33.19
Row 1 x 5 5 25.44 18.14 26.12 41.89 30.23 27.06 35.57
Row 1 x 7 7 24.93 14.53 23.17 37.07 26.63 23.04 31.92
Row 8 x 1 8 15.69 11.87 14.96 26.86 19.87 18.89 25.70
Rectangular 2 x 5 10 18.81 10.82 19.08 29.21 21.97 19.42 23.35
Rectangular 2 x 7 14 17.89 7.18 17.62 25.55 18.22 15.52 20.73
Rectangular 4 x 5 20 12.48 9.48 18.71 22.53 15.90 14.55 17.49
Rectangular 4 x 7 28 10.74 5.29 17.36 19.61 12.45 11.07 14.31
Row 1 x 35 35 16.92 7.45 19.03 22.86 17.30 13.69 19.19
Rectangular 8 x 5 40 8.98 7.41 7.21 11.80 13.69 13.38 14.01
Rectangular 8 x 7 56 8.33 3.71 4.25 6.61 10.24 10.65 10.76
Rectangular 2 x 35 70 14.61 5.35 18.45 23.87 14.83 10.97 18.15
can be seen by verifying the behaviour of the coefficients of variation of the different shapes of plots of similar sizes. Plots whose larger dimension is perpendicular to the rows of plants, irrespective of shape and whether in rows or rectangular, generally have a lower coefficient of variation (Table 1), and show a decrease in variability perpendicular to the rows of plants. This explains the increase in CV with the increase in plot size in some cases (DONATO
et al., 2008). In the present study, when comparing the
CV of plots with a similar number of plants, for example the variable PROD, plots with four basic units (4R x 1P/ R) have a CV of 33.19%, while in plots with five basic units (1R x 5P/R) the CV increases to 35.57%, a behaviour common to other variables.
Application of the Linear Response Plateau Model (LRPM) allowed the behaviour of the variability measured by the CV to be described for all sizes of simulated plot. In terms of experimental quality, adjustment of the data to the regression model with plateau can be considered good for all the characteristics, with values for the coefficient of determination varying from 72.34% for NRH (number of racemes harvested) to 84.79% for RL (raceme length).
In the Linear Response Plateau Model, the optimum plot size equals the value where the linear model becomes a plateau in relation to the abscissa (LEONARDOet al.,
2014). The plateau was reached at a value for CV(X) of less than 15%, except for the variables NSR (number of seeds per raceme), SWR (seed weight per raceme) and PROD (productivity), where the CV(X) at the plateau was 15.89%, 20.51% and 15.73% respectively.
The estimates of optimum plot size (Xbu) ranged
from 8.4 (bu) for NSR, corresponding to a coefficient of variation of 15.89% at the plateau, to 11 (bu) for NRC and RL, representing a plateau at a coefficient of variation of 12.33% and 6.29% respectively. The plot sizes found were similar to those found by Costa et al.
(2006), who used 11 plants per plot for the variables start of flowering, number of racemes per plant, effective length of the primary raceme, plant height, production potential and seed oil content; while Passoset al. (2010)
used 10 plants for the variables plant height, number of days from planting to flowering, number of fruit for three racemes, number of seeds of three racemes and seed weight of three racemes. However, some authors have used larger plots, such as Torres et al. (2016) with 20
plants, and Sampaio Filho et al. (2011) with 30 castor
bean plants per experimental plot.
According to Figure 1, the maximum value for the basic units tested in the regression is 140. A value
of 10.7276 bu is the recommended level of X to obtain
the maximum value of Y, estimated at 15.7286, i.e. after
10.7276 basic units an increase in plot size does not reduce the coefficient of variation, e.g. it does not improve experimental accuracy.
According to Acunha et al. (2014), when there
are models and methods that seem to underestimate a satisfactory sample size, and others that perhaps overestimate it, a practical recommendation would be to take an average value among the results obtained for each variable, which would be quite reasonable. However, when adopting this average value, there exists the possibility that characteristics representing larger-sized plots will not be considered. It is therefore recommended that 11 plants per plot would be the most efficient, since this number allows good results for all the characteristics.
Using the methods of Modified Maximum Curvature and Maximum Curvature of the Variance between plots, a plot size of eight plants is recommended for the production characteristics of the castor bean
(PALUDOet al., 2015).
CONCLUSIONS
1. The optimum plot size is 11 basic units, with an area
of 33 m2 and a spacing of 3 m between rows and 1 m
between plants;
2. The data show a good fit to the Linear Response Plateau Model, with the estimates for optimum plot size varying with the characteristics under evaluation.
REFERENCES
ACUNHA, J. G.et al. Suficiência amostral para a estimação da produção de cana-de-açúcar.Ciência Rural, v. 44, n. 10, p. 1747-1754, 2014.
AGRITEMPO.Sistema de Monitoramento Agrometeorológico. 2017. Disponível em: <http://www.agritempo.gov.br/agroclima/ sumario>. Acesso em: 07 abr. 2018.
BHERING, L. L. et al. Plateau regression reveals that eight plants per accession are representative forJatropha germplasm bank.Industrial Crops and Products, v. 65, p. 210-215, 2015. BOER, H.; COTINGTING, C. Medicinal plants for women’s healthcare in Southeast Asia: a meta-analysis of their traditional use, chemical constituents, and pharmacology. Journal Ethnopharmacology, v. 15, n. 2, p. 747-767, 2014.
BRITO, M. C. M.et al. Avaliação do desempenho do algoritmo de reamostragem bootstrap na verificação da estimação do tamanho ótimo da parcela.Revista da Estatística, v. 3, n. 3, p. 255-259,
2014.
BRITO, M. C. M.et al. Estimação do tamanho ótimo de parcela via regressão antitônica.Revista Brasileira de Biometria, v. 30, n. 3, p. 353-366, 2012.
BRUM, B.et al. Tamanho ótimo de parcela para avaliação da massa e diâmetro de cabeças de brócolis.Ciência Rural, v. 46,
n. 3, p. 447-463, 2016.
CASTRO, M. R. et al. Relações metionina + cistina: lisina digestíveis para codornas de corte machos em fase de terminação.
Revista Brasileira de Saúde e Produção Animal, v. 17, n. 2,
p. 162-173, 2016.
CELANTI, H. F. et al. Plot size in the evaluation of papaya seedlings ‘Baixinho de Santa Amália’ in tubes. Revista Brasileira de Fruticultura, v. 38, n. 3, p. 1-15, 2016.
COSTA, M. D. et al. Divergência genética entre acessos e cultivares de mamoneira por meio de estatística multivariada.
Pesquisa Agropecuária Brasileira, v. 41, n. 11, p. 1617-1622, 2006.
DONATO, S. L. R.et al. Estimativas de tamanho de parcelas para avaliação de descritores fenotípicos em bananeira.
Pesquisa Agropecuária Brasileira, v. 43, n. 8, p. 957-969, 2008.
EMPRESA BRASILEIRA DE PESQUISA AGROPECUÁRIA. Serviço Nacional de Levantamento e Conservação de Solos (Rio de Janeiro, RJ). Levantamento detalhado dos solos da Universidade Federal do Recôncavo da Bahia. Cruz das Almas: Embrapa/CNPMF, 1993. 126 p. (Boletim de Pesquisa, 7). FERNANDES, J. D. et al. Adubação e ordem do racemo no desempenho agronômico da mamoneira BRS Nordestina.
Revista Caatinga, v. 28, n. 1, p. 48-57, 2015.
FIOREZE, S. L.et al. Agronomic characteristics of the castor bean as affected by cultivation method and planting density.
Revista Ciência Agronômica, v. 47, n. 1, p. 86-92, 2016. GUO, Z.et al. Proteomic study of differential protein expression in mouse lung tissues after aerosolized ricin poisoning.
International Journal of Molecular Sciences, v. 15, n. 5, p.
7281-7292, 2014.
LEONARDO, F. D. A. P. et al. Optimum size of the experimental plot of pineapple ‘Victory’.Revista Brasileira de Fruticultura, v. 36, n. 4, p. 909-916, 2014.
LORENTZ, L. H.; ERICHSEN, R.; LÚCIO, A. D. Proposta de método para estimação de tamanho de parcela para culturas agrícolas.Revista Ceres, v. 59, n. 6, p. 772-780, 2012. NOMELINI, Q. S. S. et al. Estimativa do tamanho ótimo de parcelas para testes de germinação de sementes da espécie Acacia polyphyllaD. C.Sigmae, v. 3, n. 2, p. 88-94, 2014. OLIVEIRA, E. A. et al. componentes principais na estimação do tamanho ótimo de parcelas em experimentos envolvendo genótipos de bananeira.Revista Brasileira de Biometria, v. 32, n. 2, p. 190-200, 2014.
PALUDO, A. L.et al. Tamanho de parcela e número de repetições para mamoneira em diferentes espaçamentos entre plantas.
Revista Caatinga, v. 28, n. 4, p. 253-258, 2015.
PARANAÍBA, P. F.; FERREIRA, D. F.; MORAES, A. R. Tamanho ótimo de parcelas experimentais: proposição de métodos de estimação.Revista Brasileira de Biometria, v. 27, n. 2, p. 255-268, 2009.
PASSOS, A. R. et al. Parâmetros genéticos de caracteres agronômicos em genótipos de mamoneira. Pesquisa Agropecuária Brasileira, v. 45, n. 7, p. 709-714, 2010. PATEL, J. K.et al. Estimation of optimum size and shape of plot for field experiments on irrigated castor been (Ricinus communis L.).Journal of the Indian Society of Agricultural Statistic, v. 59, n. 1, p. 32-47, 2005.
RIBEIRO JÚNIOR, J. I.Análises estatísticas no SAEG. Viçosa,
MG: UFV, 2001. 301 p.
SAMPAIO FILHO, O. M.et al. Análise descritiva de cultivares de mamoneira em dois anos de cultivo no recôncavo baiano.
Revista Brasileira de Educação Ambiental, v. 6, n. 1, p.
28-34, 2011.
SEVERINO, L. S.; MENDES, B. S.; LIMA, G. S. Seed coat specific weight and endosperm composition define the oil content of castor seed.Industrial Crops and Products, v. 75, p. 14-19, 2015.
SILVA, L. F. D. O. et al. Tamanho ótimo de parcela para experimentos com rabanetes.Revista Ceres, v. 59, n. 5, p. 624-629, 2012.
SILVA, M. F. D. O. et al. Análise da oferta brasileira de mamona, no período de 1961 a 2012. Revista Estudo e Debate, v. 22, n. 2, p. 195-213, 2016.
TORRES, F. E.et al. Agronomic performance of castor under different growing conditions.Bioscience Journal, v. 32, n. 1, p. 55-60, 2016.