CHEMOMETRY USE IN THE EVALUATION OF THE SANYA BAY WATER QUALITY
Jun-De Dong1, 2, 3,*, Yan-Ying Zhang1, 2, 3, You-Shao Wang2, 3, Mei-Lin Wu2 Si Zhang1, 3 and Chuang-Hua Cai1, 3
1
Key Laboratory of Marine Bio-resources Sustainable Utilization South China Sea Institute of Oceanology
(Chinese Academy of Sciences, Guangzhou 510301, China)
2
Key Laboratory of Tropical Marine Environmental Dynamics South China Sea Institute of Oceanology
(Chinese Academy of Sciences, Guangzhou 510301, China)
3
Tropical Marine Biological Research Station in Hainan (Chinese Academy of Sciences, Sanya 572000, China)
*Corresponding author: [email protected]
A
B S T R A C TIn this study, chemometric method is employed to identify anthropogenic effects on the water quality in Sanya Bay, South China Sea, and its marine and natural characteristics. Principal component analysis has extracted the four latent factors, thus explaining 85.52% of the total variance. Cluster analysis and principal component analysis have identified three different patterns of water quality based on anthropogenic effects and marine characteristics: Cluster I located in the outer and middle parts of the bay, Cluster II close to downtown Sanya, Cluster III located in the Sanya River estuary. In terms of the temporal pattern, principal component analysis and cluster analysis have distinguished the dry season from November to the following April, and the rainy season from May to October. The temporal pattern is related to climate and natural characteristics. The similarity index between variables and scores of samples can further distinguish the contribution of the variables to the samples. Both the polluting sources external to the Sanya River and the water from the South China Sea exercise an important influence on the water quality in Sanya Bay. These results may be valuable for socioeconomic development and human health in the Sanya Bay area.
R
E S U M ONo presente estudo foi realizada a identificação dos efeitos antropogênicos e das características naturais marinhas das águas da Baía de Sanya, situada ao sul do Mar da China, através de método quimiométrico. A análise de componentes principais (PCA) aplicada aos dados extraiu quatro eixos que explicaram 85,52% da variância total dos dados. Através das análises de Agrupamento e PCA foram identificados três padrões diferentes de qualidade das águas, baseados nos efeitos antropogênicos e nas características marinhas: Grupo I, localizado nas partes externa e mediana da baía; Grupo II, próximo do centro urbano de Sanya; Grupo III, localizado no estuário do Rio Sanya. Quanto ao padrão temporal, as referidas análises distinguiram uma estação seca, de novembro a abril, e uma estação chuvosa, de maio a outubro, relacionadas ao clima e características naturais. Foi visto que tanto a fonte poluidora externa, representada pelo Rio Sanya, quanto as águas do Mar do Sul da China influenciam a qualidade das águas da Baía de Sanya. Esses resultados podem ser relevantes quando considerados sob o ponto de vista do desenvolvimento socioeconômico e de saúde humana dessa região.
Descriptors: Chemometric method; Sanya Bay, Hainan, China; Water quality; Nutrient; temporal and spatial variations
Descritores: Método quimiométrico; Efeito antropogênico; Baía de Sanya; Qualidade da água; Variação espacial; Variação temporal.
I
NTRODUCTIONCoastal bays are subject to a number of environmental factors that reflect the interactions
coastal areas have exercised a great influence on the ecological environment of the bays. The increase of the nutrient load in the Baltic Sea has changed the biological structure and ecological processes in both coastal and open sea areas (BONSDORFF et al., 2002). Eutrophication of coastal ecosystems from nutrient over-enrichment is widespread (NIXON, 1993). The increasing anthropogenic impact has lead to the degradation of the marine ecosystem in the Black Sea (MEE, 1992). There has been an increase in the anthropogenic effects on the loading and transport rates of the limiting plant nutrients nitrogen (N), phosphorus (P), and silica (Si) during the last century (CONLEY, 1999). Eutrophication and environmental pollution have obviously occurred in many coastal areas, especially in estuaries and coastal bays with dense human populations in their watersheds (YIN et al., 2001; CLOERN, 1996; WU; WANG, 2007).
It is therefore essential and urgent to prevent and control marine water pollution, and regularly implement monitoring programs which help to create an understanding of the spatial and temporal variations in coastal water quality. Water quality monitoring programs have generated huge databases describing the variation of spatial and temporal patterns for water quality. The large and complicated data sets of water quality parameters are often difficult to analyze meaningfully and require data reduction methods to simplify the data structure so as to make the extraction of useful and interpretable information which could explain the spatial and temporal variation patterns of water quality possible.
In recent years, chemometrics such as cluster analysis (CA) and principal component analysis (PCA) have been effectively employed to evaluate the temporal and spatial characteristics of coastal water quality (KUPPUSAMY; GIRIDHAR, 2006; ZHOU et al., 2007a; ZHOU et al., 2007b; YUNG et al., 2001; YEUNG, 1999; WANG et al., 2006; KOTTI et al.; 2005, WU; WANG, 2007; CHAU; MUTTIL, 2007; SIMEONOV et al., 2003). Cluster analysis (CA) is called the unsupervised pattern recognition method, grouping objects into classes (clusters) so that objects within a class are similar to each other but different from those in other classes (ALBERTO et al., 2001). Results of CA can only observe the similarity between monitoring sites (clusters), rather than obtain factors playing an important role in determining the difference between clusters. Not only can principal component analysis interpret the characteristics by clustering the samples, but it can also describe their different characteristics and help to discover the relationship between different variables by the variable lines (QU; KELDERMAN, 2001). The similarity index (SI) between two samples or variables can evaluate the relationship between samples or parameters (GONG et al., 2005). The loadings of the parameters stand for the
parameters which exercise an influence on the samples. Thus, SI combined with principal component analysis is also employed to evaluate the contribution of the parameters to the samples.
The aim of this paper is to conduct an overall study of the water quality patterns of Sanya Bay. Principal component analysis and cluster analysis have identified the effects caused by the natural and anthropogenic activities undertaken in the bay.
M
ATERIAL ANDM
ETHODSStudy Area
Sanya Bay is situated in the southern part (from 109°20' to 109°30'E, 18°11' to 18°18'N) of Hainan Island, with a water area of 120 km2 and an average depth of 16 m. It is a typical tropical and permanently open bay. With the rapid development of urbanization and tourism, Sanya Bay has experienced anthropogenic impact, receiving agricultural, domestic and industrial sewage as well as rainwater from the Sanya River, in addition to nutrient enrichment and toxins derived from the cage culture of fishes (HUANG et al., 2003). Dongmao Island, Ximao Island and Luhuitou, located at the mouth of the bay, possess mostly coastal coral reefs. The Sanya River, flowing into the eastern part of the bay, is 31.3 km long, drains an area of 337 km2 and has an annual flow of 2.11×10⁹ m3 (HUANG et al., 2003). The wet, warm southwest monsoon prevails in the rainy season from April to September and brings humid air from low latitudes, resulting in gentle monsoonal rainfall in spring and heavy rainfall in summer. By contrast, a dry, cold northeast monsoon predominates in the dry season from October to the following March.
In order to evaluate both the anthropogenic and natural effects in Sanya Bay, 10 monitoring stations were located in its waters (Fig. 1).
Sampling and Chemical Analyses
Water samples were taken at the surface and in the middle and bottom layers of all the stations at monthly intervals, in 2003. A Quanta Water Quality Monitoring System (Hydrolab Corporation, USA) was employed to collect the data for temperature (T/℃),
pH, salinity (S/PSU) and Specific conductivity (SPC/µS·cm-1) in the surface, middle and bottom layers. Seawater samples for analysis of nutrients were taken using 5 L GO FLO bottles in the surface, middle and bottom layers, in accordance with the methods and sampling tools of “The specialties for oceanography surveying” (GB12763-91, China). Water samples from the surface, middle and bottom layers were analyzed for nitrate (N-NO3 / mol·L-1), nitrite
SKALAR auto-analyzer (Skalar Analytical B.V. SanPlus, Holand). Ammonium (N-NH4/ mol·L-1) was
analyzed by the hypobromite oxidization method. Phosphorus (P-PO4/ mol·L-1) was analyzed by the
molybdophosphoric blue oxidization method. Dissolved inorganic nitrogen (DIN/ mol·L-1) was the
sum of nitrate, nitrite and ammonia. Dissolved oxygen (DO/mg·L-1) was determined with the method of Winkler titration. The saturation dissolved oxygen (Sat DO) was calculated based on DO content. The water quality parameters, their units and analytical methods are summarized in Table 1.
7
6
5 4
22' 24' 109oE
26.00'
28' 30' 32'
3 2
1
12' 13' 14'
18oN 15.00'
16' 17' 18' 18'
S S
S 8 9
10
S
S S
S
S S
S
24' 17'
16'
18oN 15.00'
22' 13'
14'
32' 30'
12'
109oE 26.00'
28'
Sanya,Hainan,China
Sanya River Estuary Dongmao Island
Ximao Island
Luhuitou
Fig. 1. Monitoring stations in Sanya Bay
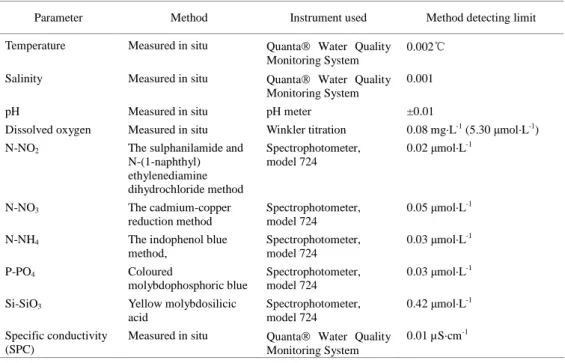
Table 1. Physical-chemical and biological parameters determined and analytical methods used.
Parameter Method Instrument used Method detecting limit
Temperature Measured in situ Quanta Water Quality Monitoring System
0.002℃ Salinity Measured in situ Quanta Water Quality
Monitoring System
0.001
pH Measured in situ pH meter ±0.01
Dissolved oxygen Measured in situ Winkler titration 0.08 mg·L-1 (5.30 mol·L-1)
N-NO2 The sulphanilamide and
N-(1-naphthyl) ethylenediamine dihydrochloride method
Spectrophotometer, model 724
0.02 mol·L-1
N-NO3 The cadmium-copper
reduction method
Spectrophotometer, model 724
0.05 mol·L-1
N-NH4 The indophenol blue
method,
Spectrophotometer, model 724
0.03 mol·L-1
P-PO4 Coloured
molybdophosphoric blue
Spectrophotometer, model 724
0.03 mol·L-1
Si-SiO3 Yellow molybdosilicic
acid
Spectrophotometer, model 724
0.42 mol·L-1
Specific conductivity (SPC)
Measured in situ Quanta Water Quality Monitoring System
Data Analysis
The data used were taken from the monthly monitored 2003 data set. The thermocline had been observed in summer and surface data were used in the data analysis. The matrix was constructed with 142 rows [120 samples (10(stations) ×12(months)) +10 samples (stations in annual) +12 samples (samples in monthly)] and 12 (parameter) columns. All parameters were also z-scale standardized (mean=0; variance=1) to minimize the effects of differences in measurement units and variance and to render the data dimensionless. Principal component analysis was performed to reduce the dimensions of the data set (matrix), and the principal components extracted, according to the eigenvalue-more-than-one rule. The annual scores of 10 stations were employed to assess the spatial pattern of the water quality. The scores of the months were used to assess the temporal pattern of the water quality.
The similarity index (SI) between two samples or variables (
1 x and
2
x ) can be expressed as
follows (for details refer to Gong et al., 2005):
2 1
2 1
x x
x x SI
t
=
SI is equal to cosine(a) (a is the angle between
1 x and
2
x ), which demonstrates the
differences in shape between
1 x and
2
x . Here, ||.|| is
equivalent to the length of
1 x and
2
x , respectively. In
this study, the SI between loadings of variables and the scores of samples is employed to identify the parameters having influence on the samples.
The classification of sampling monitoring stations was also performed by the application of cluster analysis with standard Euclidean distance as similarity or dissimilarity measure and Ward’s method of linkage. This purpose of this study was to identify similarities or dissimilarities among monitoring stations or monthly characteristics and to distinguish each cluster in terms of local natural and anthropogenic effects.
All the mathematical and statistical computations were performed using MATLAB6.5 (Mathworks Inc., USA).
R
ESULTS Environmental factorsThe water temperature ranged between 23.17°C and 30.51ºC during the study period. The mean water temperature was 26.31°C. The salinity varied narrowly from 32.59 to 34.79. The concentration of Si-SiO3 fluctuated widely from 1.71
mol·L-1 to 17.47 mol·L-1. The pH varied from 8.07
to 8.41. The basic statistics of the data set on water quality are summarized in Table 2.
Table 2. Descriptive statistics of water quality properties.
Minimum Maximum Mean Median Std Skewness Kurtosis
Temperature 23.17 30.51 26.31 26.76 2.1 -0.13 1.56
Salinity 32.59 34.79 34.19 34.22 0.39 -0.75 4.02
DO 4.42 6.47 5.36 5.16 0.63 0.31 1.56
pH 8.07 8.41 8.26 8.27 0.04 -0.58 6.62
SPC 49.7 52.83 51.9 51.95 0.59 -0.57 3.38
Sat DO 68.53 94.73 81.37 80.22 7.31 0.17 1.58
Si-SiO3 1.71 17.47 8.1 7.73 2.75 0.51 3.53
P-PO4 0.04 0.43 0.09 0.08 0.05 2.87 16.86
N-NO2 ND 0.54 0.13 0.11 0.11 1.38 4.76
N-NO3 0.73 2.14 1.07 1.03 0.26 1.46 5.91
N-NH4 0.38 1.74 0.78 0.75 0.24 1.22 5.26
DIN 1.31 3.69 1.98 1.89 0.48 1.11 4.27
ND: under detection limit(values below detection limit were replaced by DL/2(DL: limits of detection) (FARNHAM et al., 2000)).
DO was negatively correlated with temperature because the solubility of oxygen in water decreases with increasing temperature (p<0.01). There was significant negative correlation between salinity and temperature (p<0.01). The salinity was significantly correlated to DO (p<0.01), SPC (p <0.01), Si-SiO3 (p <0.01), P-PO4 (p <0.01), N-NO2 (p <0.01),
N-NO3 (p <0.01), N-NH4 (p <0.01), and DIN (p
<0.01). The concentration of nutrients decreased greatly with higher salinity.
Cluster Analysis
The classification of sampling monitoring stations was performed by the application of cluster analysis with standard Euclidean distance as similarity or dissimilarity measure and Ward’s method of linkage. This purpose of this study was to identify similarities or dissimilarities among monitoring sites and to distinguish each cluster in terms of local natural and anthropogenic effects.
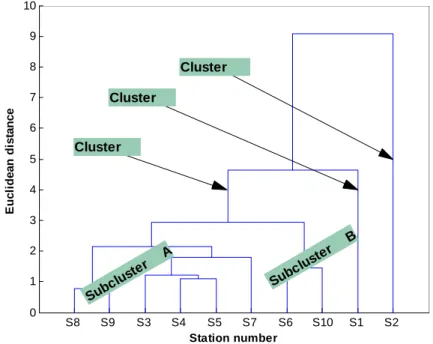
The application of cluster analysis to the 10×12 data matrix (the annual values of variables at each station: the row is the station and the column is the variable) distinguished three major clusters, namely Clusters I, and . The dendrogram is shown in Figure 2.
Cluster consists of stations S3-S10. All the stations in this cluster are located in the outer and middle parts of the bay. This cluster is divided into two subclusters. Subcluster A consists of the stations located in the middle part of the bay: S3, S4, S5, S7, S8 and S9. Subcluster B consists of the stations located in the outer part of the bay, i.e., S6 and S10. Cluster consists of station S1. The station in this cluster is close to downtown Sanya. Cluster consists of station S2. The station in this cluster is located in the Sanya River mouth.
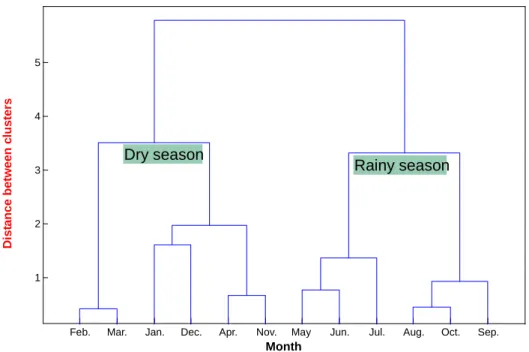
The application of cluster analysis to the 12×12 data matrix (the row is the month and the column the variable) distinguished two major clusters, namely dry season and rainy season. The dendrogram is presented in Figure 3.
Principal Component Analysis
To examine the suitability of the data for principal component analysis, Kaisere-Meyere-Olkin (KMO) was undertaken. KMO is a measure of sampling adequacy that indicates the proportion of variance which is common. In this study, KMO is 0.52, greater than 0.5, thus indicating that PCA can achieve a significant reduction of the dimensionality of the original data set.
S8 S9 S3 S4 S5 S7 S6 S10 S1 S2
0 1 2 3 4 5 6 7 8 9 10
Station number
E
u
c
li
d
e
a
n
d
is
ta
n
c
e
Cluster Cluster
Cluster
Subc
luste
r A
Subc
luste
r B
Fig. 3. Dendrogram based on Ward's method
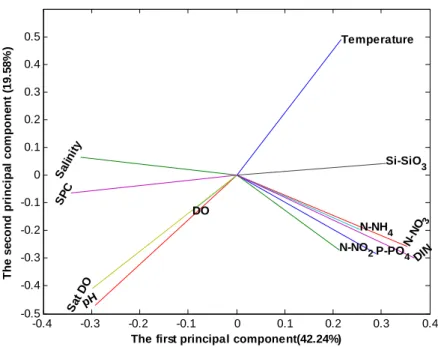
The water is a complicated system with a large number of physical, chemical and biological parameters involved. In addition, due to the variation of weather and tide etc, these parameters in the water column are subject to constant change. As a result, it is difficult to determine the seasonal change characteristics of the water in terms of a single factor. Principal component analysis is an important tool for data compression and information extraction. PCA discovers linear combinations of the original variables that describe the significant variations in the data, and extracted the four latent factors, according to the eigenvalue-more-than-one rule. The loadings of the first four principal components are shown in Table.3. The first four PCs explain 85.52% of the total variance. PC1 explains 42.24% of that total variance, and is clearly dominated by salinity, SPC and nutrients, which shows its marine character. PC2 explains 19.58% of the total variance, and is clearly dominated by temperature and pH, which shows its climatic character. This component (PC2) can be explained that high levels of dissolved organic matter consume large amounts of oxygen, which undergoes anaerobic fermentation processes leading to the formation of ammonia and organic acids. Hydrolysis of these acidic materials causes a decrease in pH values (VEGA et al., 1998; SINGH et al., 2004). PC3 explains 14.16% of the total variance, and is clearly dominated by salinity,
Si-SiO3 and N-NH4, which demonstrates the
anthropogenic resources. PC4 explains 9.54% of the total variance, and is clearly dominated by DO and N-NH4, which shows its seasonal character.
The loading plot on the first two PCs is given in Figure 4. The loadings of salinity in PC1 and PC2 are negative and positive, respectively. The loading of temperature is positive in PC1. The temperature and salinity may be important indicators of climate and marine character. The loadings of the nutrients in PC1 are positive.
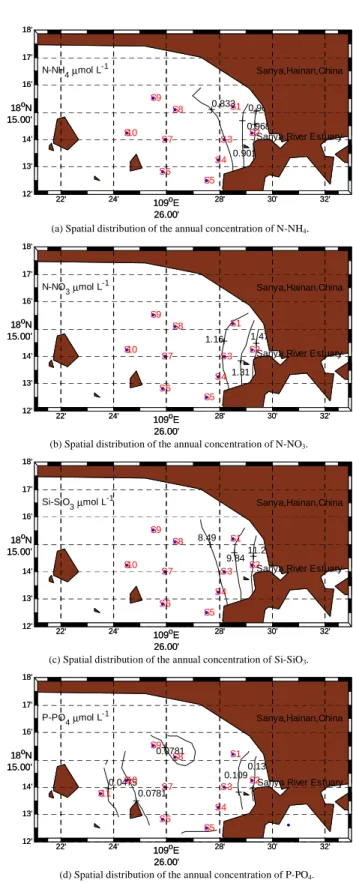
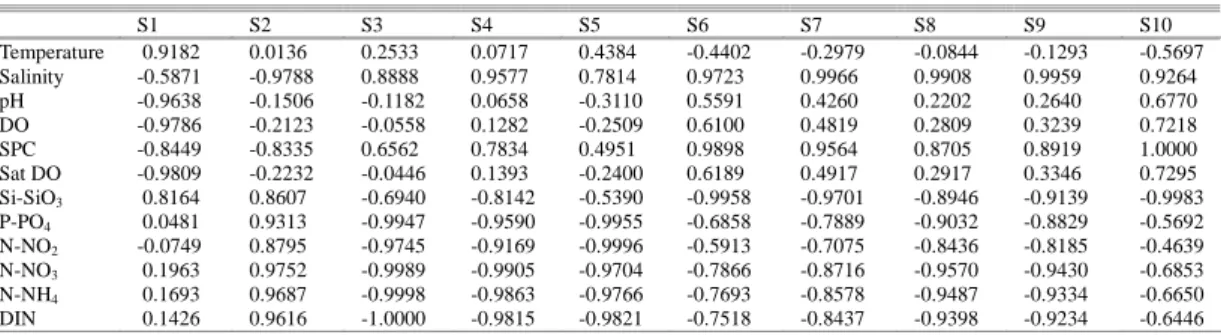
In respect to the spatial distribution, the plot of the scores for the first two principal components of each station is shown in Figure 5. The spatial pattern is classified into three clusters. The result is in agreement with the result of the cluster analysis. The scores of S2 are displayed farthest to the right of the first principal component axis with high nutrients. The SI between S2 and nutrients are higher than 0.85. The SI between S1 and nutrients ranges from 0.00 to 0.85. The SI between S3-S10 and nutrients are less than 0.00 (Table 4). The S2 has higher concentrations of nutrients than do the other stations. The S2 is heavily polluted, probably by external pollution sources from the Sanya River. The average concentrations of nutrients show similar spatial variations, decreasing from the eastern to the western part of the bay (Fig. 6).
Feb. Mar. Jan. Dec. Apr. Nov. May Jun. Jul. Aug. Oct. Sep.
1 2 3 4 5
Dry season
Rainy season
Month
D
is
ta
n
c
e
b
e
tw
e
e
n
c
lu
s
te
rs
-0.4 -0.3 -0.2 -0.1 0 0.1 0.2 0.3 0.4 -0.5
-0.4 -0.3 -0.2 -0.1 0 0.1 0.2 0.3 0.4
0.5 Temperature
Sa lin
ity
pH
DO SP
C
Sa t D
O
Si-SiO3
P-PO4
N-NO2 N-N
O3
N-NH4
DIN
The first principal component(42.24%)
T
h
e
s
e
c
o
n
d
p
ri
n
c
ip
a
l
c
o
m
p
o
n
e
n
t
(1
9
.5
8
%
)
Fig. 4. The loadings of variables for the first two PCs. The letter denotes the variable.
-1 -0.5 0 0.5 1 1.5 2 2.5 3 3.5 4
-2.5 -2 -1.5 -1 -0.5 0 0.5 1
S1
S2 S3
S4 S5
S6 S7 S9 S8
S10
Group Group
Group
0.968
0.901
0.833 0.968
4
3 2
1
22' 24' 109oE
26.00'
28' 30' 32'
18' 17' 16' 12' 13' 14'
18oN
15.00' S S S 5 6 7 8 9 10 S S S S S S S 28' 18'
N-NH4µmol L-1 Sanya,Hainan,China
Sanya River Estuary
13'
109oE
26.00' 24' 22' 17' 32' 16' 12' 30' 14'
18oN
15.00'
(a) Spatial distribution of the annual concentration of N-NH4.
1.16
1.31 1.47
5 4
3 2
22' 24'
109oE
26.00'
28' 30' 32'
1 18' 17' 12' 13' 14'
18oN
15.00' 16' S S 6 7 8 9 10 S S S S S S S S 28' 17'
N-NO3µmol L-1
18'
Sanya,Hainan,China
Sanya River Estuary
16'
24' 22'
13'
30'
109oE
26.00'
12' 14'
32'
18oN
15.00'
(b) Spatial distribution of the annual concentration of N-NO3.
11.2 9.84 8.49
4
3 2
1
22' 24' 109oE
26.00'
28' 30' 32'
18' 17' 16' 12' 13' 14'
18oN
15.00' S S S 5 6 7 8 9 10 S S S S S S S 28' 18'
Si-SiO3µmol L-1 Sanya,Hainan,China
Sanya River Estuary
13'
109oE
26.00' 24' 22' 17' 32' 16' 12' 30' 14'
18oN
15.00'
(c) Spatial distribution of the annual concentration of Si-SiO3.
0.139 0.109
0.0781 0.0781
0.0475 2
1
18'
22' 24'
109oE
26.00'
28' 30' 32'
17'
16'
18oN
15.00' 14' 12' 13' S S S S
S 3
4 5 6 7 8 9 10 11 S S S S S S
109oE
26.00'
18'
P-PO4µmol L-1 Sanya,Hainan,China
Sanya River Estuary
28' 24' 22' 13' 17' 30' 16' 12' 14' 32'
18oN
15.00'
(d) Spatial distribution of the annual concentration of P-PO4.
By contrast, the scores of the stations from S3 to S10 stayed on the left side of the first principal component axis with high DO, pH, salinity and SPC. The SI between S3-S10 and salinity are higher than 0.75. The SI between S1-S2 and salinity are less than 0.00 (Table 4). The stations (S3-S10) have higher salinity than the other stations. Fresh water from the Sanya River diminishes the surface salinity in Cluster (S2). The water from the South China Sea may play an important role in the water quality at these stations. In addition, SPC and salinity have similar characters. Freshwater input may impart abrupt decreases in SPC. Decreased runoff, commonly observed in winter, provides decreased dilution for ionic inputs in tributaries, usually manifested as increases in SPC.
As regards the temporal pattern, the plot of the scores for the first two principal components of each month is shown in Figure 7. The temporal pattern is classified into two groups, dry season and wet (rainy) season. The dry season consists of dry season samples. The samples from the dry season are located in the third and fourth quadrants. They are characterized by relatively low temperatures. The SI between the rainy season from May to October and temperature are higher than 0.45. The SI between the dry season from November to the next April and temperature are less than 0.00 (Table 5). Temperature may be an important indicator of seasonal change.
D
ISCUSSIONSpatial Pattern
Chemometrics are widely employed to identify the temporal and spatial variations in coastal water quality (WU; WANG, 2007, WU et al., 2009a, WU et al., 2009b). Both CA and PCA have identified
the temporal and spatial characteristics of the water quality in Sanya Bay. The PCA results show that nutrients make important contributions to the scores of the samples in PC1 and PC2. It is, therefore, clear that the scores of the stations are related to the importance of the variables (Table 3). The increase of the nutrient load into Chinese coastal waters must be related to external sources, such as JiaoZhou Bay (SHEN, 2001;
SHEN et al., 2006; ZHAO et al., 2005) and Daya Bay (WU; WANG, 2007; QIU et al., 2005). With the expansion of the tourist trade and the rapid population growth of Sanya City (more than 5×10⁵ inhabitants), the impact of human activities on the bay has increased significantly, and this leads to greater nutrient inputs into the bay (ZHOU et al., 2009). For example, DIN reached 26.0 mol·L-1 in Sanya Harbor in summer, 1999 (HE et al., 2000). The concentrations of nutrients made a significant contribution to the scores of S2 in PC1. The second one was S1. The positive loadings of nutrients in PC1 suggest that the municipal waste water and runoff of the Sanya River play an important role in determining the local water quality. The annual concentration of TIN in cluster III
(S2) was more than that in Cluster II (S1), the last one
being Cluster I. Nutrient concentrations increased
shoreward and clearly demonstrated the impact due to the terrestrial input and the Sanya River (ZHOU et al., 2009). The domestic and industrial wastewater discharge enters the Sanya River, and then the bay. S2 was mainly influenced by the domestic wastewater and runoff of the freshwater from Sanya River. The SI showed that nutrients made an important contribution to S2 (Table 4). This supports the view that the Sanya River estuary receives an important external micropolluting input from the Sanya River.
-4 -3 -2 -1 0 1 2 3 4
-2.5 -2 -1.5 -1 -0.5 0 0.5 1 1.5 2 2.5
Jan Feb
Mar Apr
May Jun
Jul
AugSep Oct
Nov Dec
Dry season Rainy season
Table 3. Loadings of original variables in Sanya Bay.
PC1 PC2 PC3 PC4
Temperature 0.2168 0.4884 0.1387 0.0451
Salinity -0.3223 0.0645 -0.4095 0.3163
pH -0.2916 -0.4700 0.0974 -0.1103
DO -0.0921 -0.1296 0.2395 0.6490
SPC -0.3419 -0.0627 -0.3995 0.2732
Sat DO -0.2980 -0.4094 0.1695 -0.1273
Si-SiO3 0.3090 0.0404 -0.4221 0.1790
P-PO4 0.2893 -0.2845 0.0174 -0.2768
N-NO2 0.2133 -0.2689 -0.4630 -0.2193
N-NO3 0.3531 -0.2561 -0.1699 0.2063
N-NH4 0.2554 -0.1962 0.3683 0.3473
DIN 0.3677 -0.2985 -0.0205 0.2318
Eigenvalue 5.0686 2.3493 1.6988 1.1442
Variance(%) 42.24 19.58 14.16 9.54
Cumulative(%) 42.24 61.82 75.98 85.52
Table 4. The similarity index between parameters and scores of monitoring stations.
S1 S2 S3 S4 S5 S6 S7 S8 S9 S10
Temperature 0.9182 0.0136 0.2533 0.0717 0.4384 -0.4402 -0.2979 -0.0844 -0.1293 -0.5697
Salinity -0.5871 -0.9788 0.8888 0.9577 0.7814 0.9723 0.9966 0.9908 0.9959 0.9264
pH -0.9638 -0.1506 -0.1182 0.0658 -0.3110 0.5591 0.4260 0.2202 0.2640 0.6770
DO -0.9786 -0.2123 -0.0558 0.1282 -0.2509 0.6100 0.4819 0.2809 0.3239 0.7218
SPC -0.8449 -0.8335 0.6562 0.7834 0.4951 0.9898 0.9564 0.8705 0.8919 1.0000
Sat DO -0.9809 -0.2232 -0.0446 0.1393 -0.2400 0.6189 0.4917 0.2917 0.3346 0.7295
Si-SiO3 0.8164 0.8607 -0.6940 -0.8142 -0.5390 -0.9958 -0.9701 -0.8946 -0.9139 -0.9983
P-PO4 0.0481 0.9313 -0.9947 -0.9590 -0.9955 -0.6858 -0.7889 -0.9032 -0.8829 -0.5692
N-NO2 -0.0749 0.8795 -0.9745 -0.9169 -0.9996 -0.5913 -0.7075 -0.8436 -0.8185 -0.4639
N-NO3 0.1963 0.9752 -0.9989 -0.9905 -0.9704 -0.7866 -0.8716 -0.9570 -0.9430 -0.6853
N-NH4 0.1693 0.9687 -0.9998 -0.9863 -0.9766 -0.7693 -0.8578 -0.9487 -0.9334 -0.6650
DIN 0.1426 0.9616 -1.0000 -0.9815 -0.9821 -0.7518 -0.8437 -0.9398 -0.9234 -0.6446
Table 5. The similarity index between parameters and monthly scores.
In this study, PCA found that temperature and salinity were important climatic factors, which had a considerable effect on the water quality characteristics. Temperature and salinity have stronger positive and negative loadings, respectively, in PC1. The annual salinity in Cluster (S1) was more than that in Cluster (S2), and less than that in Cluster . Correlation coefficient analysis showed that nutrients were negatively correlated to salinity. Negative correlation between nutrients and salinity demonstrate
that land sources are the main source of high nutrient levels (LIU et al., 2005). Nutrients are introduced into the bay by river and sewage discharges. The freshwater discharge from the Sanya River may carry the nutrients into the bay. They indicate the importance of the mixing of polluted freshwater and coastal saline waters.
On the other hand, Sanya Bay is a permanently open bay. The annual salinity distribution in all the clusters demonstrates that marine factors
Jan. Feb. Mar. Apr. May Jun. Jul. Aug. Sep. Oct. Nov. Dec.
Temperature -0.9450 -0.7528 -0.8429 -0.4292 0.8209 0.4319 0.9475 0.7660 0.7014 0.8427 -0.4767 0.1226 Salinity -0.1129 0.8067 0.7091 0.9751 0.3781 0.7858 -0.5189 -0.7946 -0.8487 -0.7094 -0.7538 -0.9953 pH 0.8912 0.8360 0.9088 0.5490 -0.7348 -0.3042 -0.9824 -0.8469 -0.7925 -0.9085 0.3516 -0.2575 DO 0.8611 0.8687 0.9331 0.6003 -0.6909 -0.2439 -0.9922 -0.8785 -0.8291 -0.9329 0.2923 -0.3175 SPC 0.2627 0.9681 0.9196 0.9879 0.0089 0.5013 -0.7983 -0.9628 -0.9841 -0.9198 -0.4573 -0.8888 Sat DO 0.8553 0.8742 0.9371 0.6092 -0.6827 -0.2330 -0.9935 -0.8839 -0.8354 -0.9369 0.2815 -0.3282 Si-SiO3 -0.2129 -0.9540 -0.8983 -0.9946 -0.0601 -0.5450 0.7664 0.9477 0.9738 0.8985 0.5023 0.9111 P-PO4 0.6384 -0.3515 -0.2073 -0.6947 -0.8232 -0.9962 -0.0337 0.3326 0.4207 0.2078 0.9905 0.8860 N-NO2 0.7281 -0.2339 -0.0856 -0.6011 -0.8867 -0.9994 -0.1562 0.2142 0.3061 0.0861 0.9999 0.8224 N-NO3 0.5167 -0.4870 -0.3507 -0.7941 -0.7295 -0.9721 0.1155 0.4693 0.5511 0.3512 0.9591 0.9452 N-NH4 0.5400 -0.4629 -0.3248 -0.7771 -0.7480 -0.9782 0.0882 0.4448 0.5280 0.3253 0.9665 0.9359 DIN 0.5625 -0.4388 -0.2992 -0.7598 -0.7657 -0.9834 0.0613 0.4205 0.5049 0.2997 0.9731 0.9260
differentiate these clusters. The salinity varies from 33.0 to 34.5 in the South China Sea (HAN, 1998). The salinity in the bay waters lies within this range. The renewal of the bay´s waters promoted by the waters of the South China Sea is an important mechanism in diluting the concentration of nutrients (eutrophication). The water residence time is 4.34, 2.85, 5.49 and 7.89 days in winter, spring, summer and autumn, respectively (WANG et al., 2005). The water residence time is shorter during the southwest monsoon period than during the northeast monsoon period. The concentration of both P-PO4 and Si-SiO3 decreases
from inshore to offshore waters, probably as a result of the effects of land sources and the freshwater discharges of the Sanya River, and the waters of the South China Sea (HUANG et al., 2003). The SI showed that salinity made an important contribution to S3-S10 (Table 4). Therefore, the waters from the South China Sea play an important role in renewing the waters of the bay.
The result of cluster analysis is in agreement with that of PCA as regards spatial distribution. The (10) monitoring stations fall into the three groups of the relatively non-polluted region (Cluster I), the moderately polluted region (Cluster II), and the
highly polluted region (Cluster III).
Temporal pattern
In the temporal pattern, the seasonal character of the water quality was investigated through scores of the monthly samples of the first two principal components (Fig. 7). On the scores plot (Fig. 7), the samples belonging to the two different seasons are well differentiated and clearly visible. The first group includes the samples collected in the dry season (January, February, March, April, November and December). The second group includes the samples collected in the rainy season, from May to October. A wet, warm southwest monsoon prevails in the rainy season from April to September, bringing humid air from low latitudes, and resulting in gentle monsoonal rainfall in spring and heavy rainfall in summer. By contrast, a dry, cold northeast monsoon predominates in the dry season, from October to the following March (LIANG et al., 2000). In this region, the Southeast Asian monsoons, northeasterly from October to the next April and southwesterly from May to September, have important effects on biogeochemical cycles in South China Sea waters (CHEN et al., 2006).
From the score plot, the temporal distribution of the samples can be observed clearly. In the third and fourth quadrant, a cluster of the dry seasonal samples is characterized by high DO content, salinity, pH and
SPC, because these variable lines are located in these quadrants (Fig. 4). The samples of the rainy season are clearly separated from the samples of the dry season; they are located in the first and second quadrants. They are characterized by relatively high concentrations of nutrients and high temperature. The average sea surface temperature was higher in the rainy season (29.15 ) than in the dry season (24.76ºC). The temperature weightings are 0.2168 and 0.4884, respectively, in PC1 and PC2. The difference in temperature as between the dry and rainy seasons was significant (p<0.05). It makes a considerable contribution to the scores of samples in PC2. The scores of the samples collected during the dry season are below zero in PC2. The variable (temperature) can be an important indicator in seasonal change. The SI showed that temperature made an important negative contribution to samples collected during the dry season and a positive contribution to those collected during the rainy season (Table 5). This shows that the temperature during the dry season is lower than that during rainy season.
The sea surface salinity of the S2 was 33.29 and 34.63 in August and February, respectively. Heavy rain dilutes the surface salinity in the rainy season. This significant negative correlation between salinity and temperature was due to the large input of freshwater through tributaries resulting from the heavy rainfall in July and August (summer) when the water temperature is high in the study area (PARK; PARK, 2000). Rainfall is an important climatic indicator of changes in seasonal characteristics. In order to confirm the seasonal change, the average precipitation data at Haikou (110°35'E, 20°03'N) and Dong fang (108°62'E,
19°10'N), Hainan, from 1971~2000 (China
Meteorological Administration, 1971~2000) are used to corroborate and clarify the change in seasonal characteristics (Fig. 8). The monthly precipitation during the rainy season is more than 100 nm, except during May in Dongfang, and less than 100 nm during the dry season. Rainfall and land-based water input may be sufficient to explain the difference in the water quality between the dry and rainy seasons. The concentration of Si-SiO3 is 9.31
mol·L-1 and 7.32 mol·L-1 in the rainy and dry seasons, respectively. The concentration of Si-SiO3
reflects the seasonal changes, the concentration in the rainy season being higher than that in the dry season (HUANG et al., 2003). The seasonal characteristic is in agreement with that in the subtropical Daya Bay (WU; WANG, 2007).
Jan. Feb. Mar. Apr. May Jun. Jul. Aug. Sep. Oct. Nov. Dec. 0
50 100 150 200 250
Month
P
re
c
ip
it
a
ti
o
n
m
m
Haikou Dongfang
Fig.8. Monthly precipitation in Haikou and Dongfang, close to Sanya Bay.
C
ONCLUSIONIn this study, the chemometric method was employed to identify the spatial pattern and seasonal character of the water quality in Sanya Bay. Principal component analysis identifies the anthropogenic effects and the natural and marine characteristics of the water quality in Sanya Bay. In the spatial pattern, principal component analysis and cluster analysis obtained the same results. The 10 monitoring stations were grouped into three clusters with similar characteristics based on variables of water quality. The results suggest that anthropogenic activities have had significant effects on the water quality in Sanya Bay. The Sanya River discharge appears to play an important role in determining local water quality. In the seasonal pattern, the scores of monthly samples of the first two principal components identified the characteristics of the seasonal change in the water quality of Sanya Bay. The Southeast Asian monsoons, northeasterly from November to the next April and southwesterly from May to October, have important effects on the biogeochemical cycles in South China Sea waters. The dry season from November to the following April and the rainy season from May to October have been distinguished. The result of cluster analysis has further supported the characteristics of seasonal change. The chemometric method is an effective tool for identifying anthropogenic effects, and for the rapid assessment of water quality.
A
CKNOWLEDGEMENTSThis research project was financed by the National Nature Science Fund (Nos. 40676091 and 40006009), key Projects in the National Science & Technology Pillar Program (No. 2009BAB44B03), the Knowledge Innovation Program of the Chinese Academy of Sciences (Nos. KSCX2-SW-132 and SQ200913), the National Key Station in Field Observation Fund, the Science and Technology Program of Guangdong Province (Grant: No. 2004B60302004, 2005B60301032), and the Fund of the Key Laboratory of Global Change and Marine-Atmospheric Chemistry, SOA (No.GCMAC0906).
R
EFERENCESALBERTO, W. D.; DEL PILAR, D. M.; VALERIA, A.M.; FABIANA, P. S.; CECILIA, H. A.; DE LOS ANGELES, B.M. Pattern recognition techniques for the evaluation of spatial and temporal variations in water quality. A case study: Suquia River basin (Cordoba-Argentina). Wat.
Res., v. 35, p. 2881-2894, 2001.
BONSDORFF, E.; RONNBERG, C.; AARNIO, K. Some ecological properties in relation to eutrophication in the Baltic Sea. Hydrobiologia, v. 475, p. 371-377, 2002. CHAU, K. W.; MUTTIL, N. Data mining and multivariate
statistical analysis for ecological system in coastal waters. J. Hydroinformatics, v. 9, p. 305-317, 2007.
CHEN, C. C.; SHIAH, F. K.; CHUNG, S. W.; LIU, K. K. Winter phytoplankton blooms in the shallow mixed layer of the South China Sea enhanced by upwelling. J. mar. Systems, v. 59, p. 97-110, 2006.
CLOERN, J. E. Phytoplankton bloom dynamics in coastal ecosystems: A review with some general lessons from sustained investigation of San Francisco Bay, California. Revs Geophys.,v. 34, p. 127-168, 1996.
CONLEY, D.J. Biogeochemical nutrient cycles and nutrient management strategies. Hydrobiologia, v. 410, p. 87-96, 1999.
FARNHAM, I. M.; SINGH, A. K.; STETZENBACH, K. J.; JOHANNESSON, K. H. Treatment of nondetects in multivariate analysis of groundwater geochemistry data. In: INTERNATIONAL CONFERENCE ON ENVIRONMENTRICS AND CHEMOMETRICS, 4., 2000, Las Vegas, Nevada.
GONG, F.; WANG, B.T.; FUNG, Y.S.; CHAU, F. T. ( Chemometric characterization of the quality of the atmospheric environment in Hong Kong. Atmos. Environ.,v. 39, p. 6388-6397, 2005.
HAN, W. Y. Marine Chemistry in South China Sea, Beijing: Science Publishing House, 1998.
HE, X. Q.; WEN, W. Y.; HE, Q. X. Evaluate on the water quality of the Sanya Bay waters. Res. Dev. South China Sea, v. 2, p. 18-21, 2000.
HUANG, L. M.; TAN, Y. H; SONG, X. Y.; HUANG, X. P.; WANG, H.K.; ZHANG, S.; DONG, J.D.; CHEN, R.Y. The status of the ecological environment and a proposed protection strategy in Sanya Bay, Hainan Island, China. Mar. Pollut. Bull.,v. 47, p. 180-186, 2003.
KOTTI, M. E.; VLESSIDIS, A. G.; THANASOULIAS, N. C.; EVMIRIDIS, N. P. Assessment of river water quality in Northwestern Greece. Wat. Resour. Mgm, v. 19, p. 77-94, 2005.
KUPPUSAMY, M. R.; GIRIDHAR, V. V. Factor analysis of water quality characteristics including trace metal speciation in the coastal environmental system of Chennai Ennore. Environ. int., v. 32, p. 174-179, 2006. LIANG, W. D.; JAN, J .C.; TANG, T. Y. Climatological
wind and upper ocean heat content in the South China Sea. Acta Oceanogr. taiwan., v. 38, p. 91-114, 2000. LIU, S. M.; ZHANG, J.; CHEN, H. T.; ZHANG, G. S.
Factors influencing nutrient dynamics in the eutrophic Jiaozhou Bay, North China. Prog. Oceanogr., v. 66, p. 66-85, 2005.
MEE, L.D. (1992). The Black Sea in a crisis: a need for concentrated international action. Ambio, v. 21, p. 278-286, 1992.
NIXON, S. W Coastal marine eutrophication: A definition,social causes, and future concerns. In: INTERNATIONAL SYMPOSIUM ON NUTRIENT DYNAMICS IN COASTAL AND ESTUARINE ENVIRONMENTS, 1995, Helsingor, Denmark. PARK, G. S.; PARK, S. Y. Long-term trends and temporal
heterogeneity of water quality in tidally mixed estuarine waters. Mar. Pollut. Bull., v. 40, p. 1201-1209, 2000. QIU, Y. W.; WANG, Z. D.; ZHU, L. S. Variation trend of
nutrient and chlorophyll contents and their effects on ecological environment in Daya Bay. J. Oceanogr. Taiwan Strait, v. 24, p. 131-139, 2005.
QU, W. C.; KELDERMAN, P. Heavy metal contents in the Delft canal sediments and suspended solids of the River Rhine: multivariate analysis for source tracing. Chemosphere, 45, p. 919-925, 2001.
SHEN, Z.L. Historical changes in nutrient structure and its influences on phytoplantkon composition in Jiaozhou Bay. Estuar. coast. Shelf Sci., v. 52, p. 211-224., 2001. SHEN, Z.L.; QUN, L.; WIN, W.; YUN, Y. Nutrient structure of seawater and ecological responses in Jiaozhou Bay, China. Estuar. coast Shelf Sci., v. 69, p. 299-307, 2006.
SIMEONOV, V., STRATIS, J. A., SAMARA, C., ZACHARIADIS, G., VOUTSA, D., ANTHEMIDIS, A., SOFONIOU, M.; KOUIMTZIS, T. Assessment of the surface water quality in Northern Greece. Wat. Res., v. 37, p. 4119-4124, 2003.
SINGH, K. P.; MALIK, A.; MOHAN, D.; SINHA, S. Multivariate statistical techniques for the evaluation of spatial and temporal variations in water quality of Gomti River (India) - a case study. Wat. Res., v. 38, p. 3980-3992, 2004.
VEGA, M.; PARDO, R.; BARRADO, E.; DEBAN, L. Assessment of seasonal and polluting effects on the quality of river water by exploratory data analysis. Wat.
Res., v. 32, p. 3581-3592, 1998.
WANG, H. K.; DONG, J. D.; WANG, Y. S.; CHEN, G. H.; ZHANG, Y. Y. Variations of nutrient contents and their transportation estimate at Sanya Bay. J. tropic. Oceanogr., v. 25, p. 90-95, 2005.
WANG, Y. S.; LOU, Z. P., SUN, C. C., WU, M. L.; HAN, S. H. Multivariate statistical analysis of water quality and phytoplankton characteristics in Daya Bay, China, from 1999 to 2002. Oceanologia, v. 48, p. 193-211, 2006. WU, M. L.; WANG, Y. S. Using chemometrics to evaluate
anthropogenic effects in Daya Bay, China. Estuar. coast. Shelf Sci., v. 72, p. 732-742, 2007.
WU, M. L.; WANG, Y. S.; SUN, C.C.; WANG, H.; DONG, J. D. Using chemometrics to identify water quality in Daya Bay,China. Oceanologia, v. 52, p. 217-232, 2009a. WU, M. L.; WANG, Y.S.; SUN, C. C.; WANG, H. L.; DONG, J. D.; HAN, S. H. Identification of anthropogenic effects and seasonality on water quality in Daya Bay, South China Sea. J. environ. Mgmt, v. 90, p. 3082-3090, 2009b.
YEUNG, I.M.H. Multivariate analysis of the Hong Kong Victoria Harbour water quality data. Environ. Monitor. Assessment, v. 59, p. 331-342, 1999.
YIN, K. D.; QIAN, P.Y.; WU, M. C. S.; CHEN, J. C.; HUANG, L. M.; SONG, X.Y.; JIAN, W. J. Shift from P to N limitation of phytoplankton growth across the Pearl River estuarine plume during summer. Mar. Ecol.Progr.
Ser., v. 221, p. 17-28, 2001.
YUNG, Y. K.; WONG, C. K.; YAU, K.; QIAN, P. Y. Long-term changes in water quality and phytoplankton characteristics in Port Shelter, Hong Kong, from 1988-1998. Mar. Pollut. Bull., v. 42, p. 981-992, 2001. ZHAO, S. J.; JIAO, N. Z.; SHEN, Z.L.; WU, Y.L. Causes
and consequences of changes in nutrient structure in the Jiaozhou Bay. J. integr. Plant Biol., v. 47, p. 396-410, 2005.
ZHOU, F.; LIU, Y.; GUO, H.C. Application of multivariate statistical methods to water quality assessment of the watercourses in northwestern new territories, hong kong. Environ. Monitor. Assessment, v. 132, p. 1-13, 2007b. ZHOU, W. H.; LI, T.; CAI, C. H.; HUANG, L. M.; WANG, H. K.; XU, J. R., DONG, J. D.; ZHANG, S. Spatial and temporal dynamics of phytoplankton and bacterioplankton biomass in Sanya Bay, northern South China Sea. J. environ. Sciences-China, v. 21, p. 595-603, 2009.
(Manuscript received 26 January 2010; revised 12 May 2010; accepted 14 July 2010)