Brazilian Journal of Physics, vol. 35, no. 3B, September, 2005 779
Ancient Ceramic Analysis by Neutron Activation in
Association with Multivariate Methods
U. M. Vinagre Filho1, R. M. Latini2, A V. B. Bellido2, A. Buarque3, and A. M. Borges2 1Instituto de Engenharia Nuclear - IEN-CNEN. Cid. Univ.,
Ilha do Fund˜ao Caixa Postal 68550, 21945-970, Rio de Janeiro, RJ, Brazil
2Universidade Federal Fluminense, IQ-UFF. Outeiro S ˜ao Jo˜ao Batista, sn. Valonguinho, 24020-150, Niter ´oi, RJ, Brazil and 3Museu Nacional - Depto. de Antropologia-UFRJ. Quinta da Boa Vista, S ˜ao Cristov˜ao, 20940-040, Rio de Janeiro, RJ, Brazil
Received on 23 January, 2005
We report a comparative study of two archaeological sites, Bela Vista and Serrano, located in the Araruama region of the state of Rio de Janeiro, in Brazil. The elemental geochemical compositions of the ceramics from both sites were determined by Instrumental Neutron Activation Analysis (INAA). A statistical treatment of the data, using cluster analysis and principal component analysis, indicates that there are no correlations between these sites.
I. INTRODUCTION
The presence of ceramic sherds is always observed at the latest levels of the Sambaqui occupation in Rio de Janeiro, which were identified as belonging to the Una and Tupinamb´a archaeological groups [1,2]. In Brazilian archaeology it is in-teresting to investigate the contacts and relationship among horticulture, ceramics and fishermen, and hunter-gathering groups (FHG; Sambaquieiros) [1].
The disappearance of these FHG groups in some regions may has been associated with the arrival of new ceramic groups. In this investigation, we use analytical tools in or-der to identify and characterize collected ceramics fragments from the archaeological sites in the Araruama region. Cera-mic objects are made from clays and often mixed with “tem-pers”, which may be organic materials, sand, ceramic powder, shells, or other types of clays [3]. From a mineralogical point of view, a clay species and its respective chemical composi-tion can show variacomposi-tions due to different geological condicomposi-tions of formation and to the degree of isomorphic substitutions or exchanges by similarity and exchangeable cations. Therefore, the determination of the chemical composition of a particular sherd gives an indication of the specific clay source [4]. The characterization of the elemental chemical composition of the ceramic samples was done by using the nuclear technique of instrumental neutron activation analysis (INAA) [5,6,7,8]. For classification studies, the data were treated by two multivari-ate statistical methods, cluster analysis and principal compo-nent analysis.
II. ARCHAEOLOGICAL SITES
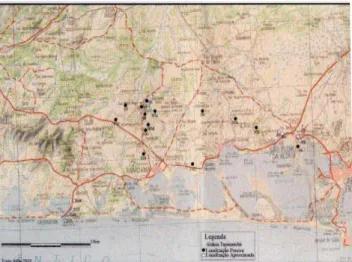
The ceramic materials used in this study were collected at the Condom´ınio Bela Vista and Serrano Archaeological Sites. Figure1 shows the intense Tupinamb´a occupation in this re-gion. Polychromic ceramics with geometric decoration were mainly used for funerary and ornamental ware. Another ar-chaeological study in the region, checking the elemental che-mical composition, shows differentiation between domestic (cooking), ornamental, and funerary wares [9].
FIG. 1: Tupinamb´a archeological sites in the Araruama region
III. INSTRUMENTAL NEUTRON ACTIVATION ANALYSIS
We analyzed 18 collected ceramic fragments. The clay standard reference material was the Podmore Red Clay, which has an elemental concentration very close to our analyzed samples [6]. Approximately 200mg of representative cera-mic fragments and standards were weighted and encapsulated in an appropriate polyethylene container for irradiation. In or-der to keep the same counting geometry, and to achieve the best results, we used approximately the same weight for sam-ples and standards. The samsam-ples were irradiated at the IEA-R1 research reactor of the Instituto de Pesquisas Energ´eticas e Nucleares (IPEN). The thermal neutron flux was of the order of 1012n.cm
780 U. M. Vinagre Filho et al.
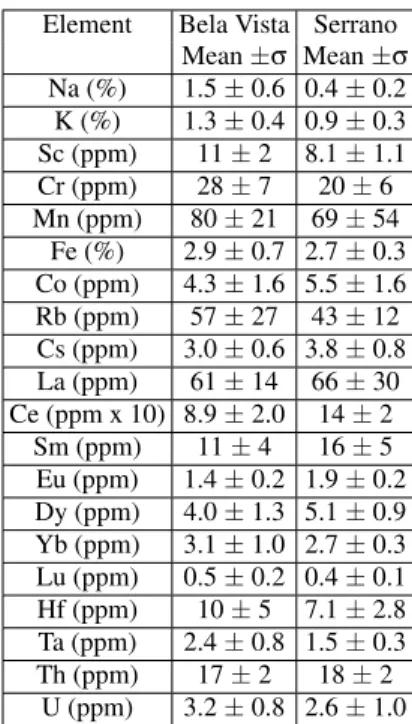
Element Bela Vista Serrano Mean±σ Mean±σ Na (%) 1.5±0.6 0.4±0.2 K (%) 1.3±0.4 0.9±0.3 Sc (ppm) 11±2 8.1±1.1 Cr (ppm) 28±7 20±6 Mn (ppm) 80±21 69±54
Fe (%) 2.9±0.7 2.7±0.3 Co (ppm) 4.3±1.6 5.5±1.6 Rb (ppm) 57±27 43±12 Cs (ppm) 3.0±0.6 3.8±0.8 La (ppm) 61±14 66±30 Ce (ppm x 10) 8.9±2.0 14±2
Sm (ppm) 11±4 16±5 Eu (ppm) 1.4±0.2 1.9±0.2 Dy (ppm) 4.0±1.3 5.1±0.9 Yb (ppm) 3.1±1.0 2.7±0.3 Lu (ppm) 0.5±0.2 0.4±0.1 Hf (ppm) 10±5 7.1±2.8 Ta (ppm) 2.4±0.8 1.5±0.3 Th (ppm) 17±2 18±2
U (ppm) 3.2±0.8 2.6±1.0
TABLE I: Characterization of the defined groups by chemical com-position
toγ−ray1332,501 keV
60Co. We have used the technique of gamma-ray spectrometry and the computer code GRGAN [10] for data reduction. Special attention was given to cho-osing the photopeaks, i.e. ensuring that they were free from interference. The elements determined were Ce, Co, Cr, Cs, Dy, Eu, Fe, Hf, Lu, Mn, Na, Rb, Sb, Sc, Sm Ta, Th, Ti, U, and V
IV. STATISTICAL TREATMENT OF THE ANALYTICAL DATA
The elemental concentrations obtained from INAA were used as variables in the statistical treatment. We used the SPSS packet [11], cluster analysis, and principal components analysis [12]. Initially, the data were normalized using ”z-scores,” a transformation that generated new variables with zero average and standard deviation equal to one. In the clus-ter analysis, we used the square Euclidean distance as a me-asure in n-dimensional space, and the hierarchical means in the Ward subroutine (minimum variance). As a result of the cluster analysis, the samples were divided into two groups, the Bela Vista group and the Serrano group, determined from the chemical composition of these groups (Figure2: dendogram). The characterization of these groups was made by the ave-rage and standard deviation of each one of the studied ele-ments (Table I)
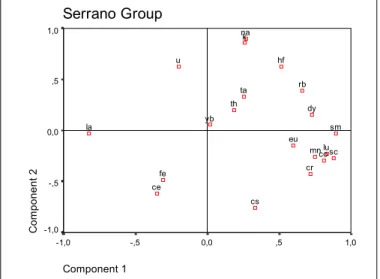
The groups were then analyzed in order to search for evi-dences of correlations between variables. The principal com-ponent analysis (PCA) was used to identify the significant ele-ments that contributed to each cluster. The cluster analysis output is due to differentiated internal correlations. For the
Bela Vista group, the chemical elements in factor 1 (PCA 1) are Dy, Ta, Yb, Co, and Fe; in factor 2 (PCA 2), they are La and Eu (Figure 3). For the Serrano group, the chemical ele-ments in factor 1 (PCA 1) are Mn, Rb, Na, and Ce; in factor 2 (PCA 2), they are are Sm and Dy (Figure 4).
FIG. 2: Dendrogram based on the elemental composition from the archaeological sites Serrano ( SSC ) and Bela Vista( BVC )
FIG. 3: Bela Vista Principal Components Analysis
V. CONCLUSION
Brazilian Journal of Physics, vol. 35, no. 3B, September, 2005 781
FIG. 4: Serrano Principal Components Analysis
VI. ACKNOWLEDGMENTS
Thanks are due to Dr. M. Vasconcellos, Dra. M. Saiki and the Radiochemistry Group at IPEN for the NAA support.
VII. REFERENCES
1. M. C. Ten´orio, (Organizadora), Pr´e-Hist´oria da Terra Brasilis, Editora UFRJ, 376p. Rio de Janeiro, 1999.
2. M. D. Gaspar, A Pr´e-Hist´oria do Estado do Rio de Ja-neiro: Sistemas Sociais Identificados at´e a Chegada dos Europeus, Bol. Mus. Nac., N. S., Antrop., n.60, p.1-22, Rio de Janeiro, 1997.
3. U. M. Franklin, and V. Vitali, The Environmental Stabi-lity of Ancient Ceramics, Archaeometry, London, v.27, n.1, p 3-15, 1985.
4. R. M. Latini, A. V. B. Bellido, Dias Jr., and L. F. Bel-lido, Determining the Provenience of Prehistoric
Cera-mic Artifacts from the Amazon Basin Using Geoche-mical Tracers, Environmental Geochemistry in Tropical and Subtropical Environments, Springer-Verlag, v.1, p. 93-99, 2004.
5. R. M. Latini, Caracterizac¸˜ao, An´alise e Datac¸˜ao de Cerˆamicas Arqueol´ogicas da Bacia Amazˆonica atrav´es de T´ecnicas Nucleares, Ph. D. Thesis, Universidade Fe-deral Fluminense, Niter´oi, Brazil, 157p, 1998.
6. A. V. B. Bellido, Neutron Activation Analysis of Anci-ent Egyptian Pottery, Ph. D. Thesis, University of Man-chester, ManMan-chester, UK, 324p, 1989.
7. R. P. Paiva, C. S. Munita, and M. A. Alves, Po-tencialidade da AANI em Estudos de Cerˆamicas Ar-queol´ogicas, VII Congresso Geral de Energia Nuclear, CGEN-ABEN, Belo Horizonte, MG, Brazil, 27-30 Oc-tober, 1998.
8. R. M. Latini, A. V. B. Bellido Jr., M. B. A. Vasconce-los, and O. F. Dias Jr., Classificac¸˜ao de cerˆamicas ar-queol´ogicas da Bacia Amazˆonica, Quimica Nova 24, 724 (2001).
9. R. M. Latini, A. V. B. Bellido Jr., and A. Buarque, Estudos de classificac¸˜ao e datac¸˜ao de cerˆamicas ar-queol´ogicas do Estado do Rio de Janeiro, V Con-gresso de Geoqu´ımica dos Pa´ıses de L´ıngua Portuguesa and VII Congresso Brasileiro de Geoqu´ımica, 333-335, 1999.
10. G. R. Gilmore, Sources Uncertainty in Neutron Activa-tion Analysis of Pottery, Technical Report, Universities Research Reactor, Risley (1983)
11. SPSS Inc. 444, North Michigan Ave. Chicago IL, 60611.