RBRH, Porto Alegre, v. 23, e27, 2018 Scientific/Technical Article
https://doi.org/10.1590/2318-0331.231820170124
Monitoring water quality of the Sergipe River basin: an evaluation using multivariate
data analysis
Monitoramento da qualidade da água da bacia do Rio Sergipe: uma avaliação usando análise multivariada de dados
José do Patrocinio Hora Alves1, Lucas Cruz Fonseca2, Raisa de Siqueira Alves Chielle3
and Lúcia Calumby Barreto Macedo2
1Universidade Federal de Sergipe, São Cristóvão, SE, Brasil
2Instituto Tecnológico e de Pesquisas do Estado de Sergipe, Aracaju, SE, Brasil 3Universidade Federal do Ceará, Fortaleza, CE, Brasil
E-mails: jphalves@uol.com.br (JPHA), lcfonseca93@gmail.com (LCF), oc.raisasiqueira@gmail.com (RSAC), ditec@itps.se.gov.br (LCBM)
Received: August 09, 2017 - Revised: March 12, 2018 - Accepted: May 09, 2018
ABSTRACT
This study evaluated the efficiency of the water quality monitoring network of the Sergipe river basin, using multivariate data analysis, such as principal component analysis (PCA) and hierarchical cluster analysis (HCA). The PCA was applied to a data matrix consisting of 12 sampling stations and mean concentrations of 23 water quality parameters, obtained in four sampling campaigns from June/2013 to November/2015. All 12 sampling stations were considered as main (weight>0.7) and therefore should remain in the monitoring program. The PCA pointed out that of the 23 measured parameters, only 16 are essential for water quality assessment, in the dry period and 17 in the rainy season. The HCA separated the stations of the monitoring network in 4 groups according to the water quality characteristics, considering the natural and anthropogenic impacts. The main impacts were originated from natural sources (mineral constituents) and the anthropogenic contributions were associated with urban input, sewage, industrial dumps and surface runoff from agricultural areas.
Keywords: Monitoring; Water quality; Principal component analysis; Cluster analysis; Sergipe River.
RESUMO
Nesse estudo foi avaliada a eficiência da rede de monitoramento da qualidade da água da bacia hidrográfica do rio Sergipe, usando a análise multivariada de dados, através da análise de componentes principais (ACP) e análise de agrupamento hierárquico (AAH). A ACP foi aplicada a uma matriz de dados composta por 12 estações de amostragem e concentrações médias de 23 parâmetros da qualidade da água, obtidos em quatro campanhas de amostragem no período de junho/2013 a novembro/2015. Todas as 12 estações de amostragem foram consideradas como principais (peso>0,7) e, portanto, devem ser mantidas no programa de monitoramento. A ACP apontou que dos 23 parâmetros medidos, são essenciais para avaliação da qualidade da água, apenas 16 no período seco e de 17 no período chuvoso. A AAH separou as estações da rede de monitoramento em 4 grupos em função das características da qualidade da água, considerando os impactos naturais e antropogênicos. Os principais impactos foram originários de fontes naturais (constituintes minerais) e de aportes antropogênicos associados a despejos urbanos, sanitários, indústrias e escoamento superficial de áreas agrícolas.
INTRODUCTION
The increasing pressure upon water resources, leading to deterioration of water quality in rivers, lakes, reservoirs and groundwater, has become a global issue, and therefore many countries started to adopt in water governance an integrated approach, as recommended by Agenda 21 in 1992 (UNEP, 2012). Such approach has been called Integrated River Basin Management (IRBM) and implies the joint management of human activities and natural resources inserted in areas drained by a river and its tributaries.
One of the main challenges for IRBM is the water quality assessment in a particular river basin, by means of a monitoring program that generates relevant and reliable information and which can be used by managers in the decisions related to river basins protection and pollution control (BEHMEL et al., 2016). The monitoring program must contribute to clarify the several processes which affect water quality, both the natural-origin ones and those ones resulting from anthropogenic impacts, induced by point or diffuse sources of pollution (KHALIL; OUARDA, 2009; CALIJURI et al., 2012; BU et al., 2014; CHAPMAN et al., 2016).
Water quality monitoring consists in the acquisition of a set of physical, chemical and biological data from a certain water body, including its spatial and temporal variation. For this purpose, a good planning of the local sampling network is indispensable, in order to enable the acquisition of required basic values to carry out an analysis of short and long-term trends (STROBL; ROBILLARD, 2008).
In the design of a monitoring network, a fundamental aspect is the choice of representative sampling locations in the water body, otherwise it runs the risk of having a monitoring program which is “rich in data, but poor in information” (WARD et al., 1986; KHALIL; OUARDA, 2009; TIMMERMAN et al., 2010; BEHMEL et al., 2016). A common and still widely used practice consists in the choice of location for sampling stations based on available knowledge and on subjective criteria, such as: easily accessible locations; upstream and downstream stations, in areas with pollution sources or intensive land use, densely populated and highly industrialized regions (KHALIL; OUARDA, 2009). Another aspect to be highlighted is that, having established the monitoring network, a revaluation to verify its effectiveness is not usually made (CHILUNDO et al., 2008; STROBL; ROBILLARD, 2008; VAREKAR et al., 2015). Horowitz (2013) recommend that managers and users often make a full assessment of the monitoring program too often, including data and generated interpretations and field locations. Villas-Boas et al. (2017), in the study of Piabanha river (Rio de Janeiro – Brazil), point out the need for a periodic assessment of the monitoring network to check if the intended goals are being economically achieved.
In recent decades, studies have increasingly been focusing on the design of monitoring networks and new methodologies have been proposed (KHALIL; OUARDA, 2009; MAVUKKANDY et al., 2014), in which stand out the multivariate data analysis, through principal component analysis (PCA) and hierarchical cluster analysis (HCA). These techniques have been employed to evaluate the efficiency of the surface water quality monitoring network, aiming to optimize the number of sampling stations and to select critical water quality parameters. This way, it is possible to identify
and remove stations and/or redundant parameters, reducing financial costs for the monitoring program, without sacrificing data variance of water quality.
A usual disadvantage of such techniques is that they only enable to identify monitoring stations to be discontinued, and, sometimes, for improving the monitoring network, it is necessary not only the discontinuity of some current stations, but also the inclusion of other stations located in still uncovered locations. This is a result of the assessment being focused on water quality data already obtained, disregarding the characteristics of the river basin under study (KHALIL; OUARDA, 2009). Despite this, principal component analysis and hierarchical cluster analysis have been greatly accepted and they are being very used in monitoring programs, for spatial optimization of sampling locations and selection of the most suitable water quality variables (SINGH et al., 2004; OUYANG et al., 2006; SHRESTHA; KAZAMA, 2007; RAZMKHAH; ABRISHAMCHI; TORKIAN, 2010; ZHAO et al., 2011; WANG et al., 2012; CHEN et al., 2012; BONANSEA et al., 2015; BU et al., 2014; TANOS et al., 2015; PHUNG et al., 2015; VAREKAR et al., 2016).
The Water Quality Monitoring Program of River Basins in Sergipe State (WQMP) started in 2013. Previously, studies undertaken considered only some rivers and reservoirs individually, not covering the river basin as a whole. The State Secretariat of Environment and Water Resources (SEMARH) is the higher authority responsible for the management of WQMP. In other respects, the Superintendence of Water Resources (SRH) must play the role of coordinating and executing it, in addition to having been also responsible for planning the monitoring program (goal setting, variable selection, sampling frequency, location of sampling stations). The technical execution, including sample collection, field measurement, sample analysis, storage and transfer of data, was carried out by the Technological and Research Institute of Sergipe State (ITPS). WQMP covers 7 river basins and 18 reservoirs, on a total of 59 sampling stations and 34 water quality parameters. At the first stage of WQMP, 4 sampling campaigns were conducted from June 2013 to November 2015, funded by SEMARH.
This study aimed to evaluate the efficiency of the water quality monitoring network of the Sergipe river basin, using principal component analysis (PCA) and hierarchical cluster analysis (HCA). Therefore, it is intended to identify the sampling stations which are the most important for the monitoring program; to select the most representative water quality parameters and to estimate the potential sources, natural and/or anthropogenic-based, which influence the water quality in each of the sampling stations. Thus, it is expected to contribute to improvements in the monitoring program and to guide managers with respect to priorities and decision-making.
MATERIAL AND METHODS
Study area
area in the State of Bahia. The area of the river basin covers a total of twenty-six cities, with a population of 933,625 inhabitants, where 840,325 live in the urban area and 93,300 in the rural area. The main use and occupation of the land in this region are: urban land; native vegetation; sugarcane and maize cultivation and pasture (IBGE, 2010; SEMARH, 2017).
The Sergipe river, extending 206.5 km, is the main watercourse in the river basin. It begins in Serra da Boa Vista, near the state border of Bahia and Sergipe (Poço Redondo city), and it flows to the Atlantic Ocean, between the cities of Aracaju and Barra dos Coqueiros. Its main tributaries are the rivers Jacarecica, Continguiba, Sal and Poxim, on the right edge, and the rivers Ganhamoroba, Parnamirim and Pomonga, on the left edge (SEMARH, 2017).
The Sergipe River Basin has a hydrological regime consisting of intermittent runoffs in the upper and middle basin and perennial runoff after the Nossa Senhora das Dores city. The seasonal rainfall variation has shown a precipitation which is spread throughout the year, in well-defined dry and rainy periods. The dry period corresponds to the months between September and March, with precipitation values lower than 40 mm between October and January, while the rainy period occurs from April to August, with precipitation values, between May and July, higher than 140 mm (COHIDRO, 2015).
The area under study is presented in Figure 1 and sampling stations are detailed in Table 1. The location of the sampling stations placed a high priority on the region in the river basin with permanent regime and they have been chosen based on available knowledge and of subjective criteria, such as: easily accessible locations; locations with river gauging stations; areas with water withdrawal to supply human consumption and areas with a large number of bestowals for water usage (SOUZA et al., 2007).
In the region under study, besides Sergipe river, the sub-basins of rivers Jacarecica, Poxim e Cotinguiba also stand out.
The Poxim river sub-basin is composed by the rivers: Poxim-Mirim, Poxim-Açu, Pitanga and Poxim. It drains an area of 398 km2, including the cities of Aracaju, Areia Branca, Itaporanga d´Ajuda, Nossa Senhora do Socorro and São Cristóvão, which together accommodate a population of 858,116 inhabitants. Aracaju and Nossa Senhora do Socorro are the most populous cities, with 85% of the population in the region and they account for two of the three industrial hubs in the state. Farming is also well developed in the region, especially in large properties for sugarcane cultivation in Middle Poxim and along the Poxim-Mirim river. The Poxim-Açu river is the main water body of the sub-basin, where there are some rural properties in its mid-course and it presents most of its edge deforested, as a result of the intense process of predatory use and occupation of the land. Along Poxim river, there are
several housing developments which release untreated sanitary discharges into the river (AGUIAR NETTO, 2006; IBGE, 2010).
The Jacarecica river sub-basin covers the cities of Itabaiana, Areia Branca, Malhador, Moita Bonita and Riachuelo, with a territorial area of 470 km2 and a population of 136,252 inhabitants. The predominant economic activity in the region is farming, mainly vegetable polyculture. In such sub-basin, there are the reservoirs Jacarecica I and II, which, together, serve an irrigated area of 470 ha (SANTOS, 2012; CUNHA et al., 2013).
The Cotinguiba river sub-basin consists of the cities: Areia Branca, Riachuelo, Laranjeiras and Nossa Senhora do Socorro, with a drainage area of 232.5 km2 and a population of 213,971 inhabitants. Laranjeiras and Nossa Senhora do Socorro concentrate 72% of the sub-basin total area. The Cotinguiba region, since colonial period, is linked to sugarcane culture.
The state of Sergipe is the largest cement producer in Northeastern Brazil and three of the four cement plants in the state are located in the cities of Laranjeiras and Socorro.
The Cajueiro dos Veados Creek is located in the city of Malhador (12,042 inhabitants) whose territorial and economic expansion took place based on the substitution of native vegetation by pasture and agricultural cultivation (HORA, 2006).
Water quality data
The Water Quality Monitoring of Sergipe river basin is included in The Water Quality Monitoring Program of River Basins in Sergipe State (WQMP) and it comprises 12 sampling stations and assessment of 34 water quality parameters.
In this study, it has been used a data set from four sampling campaigns, two in the dry period and two in the rainy period, with respect to 23 variables: pH, temperature, color, turbidity, electrical conductivity, total dissolved solids, total alkalinity, total hardness, dissolved oxygen, biochemical oxygen demand, dissolved organic carbon, sodium, potassium, calcium, magnesium, bicarbonate, sulfate, chloride, nitrate, ammoniacal nitrogen, total phosphorus, chlorophyll a and thermotolerant coliforms. The values of trace metals, phosphate and nitrite were discarded, because, in general, they were lower than limit for detection of the method.
Data processing
To evaluate the monitoring network and select the critical water quality parameters, multivariate data analysis was used, through principal component analysis and hierarchical cluster analysis
Principal component analysis (PCA) is a statistical technique applied to reduce data set dimensionality, which can be comprised by a large number of water quality parameters and sampling stations, keeping as much as possible the original data reliability. Reducing is obtained by converting data set into new variables, called principal components, which are orthogonal (not correlated) and organized in decreasing order of importance (SINGH et al., 2004; SHRESTHA; KAZAMA, 2007). A single or a few water quality parameters can often be the main source of variability and, in this case, the first principal component will be greatly represented by these parameters, what leads the other principal components to a low or negligible variance. In order to correct this deviation, instead of applying a PCA to the covariance matrix, the correlation matrix has been used, which is equivalent to variable normalization (KHALIL; OUARDA, 2009; WANG et al., 2012).
Hierarchical cluster analysis (HCA) is an exploratory technique with the purpose of grouping objects based on their similarities, where the variance is minimized inside a group and maximized between groups (EVERITT et al., 2011). The HCA was carried out using Ward’s method and Euclidean distance as a measurement of similarity – groups with shorter distance means more similarity between them.
The HCA was applied to the data set aiming to group sampling stations based on their similarity of physicochemical water composition of each station. Data was normalized through z-score technique. In this technique, normalized data has an mean value of 0 and variance equals to 1. Normalization is always recommended in case of water quality data, once it presents parameters with very different variances, which reduces the influence of parameters with high variability (KHALIL; OUARDA, 2009).
All tests were performed by means of the program PAST – Paleontological Statistics, version 3.04 (HAMMER et al., 2001). A value of 0.05 was adopted as critical level for every statistical test, resulting on a 95% confidence level.
RESULTS AND DISCUSSION
The study was conducted through data from WQMP, regarding the four campaigns that took place between 2013 and 2015, two in the dry period and two in the rainy period. Data Table 1. Sampling stations description.
Code City River Geographical Coordinates F11 N. Sra das Dores Sergipe 10°31’22.6” S 37°14’48.1” W F12 Moita Bonita Jacarecica 10°38’13.2” S 37°21’59.6” W F13 Aracaju Poxim 10°55’17.6” S 37° 5’58.6” W F14 São Cristóvão Poxim Açu 10°55’10.6” S 37°11’10.6” W F15 Socorro Poxim Mirim 10°53’54.6” S 37°10’42.8” W F16 São Cristóvão Pitanga 10°58’7.1” S
37° 8’48.6” W F17 Laranjeiras Cotinguiba 10°58’7.1” S 37° 8’48.6” W F18 Laranjeiras Cotinguiba 10°48’15.8” S 37°16’53.7” W F19 Riachuelo Jacarecica 10°42’44.8” S 37°12’37.9” W F20 Malhador Riacho Cajueiro
dos Veados
10°38’36.3” S 37°18’7.4” W FA Sta. Rosa de
Lima
was used separately, in order to investigate monitoring network performance and rationalize water quality parameters, during dry and rainy periods.
For PCA and HCA, the mean values of parameters were used in each sampling station, during dry and rainy periods. The statistical description, such as minimum, maximum and mean values and standard deviation, are summarized in Table 2. Data matrix was formed by the 12 sampling stations and by mean concentrations of the 23 water quality parameters. To identify the principal monitoring network stations, the matrix was organized taking the 12 sampling stations as variables and the 23 water quality parameters as objects. To select critical water quality parameters, the matrix was inverted, or in other words, the 12 monitoring stations were considered objects, whereas the 23 water quality parameters were considered variables. Weight values higher than 0.7 were considered significant; as adopted in other studies (MAVUKKANDY et al., 2014; WANG et al., 2012; VAROL et al., 2012, CALIJURI et al., 2012; BARAKAT et al., 2016). That is to say that parameters and sampling stations with weights higher than 0.7 are considered relevant, once they represent a greater variability of water quality.
Evaluation of monitoring stations
PCA was applied to identify the main water quality monitoring stations of Sergipe river basin. Stations that hold the maximum variations of water quality are considered the principal stations
and must be kept on the monitoring program. While non-principal stations are those ones located in not representative places in the water body and, therefore, obtained data is not significant, i. e., it does not have significance for quality assessment, and, consequently, they can be removed from the monitoring network (SANDERS et al., 1983).
The main stations are those which have the largest contribution (highest weight) to composition of principal components (PC). The weights stand to the station projections on the subspace of PC and coincide with correlation coefficient between PC and station (SINGH et al., 2004).
The relevant principal components, those that enable to understand basic data structure, with their respective variance and weights, are shown in Table 3.
For dry and rainy periods, the first two PC accounted for 97.7% and 98.6% of total variance in the water quality, respectively.
During dry period, all stations, except for F18, contributed with a weight higher than 0.7 for PC1 composition. While for PC2 composition, only station F18 had a weight higher than 0.7.
During rainy period, only stations F11, FA and FM had weights lower than 0.7 in PC1, and those same stations were the only stations to show weights higher than 0.7 in PC2.
Stations with weight higher or equal to 0.7 are considered principal stations, whereas stations with weight lower than 0.7 are classified as non-principal stations (MAVUKKANDY et al., 2014).
Therefore, based on components PC1 and PC2, it is possible to conclude that all 12 stations, both in dry and rainy periods, are
Table 2. Surface water quality parameters of the Sergipe River Basin (minimum, maximum and mean values, and standard deviation, in dry and rainy periods).
Water quality parameters
Dry period Rainy period
Min. Max. Mean Standard
deviation Min. Max. Mean
Standard deviation
pH 6.6 7.9 7.4 0.4 6.3 8.0 7.3 0.5
Electrical conductivity (µS cm-1) 94.3 6392 1018 1760 75.3 9840 1386 2815
Turbidity (NTU) 3.1 20.1 7.8 4.8 2.1 104 28.2 28.8
Dissolved oxygen (mg L-1) 2.05 7.18 5.02 1.45 1.72 7.81 5.75 1.70
Total alkalinity (mg L-1 CaCO
3) 9.73 351.2 125.0 93.7 8.47 337.8 113.5 93.4
Total hardness (mg L-1 CaCO
3) 9.76 998.7 214.3 279.1 9.45 1927 257.0 535.9
BOD5 (mg L-1) 6.15 31.05 13.91 7.05 4.33 40.39 12.48 10.17
Chlorophyll a (µg L-1) 0.01 7.59 2.35 1.89 1.27 8.99 3.71 2.21
Total dissolved solids (mg L-1) 52.83 4140 616.8 1142 42.18 5719 811.5 1644
Water temperature (oC) 23.0 29.0 26.8 1.7 23.1 27.5 24.7 1.3
Bicarbonate (mg L-1) 9.73 351.2 124.6 93.5 8.47 317.8 108.1 90.6
Color (Hazen) 0.1 10.3 2.5 2.8 0.4 20.3 5.9 6.1
Total phosphorus (mg L-1) 0.02 0.38 0.10 0.10 0.28 0.43 0.31 0.05
Sodium (mg L-1) 9.37 678.9 94.7 188.4 10.95 1065 148.0 311.0
Potassium (mg L-1) 0.83 15.13 3.61 4.04 1.33 18.48 4.82 5.40
Calcium (mg L-1) 0.78 244.4 54.89 67.54 0.63 350.9 55.79 98.45
Magnesium (mg L-1) 1.33 132.1 18.88 36.78 1.61 309.9 33.87 88.03
Nitrate ((mg L-1) 0.11 1.88 0.49 0.51 0.10 2.06 0.62 0.59
Ammoniacal nitrogen (mg L-1) 0.07 0.39 0.13 0.09 0.04 0.19 0.07 0.04
Sulfate (mg L-1) 1.55 164.9 21.95 45.96 1.67 110.0 17.10 30.22
Chloride (mg L-1) 14.78 1735 206.0 486.8 15.02 2870 342.3 827.4
Dissolved organic carbon (mg L-1) 2.6 18.3 8.8 4.6 5.0 23.6 10.5 4.8
Thermotolerant coliforms (MPN/100mL)
considered principal stations and thereby must be kept into the monitoring network of Sergipe river basin.
In similar study on St. Johns river, in Florida (USA), Ouyang (2005) identified, based on PCA, that 3 monitoring stations were less important (non-principal) for explaining annual data variance of water quality and, therefore, the number of sampling stations could be reduced from 22 to 19. He concluded that PCA is a useful tool to determine monitoring stations relevance.
Wang et al. (2014), aiming to reduce costs for water surface monitoring program in Tamsui river basin, in Taiwan, suggested, based on results of PCA and HCA, the elimination of redundant sampling stations and parameters. By doing this, the monitoring program, which in 2011 was composed by 38 sampling stations and measurement of 14 parameters, was reduced to 28 stations and 6 parameters.
Selection of critical water quality parameters
Water quality is defined by a set of physical, chemical and biological parameters. Whereas it is not always practical or has financial resources for measuring all parameters of interest, it has been proposed methods for revaluation and reselection, that
helps on reducing the number of measured parameters, without a substantial loss of information (STROBL; ROBILLARD, 2008; KHALIL; OUARDA, 2009).
Thus, the selection of parameters for surface water quality assessment is a very complex issue, and, for a more appropriate selection, two approaches have been suggested in the literature, the correlation and regression analysis and the principal component analysis. It has also been highlighted that PCA gives a better estimative for more representative water parameters, than those ones obtained by conventional correlation analysis (KHALIL; OUARDA, 2009).
PCA results applied to data set from dry and rainy periods are shown on Table 4. For both periods, the five components were considered most representative, since, when combined, they account for 89.4% to 90.0% of total variance, for dry and rainy period, respectively.
During dry period, PC1 accounts for 49.9% of total variance and has a strong positive correlation (weight>0.7) with electrical conductivity, total dissolved solids, hardness, chlorophyll a, dissolved organic carbon and the ions Na, K, Ca, SO4, Cl and ammoniacal nitrogen. PC2, with a total variance of 17.1%, presented a strong positive correlation with alkalinity and bicarbonate, and negative correlation with nitrate. PC3 (total variance of 9.8%) showed a correlation greater than 0.7 only with total phosphorus. For PC4 (total variance of 8.1%) and PC5 (total variance of 4.5%), all weights for parameters were lower than 0.7.
During rainy period, PC1 accounts for 46.9% of total variance and has a strong positive correlation with electrical conductivity, total dissolved solids, hardness, chlorophyll a and the ions Na, K, Ca, SO4, Cl and ammoniacal nitrogen. PC2, with a total variance of 17.1% showed a strong positive correlation with color and total phosphorus. In PC3 (total variance of 10.6%) there is one strong positive correlation, only with temperature. In PC4 (total variance of 9.0%) a strong negative correlation occurred with alkalinity and bicarbonate. PC5 showed strong positive correlation with thermotolerant coliforms and negative correlation with turbidity.
As a result, PCA points out as essential parameters for water quality assessment, those which weights were higher than 0.7. This means that the number of essential parameters is 16 for dry period and 17 for rainy period. The 13 parameters common to both periods were: electrical conductivity, alkalinity, hardness, chlorophyll a, total dissolved solids, total phosphorus, sodium, potassium, calcium, magnesium, bicarbonate, sulfate and chloride. The other parameters are associated to seasonal rainfall variation, showing weights higher than 0.7 for only a specific time period. The nitrate fits into such situation, besides the ammoniacal nitrogen and dissolved organic carbon in dry period, and turbidity, color, temperature and thermotolerant coliforms in rainy period. It indicates that concentration variabilities (Table 2) of nitrate (0.11 to 1.88 mg L-1), ammoniacal nitrogen (0.07 to 0.39 mg L-1) and dissolved organic carbon (2.6 to 18.3 mg L-1) were statistically more significant for dry period, what can be associated to the anthropogenic input of nitrogen and organic matter, original from point sources, which are diluted in rainy period. The variation (Table 2) of temperature (23.1 to 27.5 °C), color (0.4 to 20.3 uH), turbidity (2.1 to 104 NTU) and thermotolerant coliforms (355 to 175175 MPN/100 mL) were Table 3. Values of monitoring station weight in the composition
of the first two principal components PC1 and PC2 (values in bold stands to weight > 0.700, which indicates strong correlation).
Monitoring stations PC1 PC2 Dry period
F11 0.721 -0.636
F12 0.777 0.628
F13 0.798 -0.585
F14 0.813 -0.560
F15 0.950 -0.153
F16 0.959 0.221
F17 0.865 0.503
F18 0.646 0.763
F19 0.927 -0.367
F20 0.967 0.233
FA 0.759 -0.636
FM 0.728 0.684
% Total variance 69.2 28.5
% Cumulative variance 69.2 97.7 Rainy period
F11 0.498 0.851
F12 0.996 -0.094
F13 0.997 -0.082
F14 0.995 -0.103
F15 0.995 -0.103
F16 0.993 -0.120
F17 0.992 -0.124
F18 0.997 -0.071
F19 0.999 -0.043
F20 0.990 -0.140
FA 0.140 0.976
FM 0.362 0.872
% Total variance 77.5 21.1
more significant for rainy period and can be associated to lower temperatures that commonly happen during this period and to increase in input through surface runoff from urban areas and sanitary discharges, respectively.
Estimation of impact sources in the sampling stations
In order to identify potential sources that influence on water quality in Sergipe river basin, it was used the contribution measure of each PC (scores) to different sampling stations. It was selected, for dry and rainy periods, five principal components, because, combined, they account for 90% of total variance (Table 4). Figures 2 and 3 show PC score distribution for the different sampling stations, for dry and rainy periods, respectively. High PC score values indicate higher contribution (higher weight) to parameters associated to the PC, for the water quality in the respective sampling station (MAVUKKANDY et al., 2014).
Figures 2 and 3 show that the stations with positive scores greater than 1, for each PC, were F11, F13, F18, F20 and FM in dry period, and F11, F12, F13, F17 and F20 in rainy period.
In the station F11, PC1 was the only component to present a higher score (3.0), being strongly associated, in dry period, to mineral constituents of water (conductivity, hardness, Na, K, Ca, Mg, SO4, Cl), and to ammoniacal nitrogen, dissolved organic carbon and chlorophyll a. While, in rainy period, it correlated only with
mineral constituents and chlorophyll a (Table 4). In general, the mineral constituents are originated from natural sources related to mineral ions from draining base, soil weathering and surface runoff (VAROL et al., 2012; CALIJURI et al., 2012). It can be observed in F11, a significant difference (one-way ANOVA) in the mineral composition of water, between dry and rainy periods, with higher values in rainy period (Table 2), what suggests an expressive mineral input through surface runoff, in rainy period. Table 4. Experimental parameters weight for the five principal components (PC1, PC2, PC3, PC4, PC5) in dry and rainy periods.
Water quality parameters Dry period Rainy period
PC1 PC2 PC3 PC4 PC5 PC1 PC2 PC3 PC4 PC5
pH 0.434 0.327 -0.067 -0.599 -0.335 0.624 0.421 -0.140 -0.248 -0.091 Electrical Conductivity (µS cm-1) 0.984 -0.075 -0.119 0.067 0.020 0.979 -0.052 -0.080 0.169 0.003
Turbidity (NTU) -0.379 -0.098 -0.363 0.221 0.380 -0.303 0.487 -0.055 0.177 -0.747
Dissolved oxygen (mg L-1) 0.028 -0.698 -0.009 -0.365 -0.555 0.095 0.497 -0.699 0.263 -0.024
Total alkalinity (mg L-1 CaCO
3) 0.342 0.738 0.148 -0.487 0.249 0.583 -0.250 -0.066 -0.728 -0.018
Total hardness (mg L-1 CaCO
3) 0.954 0.088 -0.113 -0.064 0.063 0.971 -0.076 -0.021 0.143 -0.009
BOD5 (mg L-1) -0.315 0.361 -0.198 0.599 -0.080 -0.235 -0.630 0.595 0.306 -0.007
Chlorophyll a (µg L-1) 0.917 -0.244 0.135 -0.036 -0.142 0.710 0.389 0.194 0.190 -0.177
Total dissolved solids (mg L-1) 0.982 -0.084 -0.118 0.092 0.023 0.979 -0.056 -0.088 0.161 0.005
Water temperature (°C) -0.102 0.500 -0.692 0.089 -0.090 0.532 0.048 0.747 -0.120 0.008 Bicarbonate (mg L-1) 0.341 0.742 0.150 -0.481 0.252 0.618 -0.191 -0.103 -0.715 -0.023
Color (Hazen) 0.052 -0.682 0.542 -0.239 0.206 -0.243 0.795 0.055 0.173 -0.211 Total phosphorus (mg L-1) -0.017 0.516 0.787 0.287 -0.071 -0.199 0.894 0.293 -0.018 0.090
Sodium (mg L-1) 0.979 -0.126 -0.096 0.123 -0.008 0.972 -0.025 -0.087 0.186 0.010
Potassium (mg L-1) 0.969 -0.027 0.052 0.070 -0.045 0.918 0.141 -0.029 0.103 0.100
Calcium (mg L-1) 0.938 0.226 -0.061 -0.010 0.141 0.954 -0.139 -0.030 0.006 -0.017
Magnesium (mg L-1) 0.978 -0.111 -0.122 0.109 -0.002 0.961 -0.028 -0.016 0.253 -0.004
Nitrate ((mg L-1) 0.253 -0.776 0.221 -0.021 0.444 0.179 0.699 0.386 -0.205 0.498
Ammoniacal nitrogen (mg L-1) 0.908 -0.018 0.192 0.323 -0.109 -0.083 -0.425 0.479 0.537 0.043
Sulfate (mg L-1) 0.980 -0.062 -0.056 0.141 0.017 0.981 -0.028 -0.031 0.113 -0.020
Chloride (mg L-1) 0.971 -0.131 -0.103 0.163 0.007 0.971 -0.036 -0.059 0.225 0.005
Dissolved organic carbon (mg L-1) 0.770 0.389 0.030 -0.024 -0.005 0.417 0.565 0.643 -0.220 -0.148
Thermotolerant coliforms (MPN/100mL)
-0.029 0.445 0.677 0.398 -0.195 -0.199 0.396 -0.230 0.268 0.740
Total variance (%) 49.9 17.1 9.8 8.1 4.5 46.9 17.1 10.6 9.0 6.4 Cumulative variance (%) 49.9 67.0 76.8 84.9 89.4 46.9 64.0 74.6 83.6 90.0
The correlation with dissolved organic carbon and ammoniacal nitrogen indicates a contamination by sanitary discharges and/or surface runoff from urban and rural areas. Sanitary discharges can reach river environment when they are disposed in an inadequate way on septic tanks or when they are directly released into the river (CALIJURI et al., 2012). The correlations with dissolved organic carbon and ammoniacal nitrogen were high (> 0.7) only in dry period, which indicates a punctual input of sanitary discharges. Chlorophyll a is an indication of algae production and a result of nutrient availability, in both dry and rainy periods.
In the station F12, scores were high for PC2 (1.7) and PC3 (2.2) during rainy period, and lower than 1 in dry period. In rainy period, PC2 had a strong association to color and total phosphorus and a moderate association (> 0.5 and < 0.7) to nitrate and dissolved organic carbon; whereas PC3 had a strong correlation with temperature and moderate correlation with BOD5 and dissolved organic carbon. Taking into account that F12 has the influence of urban area and agricultural activities developed on the Jacarecica river sub-basin and that PC2 score was significant only in rainy period, surface runoff on agricultural area and urban discharges can explain the input of phosphorus, nitrate and organic matter (BOD5 and dissolved organic carbon), respectively. The strong correlation with temperature is consequence of the higher variability of water temperature during rainy periods.
According to Phung et al. (2015), BOD5 and dissolved organic carbon can represent the influence of sewage discharges, agricultural activities and industrial effluents. The authors also comment that there is explicitly an abundance of point and diffuse sources of nutrients (N,P) in a mixed urban/agricultural environment.
The station F13 is located in the most urbanized area of the basin, in the city of Aracaju, and the most significant principal components in this sampling location were PC4 (score = 1.2) and PC5 (score = 1.5) in dry period, and PC3 (score = 1.6) in rainy period. PC4 and PC5 presented a moderate association to pH, BOD5 and dissolved oxygen, respectively. PC3 has a strong correlation with temperature and a moderate correlation with BOD5 and dissolved organic carbon. BOD5 and dissolved organic carbon are organic matter-related parameters and, despite of the moderate correlations, in F13 samples it was registered high
concentrations of BOD5 and very low values of dissolved oxygen (Table 2), in both dry and rainy periods. In the region of Poxim river, there are the most populous municipalities (Aracaju and Nossa Senhora do Socorro), 2/3 of industrial hubs in the state and, around F13, there are several housing developments that discharge their sanitary effluents directly into the river. Thus, results of PC3, PC4 and PC5 suggest the impacts of F13, from urban and industrial inputs, originated from point and diffuse sources.
In F14, only in rainy period it was registered a score greater than 1, for PC4, what suggests impact of sanitary discharges from diffuse sources.
In F17, the principal component PC2 (score = 1.3) stood out, only in rainy period. Whereas PC2 has a strong correlation with color, total phosphorus and moderate correlation with nitrate and dissolved organic carbon, and also F17 is located in a city with a wide area of sugarcane plantation, the surface runoff from agricultural area should be the main impact factor on water quality in station F17.
In the station F18, the highest score (2.1) was from PC3 and it occurred only in the dry period. The PC3 shows a strong correlation with total phosphorus and a moderate correlation with color and thermotolerant coliforms, which indicates a punctual input of sanitary discharges.
In the station F20, it is noticed the contribution of PC3 (score = 1.5) in dry period and PC5 in dry (score = 1.4) and rainy (score = 2.5) periods. PC3 and PC5 have a moderate correlation (0.677) and strong correlation (0.740) with thermotolerant coliforms, respectively, during dry and rainy periods, suggesting significant inputs of sanitary discharges.
Phung et al. (2015) suggest that correlation with coliforms can be associated to contamination by domestic sewage, septic systems, runoff from agricultural areas with cattle raising and effluents from dairy production.
In the station FM, scores greater than 1 could be noticed for PC2 (1.6) and PC5 (1.2), only during dry period. In this period, PC5 presented a moderate negative correlation with dissolved oxygen. In PC2, it occured a strong positive correlation with alkalinity and bicarbonate, a negative correlation with nitrate and a moderate positive correlation total phosphorus and moderate negative correlation with dissolved oxygen and color. Ferreira et al. (2012) identified in several regions in the city of Laranjeiras, where station FM is located, the deposition of particulate matter from cement industries emissions which are located in that municipality. In elemental analysis performed on the particulate material, a high concentration of Ca was observed (FERREIRA et al., 2012) and Gupta et al. (2012) identified the presence Ca2+ at elevated levels in particulates emitted by cement production. Therefore, these results suggest the impact by industrial discharges in station FM, and the high values of alkalinity, bicarbonate and Ca2+, registered in the water from station FM (Table 2), are likely to be related to the deposition of particulate matter emitted by the cement industry.
Similarity of sampling stations
The hierarchical cluster analysis was used to identify the similarity on water quality of the 12 sampling stations, during dry and rainy periods.
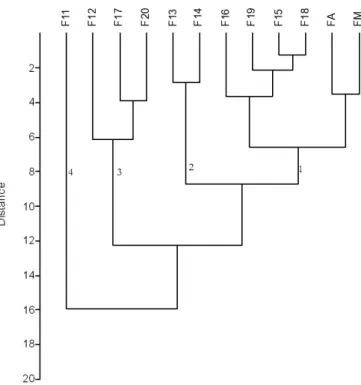
The dendrogram produced for dry period (Figure 4) reveals the presence of 4 main clusters and it corroborates the distribution obtained by PC scores (Figure 2) for the same period.
The Cluster 1 consists of the stations: F12, F13, F14, F15, F16, F17, F19 and FA. In general, these stations have presented scores lower than 1 for all PC (Figure 2) and thus they are stations where water quality in dry period keeps its natural characteristics or whose impacts were negligible. F13, despite of showing scores greater than 1 for PC4 and PC5, is included in Cluster 1. This is probably due to the lack of strong correlations (> 0.7) with water quality parameters in these PC (Table 4).
In Clusters 2, 3 and 4, there are stations with high scores and strong correlations with some water quality parameters, as a consequence of natural and/or anthropogenic impacts. The stations F11 (Cluster 4) and F20 (Cluster 2) are separated from Cluster 3, as a function of the higher concentration of dissolved salts in F11 and higher values of nitrate in F20, whereas in Cluster 3 (FM, F18), it was registered higher concentrations of thermotolerant coliforms.
In the rainy period, dendrogram (Figure 5) also produced 4 main clusters, which are consistent with PC scores (Figure 3), but with a different composition from the dry period.Cluster 1, composed by the stations F15, F16, F18, F19, FA and FM, is characterized by the presentation of scores lower than 1 and thus they are stations not impacted by rainy periods. It can be noted that, in the stations F15, F16, F19 and FA, there were no findings of significant impacts, in both dry and rainy periods. While FM and F18 stations, in the dry period, showed to be impacted by thermotolerant coliforms, what suggests, in this case, the presence of punctual input of sanitary discharges in dry period, which are diluted in rainy period.
Cluster 2 contains the stations F13 and F14, separating from others due to high concentrations of ammoniacal nitrogen, whereas Cluster 3 (F12, F17, F20) distinguished itself due to high values of color and total phosphorus. F11, as in dry period, got separated due to high concentration of dissolved salts. The stations F12, F13, F14 and F17, which in dry period were part of the cluster with not impacted stations, migrated in rainy period, because of anthropogenic impacts from diffuse source, to Clusters 2 and 3.
CONCLUSIONS
This study used multivariate data analysis, through principal component analysis and hierarchical cluster analysis, in order to identify water quality parameters and sampling stations which are the most relevant to the monitoring network of the Sergipe River Basin.
Two different scenarios were considered, the dry and the rainy periods, contemplating in each of them, two campaigns with 12 sampling stations and measurement of 23 water quality parameters.
PCA indicated all the 12 stations are principal, in other words, they hold the highest variations of water quality, in both dry and rainy periods and, therefore, they must be kept into the monitoring program.
From the 23 measured parameters, PCA has shown that only 16 are essential to water quality assessment during dry period, as well as 17 in rainy period. The parameters which were common to both periods were: electrical conductivity, alkalinity, hardness, chlorophyll a, total dissolved solids, sodium, potassium, calcium, magnesium, bicarbonate, sulfate and chloride. The remaining Figure 5. Dendrogram presenting the sampling stations clusters during rainy period.
parameters have varied according to seasonality of rainfalls in the region.
The main impacts on water quality were originated from natural sources (mineral constituents) in station F11, and from anthropogenic inputs associated to urban discharges (F11, F12, F13), sanitary discharges (F12, F13, F14, F20), industrial discharges (F13, FM) and surface runoff from agricultural areas (F12, F17). In stations F15, F16, F19 and FA there were not identified the presence of significant anthropogenic impacts.
Hierarchical Analysis separated the monitoring network stations in 4 clusters, according to water quality characteristics, taking into consideration impacts caused by natural and anthropogenic sources.
ACKNOWLEDGEMENTS
Support for this work was provided by the Project “Monitoring of Surface Springs and Reservoirs of Sergipe”, Agreement 001/2012 between the State Secretariat of Environment and Water Resources (SEMARH) and the Technological and Research Institute of Sergipe State (ITPS) to whom we express our gratitude.
REFERENCES
AGUIAR NETTO, A. O. Descrição geral da sub-bacia hidrográfica do rio Poxim. In: AGUIAR NETTO, A. O.; FERREIRA, R. A.; GARCIA, C. A. B.; ALVES, J. P. H. (Ed.). Diagnóstico e avaliação
da sub-bacia hidrográfica do rio Poxim. Sergipe: EDUFS/FAPESE,
2006. cap. 1, p. 11-27. Relatório final.
BARAKAT, A.; EL BAGHDADI, M.; RAIS, J.; AGHEZZAF, B.; SLASSI, M. Assessment of spatial and seasonal water quality variation of Oum Er Rbia River (Morocco) using multivariate statistical techniques. International Soil and Water Conservation Research, v. 4, n. 4, p. 284-292, 2016. http://dx.doi.org/10.1016/j. iswcr.2016.11.002.
BEHMEL, S.; DAMOUR, M.; LUDWIG, R.; RODRIGUEZ, M. J. Water quality monitoring strategies: a review and future perspectives. The Science of the Total Environment, v. 571, p. 1312-1329, 2016. http://dx.doi.org/10.1016/j.scitotenv.2016.06.235. PMid:27396312.
BONANSEA, M.; LEDESMA, C.; RODRIGUEZ, C.; PINOTTI, L. Water quality assessment using multivariate statistical techniques in Rıo Tercero Reservoir, Argentina. Hydrology Research, v. 46, n. 3, p. 377-388, 2015. http://dx.doi.org/10.2166/nh.2014.174.
BU, H.; MENG, W.; ZHANG, Y. Spatial and seasonal characteristics of river water chemistry in the Taizi River in Northeast China.
Environmental Monitoring and Assessment, v. 186, n. 6, p. 3619-3632, 2014. http://dx.doi.org/10.1007/s10661-014-3644-6. PMid:24477615.
CALIJURI, M. L.; COUTO, E. A.; SANTIAGO, A. F.; CAMARGO, R. A.; SILVA, M. D. F. M. Evaluation of the influence of natural and anthropogenic processes on water quality in Karstic Region.
Water, Air, and Soil Pollution, v. 223, n. 5, p. 2157-2168, 2012. http:// dx.doi.org/10.1007/s11270-011-1012-5.
CHAPMAN, D. V.; BRADLEY, C.; GETTEL, G. M.; HATVANI, I. G.; HEIN, T.; KOVÁCS, J.; LISKA, I.; OLIVER, D. M.; TANOS, P.; TRÁSY, B.; VÁRBÍRÓ, G. Developments in water quality monitoring and management in large river catchments using the Danube River as an example. Environmental Science & Policy, v. 64, p. 141-154, 2016. http://dx.doi.org/10.1016/j.envsci.2016.06.015.
CHEN, Q.; WU, W.; BLANCKAERT, K.; MA, J.; HUANG, G. Optimization of water quality monitoring network in a large river by combining measurements, a numerical model and matter-element analyses. Journal of Environmental Management, v. 110, p. 116-124, 2012. http://dx.doi.org/10.1016/j.jenvman.2012.05.024. PMid:22776756.
CHILUNDO, M.; KELDERMAN, P.; O’KEEFFE, J. H. Design of a water quality monitoring network for the Limpopo River Basin in Mozambique. Physics and Chemistry of the Earth, v. 33, n. 8-13, p. 655-665, 2008. http://dx.doi.org/10.1016/j.pce.2008.06.055.
COHIDRO – CONSULTORIA, ESTUDOS E PROJETOS.
Elaboração dos planos de bacias hidrográficas dos rios Japaratuba, Piauí e
Sergipe. Aracaju: COHIDRO, 2015. 448 p. Relatório final.
CUNHA, C. J.; PINHEIRO, L. S.; HOLANDA, F. S. R. Sistemas agrários e sustentabilidade de agroecossistemas no município de Itabaiana/SE. In: CONGRESSO BRASILEIRO DE SISTEMAS: PENSAR A COMPREENSÃO DE SISTEMAS, 9., 2013, Palmas.
Anais… Palmas: Universidade Estadual do Tocantins, 2013.
Available from: <http://isssbrasil.usp.br/artigos/9cbs_20_.pdf>. Access on: 4 jan. 2018.
EVERITT, B. S.; LANDAU, S.; LEESE, M.; STAHL, D. Hierárquica analysis. 5th ed. Boca Raton: Wiley, 2011. 321 p.
FERREIRA, A. B.; SANTOS, J. O.; SOUZA, S. O.; JÚNIOR, W. N. S.; ALVES, J. P. H. Use of passive biomonitoring to evaluate the environmental impact of emissions from cement industries in Sergipe State, northeast Brazil. Microchemical Journal, v. 103, p. 15-20, 2012. http://dx.doi.org/10.1016/j.microc.2011.12.008.
GUPTA, R. K.; MAJUMDAR, D.; TRIVEDI, J. V.; BHANARKAR, A. D. Particulate matter and elemental emissions from a cement kiln. Fuel Processing Technology, v. 104, p. 343-351, 2012. http:// dx.doi.org/10.1016/j.fuproc.2012.06.007.
HAMMER, O.; HARPER, D. A. T.; RYAN, P. D. Paleontological statistic. Oslo: University of Oslo, 2001. Available from: <http:// folk.uio.no/ohammer/past>. Access on: 10 jan. 2017.
HORA, F. M. D. Caracterização do agroecossistema da micro-bacia do
HOROWITZ, A. J. A review of selected inorganic surface water quality-monitoring practices: are we really measuring what we think, and if so, are we doing it right? Environmental Science & Technology, v. 47, n. 6, p. 2471-2486, 2013. http://dx.doi.org/10.1021/ es304058q. PMid:23406404.
IBGE – INSTITUTO BRASILEIRO DE GEOGRAFIA E ESTATÍSTICA. Censo 2010. Rio de Janeiro: IBGE, 2010. Available from: <http://censo2010.ibge.gov.br>. Access on: 1 aug. 2017.
KHALIL, B.; OUARDA, T. B. M. J. Statistical approaches used to assess and redesign surface water-quality-monitoring networks.
Journal of Environmental Monitoring, v. 11, n. 11, p. 1915-1929, 2009. http://dx.doi.org/10.1039/b909521g. PMid:19890548.
MAVUKKANDY, M. O.; KARMAKAR, S.; HARIKUMAR, P. S. Assessment and rationalization of water quality monitoring network: a multivariate statistical approach to the Kabbini River (India). Environmental Science and Pollution Research International, v. 21, n. 17, p. 10045-10066, 2014. http://dx.doi.org/10.1007/ s11356-014-3000-y. PMid:24865500.
OUYANG, Y. Evaluation of river water quality monitoring stations by principal component analysis. Water Research, v. 39, n. 12, p. 2621-2635, 2005. http://dx.doi.org/10.1016/j.watres.2005.04.024. PMid:15993926.
OUYANG, Y.; NKEDI-KIZZA, P.; WU, Q. T.; SHINDE, D.; HUANG, C. H. Assessment of seasonal variations in surface water quality. Water Research, v. 40, n. 20, p. 3800-3810, 2006. http://dx.doi.org/10.1016/j.watres.2006.08.030. PMid:17069873.
PHUNG, D.; HUANG, C.; RUTHERFORD, S.; DWIRAHMADI, F.; CHU, C.; WANG, X.; NGUYEN, M.; NGUYEN, N. H.; DO, C. M.; NGUYEN, T. H.; DINH, T. A. D. Temporal and spatial assessment of river surface water quality using multivariate statistical techniques: a study in Can Tho City, a Mekong Delta area, Vietnam. Environmental Monitoring and Assessment, v. 187, n. 5, p. 229, 2015. http://dx.doi.org/10.1007/s10661-015-4474-x. PMid:25847419.
RAZMKHAH, H.; ABRISHAMCHI, A.; TORKIAN, A. Evaluation of spatial and temporal variation in water quality by pattern recognition techniques: a case study on Jajrood River (Tehran, Iran). Journal of Environmental Management, v. 91, n. 4, p. 852-860, 2010. http://dx.doi.org/10.1016/j.jenvman.2009.11.001. PMid:20056527.
SANDERS, T. G.; WARD, R. C.; LOFTIS, J. C.; STEELE, T. D.; ADRIAN, D. D.; YEVJEVICH, V. Design of networks for monitoring water quality. Littleton: Water Resources Publications, 1983. 328 p
SANTOS, W. A. Ocupação e dinâmica socioambiental da sub-bacia
hidrográfica do rio Jacarecica/SE. 2012. 160 f. Dissertação (Mestrado em Desenvolvimento e Meio Ambiente) - Universidade Federal de Sergipe, São Cristóvão, 2012. Available from: <https://ri.ufs. br/bitstream/riufs/4195/1/WESLEY_ALVES_SANTOS.pdf>. Access on: 3 jan. 2018.
SEMARH – SECRETARIA DE ESTADO DO MEIO AMBIENTE E DOS RECURSOS HÍDRICOS DE SERGIPE. As bacias hidrográficas
em Sergipe. Aracaju: SEMARH, 2017. Available from: <http://
sirhse.semarh.se.gov.br/sirhse/index.php/macroplanejamento/ bacias_hidrograficas/hidrograficas>. Access on: 10 mar. 2017.
SHRESTHA, S.; KAZAMA, F. Assessment of surface water quality using multivariate statistical techniques: a case study of the Fuji river basin, Japan. Environmental Modelling & Software, v. 22, n. 4, p. 464-475, 2007. http://dx.doi.org/10.1016/j.envsoft.2006.02.001.
SINGH, K. P.; MALIK, A.; MOHAN, D.; SINHA, S. Multivariate statistical techniques for the evaluation of spatial and temporal variations in water quality of Gomti River (India): a case study. Water Research, v. 38, n. 18, p. 3980-3992, 2004. http://dx.doi. org/10.1016/j.watres.2004.06.011. PMid:15380988.
SOUZA, R. G.; MACÊDO, A. P. B. A.; XAVIER, C. A. Proposta
de monitoramento da qualidade da água para o Estado de Sergipe. Porto Alegre: ABRH, 2007. Available from: <https://www.abrh.org. br/SGCv3/index.php?BUSCA=ARTIGOS&iPUB=3&Q=Prop osta%20de%20Monitoramento%20da%20Qualidade%20da%20 %C3%81gua%20par>. Access on: 10 mar. 2017.
STROBL, R. O.; ROBILLARD, P. D. Network design for water quality monitoring of surface freshwaters: a review. Journal of
Environmental Management, v. 87, n. 4, p. 639-648, 2008. http:// dx.doi.org/10.1016/j.jenvman.2007.03.001. PMid:17459570.
TANOS, P.; KOVÁCS, J.; KOVÁCS, S.; ANDA, A.; HATVANI, I. G. Optimization of the monitoring network on the River Tisza (Central Europe, Hungary) using combined cluster and discriminant analysis, taking seasonality into account. Environmental Monitoring and
Assessment, v. 187, n. 9, p. 575, 2015. http://dx.doi.org/10.1007/ s10661-015-4777-y. PMid:26282008.
TIMMERMAN, J. G.; BEINAT, E.; TERMEER, K.; COFINO, W. Analyzing the data-rich-but-information-poor syndromein dutch water management in historical perspective. Environmental
Management, v. 45, n. 5, p. 1231-1242, 2010. http://dx.doi.
org/10.1007/s00267-010-9459-5. PMid:20221829.
UNEP – UNITED NATIONS ENVIRONMENT PROGRAMME. The UN-water status report on the application of integrated approaches to
water resources management. Nairobi: UNEP, 2012.
VAREKAR, V.; KARMAKAR, S.; JHA, R. Seasonal rationalization of river water quality sampling locations: a comparative study of the modified Sanders and multivariate statistical approaches.
Environmental Science and Pollution Research International, v. 23, n. 3, p. 2308-2328, 2016. http://dx.doi.org/10.1007/s11356-015-5349-y. PMid:26408122.
VAREKAR, V.; KARMAKAR, S.; JHA, R.; GHOSH, N. C. Design of sampling locations for river water quality monitoring considering seasonal variation of point and diffuse pollution loads.
VAROL, M.; GÖKOT, B.; BEKLEYEN, A.; ŞEN, B. Spatial and temporal variations in surface water quality of the dam reservoirs in the Tigris River basin, Turkey. Catena, v. 92, p. 11-21, 2012. http://dx.doi.org/10.1016/j.catena.2011.11.013.
VILLAS-BOAS, M. D.; OLIVERA, F.; AZEVEDO, J. P. S. Assessment of the water quality monitoring network of the Piabanha River experimental watersheds in Rio de Janeiro, Brazil, using autoassociative neural networks. Environmental Monitoring and
Assessment, v. 189, n. 9, p. 439-453, 2017. http://dx.doi.org/10.1007/ s10661-017-6134-9. PMid:28785884.
WANG, X.; CAI, Q.; YE, L.; QU, X. Evaluation of spatial and temporal variation in stream water quality by multivariate statistical techniques: a case study of the Xiangxi River basin, China. Quaternary International, v. 282, p. 137-144, 2012. http://dx.doi. org/10.1016/j.quaint.2012.05.015.
WANG, Y.; LIU, C.; LIAO, P.; LEE, J. Spatial pattern assessment of river water quality: implications of reducing the number of monitoring stations and chemical parameters. Environmental
Monitoring and Assessment, v. 186, n. 3, p. 1781-1792, 2014. http:// dx.doi.org/10.1007/s10661-013-3492-9. PMid:24242081.
WARD, R.; LOFTIS, J.; MCBRIDE, G. The “data-rich but information-poor” syndrome in water quality monitoring.
Environmental Management, v. 10, n. 3, p. 291-297, 1986. http:// dx.doi.org/10.1007/BF01867251.
ZHAO, J.; FU, G.; LEI, K.; LI, Y. Multivariate analysis of surface water quality in the three Gorges area of China and implications for water management. Journal of Environmental Sciences, v. 23, n. 9, p. 1460-1471, 2011. http://dx.doi.org/10.1016/S1001-0742(10)60599-2. PMid:22432281.
Authors contributions
José do Patrocinio Hora Alves: Contributed to data analysis, statistical processing of data, interpretation of results and writing of the article.
Lucas Cruz Fonseca: Contributed to fieldwork for sample collection and field analyses.
Raisa de Siqueira Alves Chielle: Contributed in elaboration of maps and statistical processing of data.