COMPARISON OF DIFFERENT FUSION ALGORITHMS IN
URBAN AND AGRICULTURAL AREAS USING SAR
(PALSAR AND RADARSAT) AND OPTICAL (SPOT) IMAGES
Verificação de algoritimos de fusão de imagens de radar e ópticas em áreas urbanas e rurais.
SAYGIN ABDIKAN FUSUN BALIK SANLI
Yildiz Technical University
Faculty of Civil Engineering Department of Geomatic Engineering Davutpasa Campus TR-34220 Esenler-Istanbul – Turkey
E-mail: (sabdikan, fbalik)@yildiz.edu.tr
ABSTRACT
of the other methods. HPF performs almost best in agricultural areas for both SAR images.
Keywords: Fusion; PALSAR; RADARSAT-1; SPOT; Statistical Analysis.
RESUMO
As técnicas de fusão de dados de sensoriamento remoto são estruturas formais para combinar e utilizar utilizar imagens originadas de diferentes fontes. Esta pesquisa investiga o critério de qualidade do SAR – Synthetic Aperture Radar – na fusão de dados com imagens óticas. Dois diferentes conjuntos de dados SAR originados de diferentes sensores chamados de RADARSAT-I e PALSAR – foram “fundidos “ com dados SPOT-2. Ambos os dados de SAR têm a mesma resolução e polarização; no entanto, imagens foram agrupadas em diferentes freqüências tais como banda C e banda L, respectivamente. Esta pesquisa contribui para a avaliação comparativa de dados fundidos para o entendimento do desempenho do algoritmos de fusão de imagens implementadas tais como Ehlers, IHS ( Intensidade-do Matiz-de Saturação), HPF (Passagem de Alta Freqüência) , bidimensionais DWT ( Transformação Discreta de Ondaletas) e técnicas PCA (Análise de Componentes Principais). As avaliações de qualidade das imagens fundidas foram feitas qualitativamente e quantitativamente. Para a análise estatística; tendência, o Coeficiente de Correlação (CC), Diferença de Variância (DIV), Diferença do Desvio Padrão (SDD e, o Indice Universal de Qualidade da Imagem (UIQI) foram aplicados nas imagens fundidas. As avaliações foram feitas para categorizar a área experimental em duas tais como “urbana “ e “ agricula”. Tem sido observado que alguns dos métodos têm realçado a qualidade espacial ou preservado a qualidade espectral da imagem original SPOT XS em vários graus , enquanto que em outras abordagens foram notou-se aintrodução de distorções. Em geral , percebemos que a qualidade espectral Ehler é muito melhor do que as dos outros métodos. HPF tem melhor desempenho para as áreas de agricultura para ambas as imagens SAR. Palavras-chave: Fusão; PALSAR; RADARSAT-1; SPOT; Análises Estatísticas.
1. INTRODUCTION
multispectral image with the first type of fusion processes, it is to detect the changes over a period of time with the latter one (ZENG et al., 2010). In the literature, terms such as merging, combination, synergy, integration, and several others that express more or less the same concept have been used related to fusion (HELMY et al., 2010). However the following definition, which explains clearly data fusion framework, has been adopted in remote sensing community: “Data fusion is a formal framework in which are expressed means and tools for the alliance of data originating from different sources. It aims at obtaining information of greater quality; the exact definition of ‘greater quality’ will depend upon the application” (WALD, 1999).
Image fusion technique can be done with several algorithms and integration of multi source data is of the essence for many applications (EHLERS, 1991; WANG et al., 2005; ZENG et al. 2010; HELMY et al., 2010).
In recent years, the launches of new SAR satellites such as ENVISAT, ALOS, TERRASAR and RADARSAT-2 have opened a new era for remote sensing applications. Previous studies proved that the combination of optical and SAR data provide more accurate identification when compared to the results obtained with the individual sensors (ASCHBACHER & LICHTENEGGER, 1990). Due to the fact that the geometry and structure of the earth surface are more effective in microwave backscatter than in the surface reflection occurring in optical images (POHL & GENDEREN, 1998), using these multiple types of sensors for image fusion increases the quality of images. However fusion of microwave data and optical data is still a challenge. There are many image fusion methods that can be used to produce high-resolution multispectral images from microwave data and multispectral images. In this paper, the terms ‘microwave data’ and ‘multispectral data’ are representing synthetic aperture radar (SAR) and optical data respectively. At present, IHS (LI and WANG, 2001; TSAI, 2004), Brovey Transformation (BINH et al., 2006), PCA (AMARSAIKHAN & DOUGLAS, 2004), HPF (BETHUNE et al., 1998; AIAZZI et al., 2006a), DWT (ZHANG & HONG 2005; JIN et al., 2006), Gram Schmidt Transformation (AIAZZI et al., 2006b), Smoothing Filter Based Intensity Modulation (LIU, 2000), Synthetic Variable Ratio (ZHANG, 1999) are among the pixel based image fusion algorithms generally used. In the literature, there are several studies comparing these techniques analyzed by Zhou et al. (1998), Zhang and Hong (2005), Colditz et al. (2006), Teggi et al. (2003), Shi et al. (2005), Wang and Bovik (2002). Fusion methods are used for gathering information from SAR and Optical data for various purposes such as qualifying the fused images (ROKHMATULOH et al., 2003; SHI et al., 2005) for enhancement of the geological information gathered (Pal et al., 2007), and assessing the contribution of fusion techniques to rural and urban land use classification (AMARSAIKHAN et
al., 2012; KURUCU et al., 2009; KUPLICH et al., 2000; SUN et al., 2003).
images, where they combined X band SAR data with optical data. Palubinskas et al. (2010) proposed a fusion approach for very high-resolution optical and radar satellite imagery.
This article extends the previous work of Abdikan et al. 2008 as outlined in the following lines. Here image fusion results of HH polarized L-band PALSAR, and HH polarized C-band RADARSAT-1 image with three band SPOT-2 XS image are presented. Note that both radar data used in this study have same polarisation with the same resolution but have different frequencies for the same area. Particularly in SAR images the operating frequency is an important factor in the penetration depth affecting the backscatter value. Thus it is also investigated visually how different SAR features are preserved in the fused images as well as making the quality assessments of the resulting images visually and statistically. In addition to IHS, PCA, HPF, DCW techniques used previously, in this study Ehlers’ method was also included in the comparisons as the first extension (i.e. here the results of five fusion methods were compared). The quality assessment analyses were applied to resulting multi sensor data. To evaluate the used fusion methods, all fused results were compared visually and statistically to SPOT-XS as the reference image. Secondly, the test area is separated into two as “urban” and “agricultural” for getting more precise results related to the homogenous areas under consideration. Finally, among the quality indices Bias, CC, DIV, SDD and UIQI statistical analyses were derived from the fused images for the image comparison. In forming the biases and SDDs, differing from Abdikan et al. 2008, we preferred simply taking the differences instead of applying normalizations. The fused images were also downsampled to the spatial resolution of the reference image (i.e SPOT XS) (see section 3.1).
2. STUDY AREA
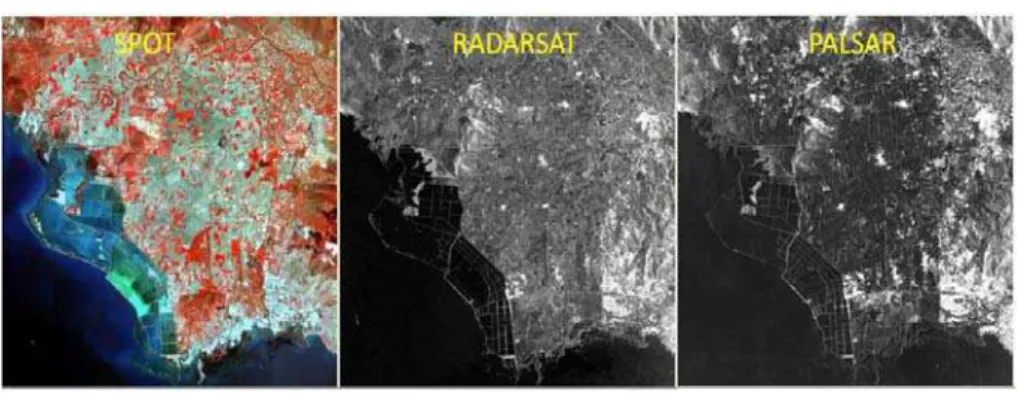
This study has been performed on a test site located in the Menemen (Izmir) Plain to the west of Gediz Basin in the Aegean Region of Turkey. The Aegean Sea lies in the west of the study area, and Manisa Province lies in the North (Figure 1). The study area covers about 400 square km including both residential and agricultural areas. Due to the fact that texture and slope are important characteristics for SAR backscattering, the area has been selected with a micro relief where the slope was in general 1% (i.e. flat). In the SAR images, the surface roughness affects geometry and backscatter values. Depending on the SAR acquisition orbits (ascending or descending) SAR data has distortions such as shadow, layover and foreshortening. Especially in shadow areas there is no backscatter values related to earth surface. To avoid the distortions caused by the relief, an area with micro relief is preferred like in many SAR applications.
crops such as wheat and pasture. The soil in the area was compacted to prevent moisture loss. The surface roughness of the study area is homogeneous. In this season, since the area had not received enough rain until the beginning of May, the soil moisture levels varied usually according to its water holding capacity. Hence most of the colour difference appears due to the planted and unplanted fields with different moisture content in the area. The view of the study area is derived from a false colour composite of SPOT-2 bands (NIR-Red-Green as RGB composite) in Figure 1. Here red, green and reddish black colours imply land cover of wheat and pasture, ploughed soil surfaces with different moisture contents, and swampy areas with nature plantation respectively. On the other hand the colour changes were less severe in the urban areas than agricultural fields. However urban areas were chosen as the other test areas to investigate the spatial improvement.
Figure - Memenen plain.
3. DATA SETS AND METHODOLOGY
Present paper contributes to the comparative evaluation of fused data for understanding the performance of the implemented image fusion algorithms for SAR and Optical data. Quality assessments of fused images were performed both qualitatively and quantitatively. For the statistical analysis bias, CC, DIV, SDD, UIQI methods were applied on the fused images. Two different test areas were defined to make the quality assessments as urban and agricultural areas. Each of the selected areas covers 11 km2 approximately. It has been observed that some of the
methods have enhanced either spatial quality or preserved spectral quality of the original SPOT XS image to various degrees while some approaches have introduced distortions. We will discuss these in detail in the upcoming sections.
3. 1 Data and Pre-processing
both images were fused with SPOT-2 data (Figure 2). Although the PALSAR and the RADARSAT-1 images have the same resolutions (6.25 m x 6.25 m) and same polarisations, the images were gathered in different frequencies as L-band and C-band respectively. To avoid the effects of opposite passes, both SAR images were chosen in ascending orbits. A SPOT HRV-2 XS MS imagery having three spectral bands with a 20 m resolution were used as the optical data. A fine beam single polarized (FBS) mode of PALSAR (Phased Array type L-band Synthetic Aperture Radar) data of ALOS satellite (Advanced Land Observing Satellite) imagery and a Fine Beam 1 mode of RADARSAT-1 imagery were used as SAR data having observation capability of high spatial resolution (Table 1).
Figure 2 - Data used.
Before the image fusion process SAR images were pre-processed by the commonly used speckle reducing filter techniques. For the filtering of SAR images, among the different sized kernel windows, Gamma filtering of 3x3 kernel size was chosen to suppress the speckle noise.
Table - Data information.
RADARSAT-1 PALSAR SPOT-2
Date 28/05/2006 10/06/2006 14 /05/2006 Sensor SAR Fine 1 PALSAR/FBS HRV/HRG Pixel Spacing 6.25 m. 6.25 m. 20m
Orbit 55139 2010
Flight direction Ascending Ascending Polarization H/H H/H
Swath 50 km 80 km 60 km
In this study image fusion was conducted at the pixel level. In order to avoid the combination of unrelated data, spatial registration accuracies should be at the sub pixel level. Particularly in SAR data terrain distortions are mainly the causes of the combination of unrelated pixels during the fusion processes. To remove the possible terrain distortions (see Section 2), it is essential to register images perfectly. These geometric distortions are different from optical distortions, and they may be severe in rough topographic areas. If the creation of co-registered datasets is not accurate, the quality of the fused image will decrease significantly. Therefore in fusion applications geometric correction is very important for the registration of the images. Thus SAR images were registered to the SPOT image by using image to image rectification method with a root mean square error of less than 1 pixel, and registered SAR images were resampled to 8 m (see ERSDAC - Palsar User Guide, 2006). Cadastral maps on a scale of 1/5000 and topographic maps on a scale of 1/25000 were used for the rectification of SPOT images with a first degree polynomial function using the nearest neighbour resampling technique.
3.2 Image Fusion
In this study, among the presently used pixel based image fusion algorithm, five different fusion algorithms, namely High Pass Filter (HPF), Principle Component Analysis (PCA), Intensity Hue and Saturation (IHS), Discrete Wavelet Transformation (DWT) and Ehlers, have been examined. Both SAR (RADARSAT-1 and PALSAR) images were fused with the 3 bands of a multispectral SPOT-2 image resulting in a data set of 10 fused images. Resulting fused images were resampled to the higher resolution of SAR images as 8m x 8m. Short explanations of the approaches used for fusion are given below:
Highpass Filtering uses a band addition approach to fuse both spectral and spatial information of the images. For this purpose, a high resolution image is filtered with a high pass filter to compute the high frequency component. High frequency component, which is concerned to spatial information, is added pixel by pixel basis to each low resolution multispectral images (WANG et al., 2005). In conclusion, by adding a filter to a low resolution band, spatial information content of the high resolution image is replaced and seen in the fused image (BETHUNE et al., 1998).
Intensity Hue Saturation method transforms a low resolution 3-band image as red (R), green (G), blue (B) to intensity (I), hue (H), and (S) saturation components where I refers to the total brightness of the image, H to the dominant or average wavelength of the light contributing to the colour, and S to the purity of the colour (EHLERS et al., 2010). Next the intensity component, which is the spatial information of the image, is replaced with a high resolution image to enhance the spatial resolution. After a reverse transformation from IHS to RGB, a high spatial resolution multispectral image is produced. The disadvantage of IHS is that, it can only process three bands of a multispectral image. For more than 3 bands the IHS transform has to be used more than once depending on the number of bands to be fused (EHLERS, 1991; POHL & GENDEREN, 1998).
In Discrete Wavelet Transformation, a high resolution image is separated in to its low and high frequency components. The aim is to select the base of a waveform to be used. Once the basis waveform is mathematically defined, a family of multiples can be created with increasing frequency as retaining the high-pass images for later image reconstruction. In practice, three or four recursions are sufficient (i.e. the related wavelets of twice the frequency, three times the frequency, four times the frequency, etc. can be created). Here the high resolution image is decomposed to its low and high frequencies. Multi spectral image is replaced with the low pass image which has same resolution. As a last step wavelet decomposition process is reversed to keep the original high resolution level with the spectral information (ERDAS USER GUIDE v9, 2005; SHI et al., 2005).
In Ehlers Fusion, first three low resolution multispectral band images are
transformed to an IHS image. Later a two dimensional Fast Fourier Transformation (FFT) is used to transform the intensity (I) component of the image and a high resolution image into the frequency domain. Than a low pass filter is applied on the intensity spectrum, and for the spectrum of high resolution image an inverse high pass filter is used. An inverse FFT is performed on these filtered images, and a new fused intensity image component is formed by adding these filtered images together. New intensity is composed with the high and low frequency information that are extracted from high and low resolution images respectively. This algorithm was developed specifically for a spectral characteristics preserving image fusion (EHLERS, 2004; EHLERS, 2006; EHLERS et al., 2010).
3.3 Quality Assessment
precisely (EHLERS et al., 2010; EHLERS, 2004; KLONUS & EHLERS, 2007; KLONUS, 2008). In general, reference MS images at higher spatial resolution with the same spectral intervals of input MS images are not available for assessing the quality of the fused images. The lack of availability of these reference images makes quality assessment particularly difficult (WALD et.al.1997). The only available reference images are the original MS images at the “low” spatial resolution. To overcome this problem there are two ways. It is either degrading the fused image back to the original image resolution prior to assessment or degradation of both pan and multispectral imagery by the same factor prior to fusion. In this way a number of statistical criteria can be calculated to verify the accuracy of fused images.
In our application, the factors computed to qualify the fused images are bias (BETHUNE et al., 1998; TAHA et. al., 2010), DIV (CAKIR et.al., 2008), SDD (CAKIR et al., 2008; TAHA et. al., 2010), CC (SHI et al., 2005) and UIQI (WANG & BOVIK, 2002; WALD, 2002). As a result fused images were visually and statistically evaluated for colour preservation, spatial enhancement and for spectral fidelity respectively. Assessment analyses for each of the PALSAR-SPOT and RADARSAT-SPOT fused images were determined. To evaluate the preserved spectral quality of the each image fusion techniques used, the original SPOT XS image was compared with 10 resulting fused images in terms of information improvement and fidelity of spectral characteristics. The comparison was performed by statistical and graphical interpretation (Table 2, Table 3, and Figure 5, Figure 6). Prior to the statistical comparisons, the fused images were downsampled to the spatial resolution of the reference image (i.e SPOT XS). Visual evaluations (Figure 3, Figure 4) and statistical analysis were performed considering the local characteristics as urban and agricultural areas rather than performing globally on the entire image scenes of the fused data. For the graphical analyses, a transect (Figure 7) was defined on the same section of the images including urban and agricultural areas (Figure 8 and Figure 9).
4. RESULTS AND DISCUSSIONS
4.1 Qualitative Visual Comparisons
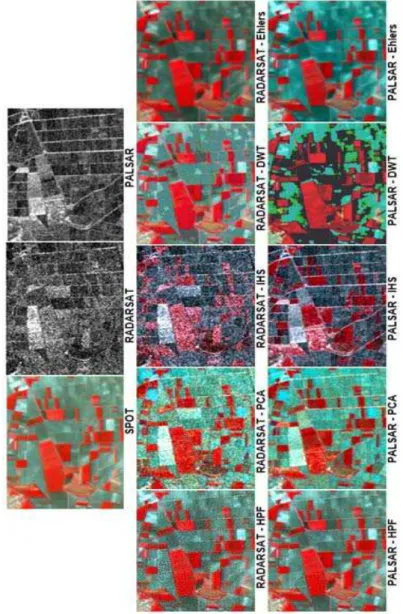
given in this order. Especially in urban areas, among the five methods HPF shows features more detailed than PCA. DWT follows them in the third order. Although IHS shows borders clearly especially with PALSAR fused images in agricultural areas, it has the worst colour quality in both PALSAR and RADARSAT fused images. It produces significant colour distortion with respect to the original SPOT XS image, and among all it is the worse in preserving colours. Meanwhile, as seen from the output images, Ehlers method keeps spectral consistency better than other methods. Particularly the colours of the resulting Ehlers images of agricultural and urban areas are almost the same as that of the original SPOT XS image. Besides, DWT method follows Ehlers method as being close to the original SPOT XS image on RADARSAT fusion result. But it produces a noticeable colour distortion in agricultural areas especially for the PALSAR results. From the comparison of the spatial effects it can be seen that the results of the five methods using SAR images contribute to the SPOT XS image in agricultural areas. However in urban areas, which include smaller objects, only HPF and PCA contribute to the results. For both urban and rural test sides; IHS method shows border lines and roads much sharper in agricultural areas whereas it is the worse in residential areas with its noisy texture. IHS method performs better with PALSAR images.
Figure 4 - Comparison of the spectral and spatial effects of the fused SAR-SPOT results for agricultural fields.
4.2 Statistical Inspections
Figure 5 - Statistical graphics of CC and UIQI of fusion methods for urban areas.
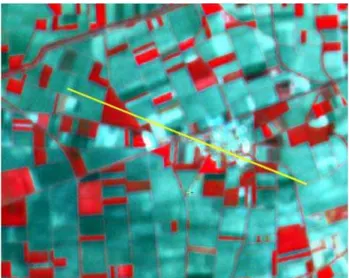
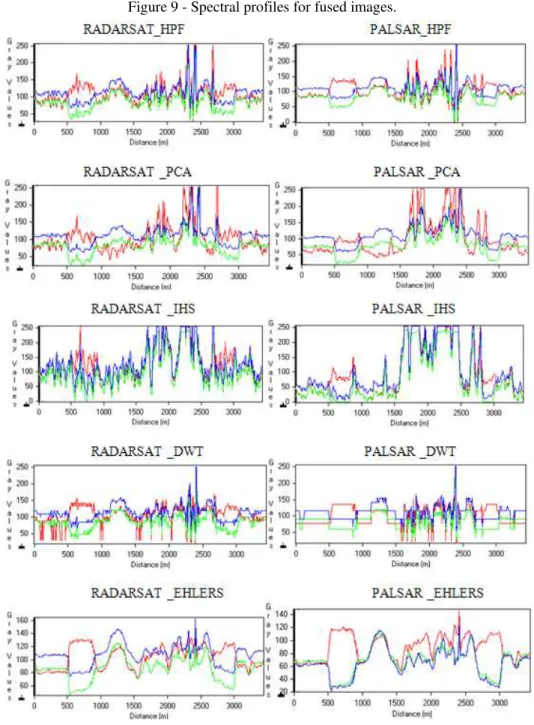
We performed an additional spectral analysis for a test site including both agricultural and residential areas using a transect (Figure 7). We compare the spectral profile for SPOT XS in Figure 8 with the spectral profiles of the fused images from different methods in Figure 9. The upper 3 plots of Figure 9 indicate that the correlation of the spectral profiles from HPF, PCA, and IHS with the SPOT image is disturbed in the urban area falling into the ranges of 1500 m and 2500 m. This is relatively better for DWT through which only a little section is disturbed at some 2400 meters. The best method that produces spectral correlations is the Ehlers method. Note that all the original gray values between 60 and 160 are preserved.
Figure 7 - Transect on SPOT XS.
5. CONCLUSIONS
In this article, the results from the five different fusion methods as HPF, IHS, PCA, DWT, and Ehlers were compared visually and statistically, and the results are interpreted. For this purpose, an optical image (SPOT-2) and two pairs of high resolution SAR images (RADARSAT-1 and PALSAR) have been acquired over a flat area including both rural and urban areas-Menemen Plane in Turkey. In order to see the impacts of different penetrations, SAR images were chosen with the same polarisation but with the different bands as C-band and L-band respectively. Quality assessment was performed to select the best merged images, and the comparisons were made between the SAR components of the fusion process. As well as the visual comparisons, five different statistics were applied to evaluate the resulting ten fused images.
Our first major conclusion for this study is that separating the study area as urban and agriculture revealed a fact that HPF method relatively does not perform well in urban areas. Secondly, Ehlers’ method performs best among all other methods as far as qualitative analysis is concerned. Quantitative analysis also supports this result (i.e UIQI and CC assessments indicate large correlation values). Third, although the linear features became visible in the merged images of IHS, the statistical results were the poorest for this method. In addition, colour and brightness were distorted in IHS fused images.
Considering the colours of the merged images, Ehlers’ fused images are almost the same as those of the original SPOT XS image. Ehlers method shows the most coherent colours which can be useful to perform visual analysis for land use/cover. Statistical and graphical results of Ehlers method also confirmed those visual results. Considering all indicators together for the fusion results of RADARSAT-SPOT and PALSAR-RADARSAT-SPOT images, quantitative analysis illustrates that the Ehlers’ fusion method performs satisfactorily in preserving spectral fidelity. Qualitative analysis show that, the HPF approach performs satisfactorily in enhancing spatial information for multi-sensor remote sensing images. As a result, with the rapid fusion of optical and radar data, specific imaging may become advantageous for monitoring the earth for different purposes using Ehlers and HPF image fusion techniques.
From our overall evaluations, especially based on the statistical comparisons, we provide the following conclusions for our study area:
As far as the use of RADARSAT images for urban areas is concerned Ehlers’ method can be preferred over all other 4 methods. Only the biases are slightly worse compared to the HPF and DWT methods however in other statistical measures Ehlers’ is superior.
lower DWT correlation values compared to Ehlers solutions would not degrade the homogeneity of the statistical results from different categories.
The user can confidently prefer HPF for agricultural areas for both RADARSAT and PALSAR images over all other methods. Only the CC and UIQI values are slightly lower than the Ehlers ones however HPF is superior in all other indicators.
ACKNOWLEDGEMENTS
The authors thank to the three anonymous reviewers for their useful comments. They were very helpful to improve the article.
REFERENCES
ABDIKAN, S.; BALIK SANLI, F; BEKTAS BALCIK F.; GOKSEL C. Fusion of sar images (PALSAR and RADARSAT-1) with multispectral spot image: a comparative analysis of resulting images. In: The International Archives of the Photogrammetry Remote Sensing and Spatial Information Sciences (2008). 37(B7) 1197-1202 Publisher: Citeseer.
AIAZZI, B.; BARONTI, S.; ALPARONE, L.; GARZELLI, A.; NENCINI , F. Information-Theoretic assessment of fusion of multispectral and panchromatic images. In: Proceedings ofIEEE 9th International Conference on Information Fusion (Fusion 2006). 10-13 Jul. 2006, Florence-Italy, pp1-5, 2006a.
AIAZZI, B.; BARONTI, S.; SELVA, M.; ALPARONE, L. Enhanced Gram-Schmidt Spectral Sharpening based on Multivariate Regression of MS and Pan data. In: Proceedings of IEEE International Conference on Geoscience and Remote Sensing Symposium (IGARSS 2006), Denver , CO-USA, July 31-Aug. 4 2006, pp. 3806–3809. doi: 10.1109/IGARSS.2006.975, 2006b.
AMARSAIKHAN, D.; SAANDAR, M.; GANZORIG, M.; BLOTEVOGEL, H.H.; EGSHIGLEN, E.; GANTUYAL, R.; NERGUI, B.; ENKHJARGAL, D. Comparison of multisource image fusion methods and land cover classification. International Journal of Remote Sensing, 33(8), 2532-2550, 2012.
AMARSAIKHAN, D.; DOUGLAS, T. Data fusion and multisource image classification. International Journal of Remote Sensing, 25(17), 3529-3539, 2004.
ASCHBACHER, J.; LICHTENEGGER, J. Complementary nature of SAR and optical data: a case study in the Tropics. Earth Observation Quarterly, 31, 4-8, 1990.
BINH, D.T.; CHRISTINE, W.; AZIZ, S.; DOMINIQUE, B.; VANCU, P. Data fusion and texture-direction analyses for urban studies in Vietnam. In:
Proceedings of EARSeL 1st Workshop on Urban Remote Sensing (SIG-URS 2006), Berlin-Germany, 2-3 March 2006, pp1-7, 2006.
CAKIR, H.I., KHORRAM, S., 2008. Pixel Level Fusion of Panchromatic and Multispectral Images Based on Correspondence Analysis. Photogrammetric Engineering & Remote Sensing, 74, 2, 183-192.
COLDITZ, R.; WEHRMANN, T; BACHMANN, M; STEINNOCHER, K; SCHMIDT, M; STRUNZ, G; DECH S. Influence of image fusion approaches on classification accuracy: a case study. International Journal of Remote Sensing, 27 (15), 3311–3335, 2006.
EHLERS, M. Multisensor image fusion techniques in remote sensing. ISPRS Journal of Photogrammetry and Remote Sensing, 46 (1), 19–30, 1991.
EHLERS, M. Spectral characteristics preserving image fusion based on Fourier domain filtering. In: Proceedings of SPIE , Conference on Remote Sensing for Environmental Monitoring, GIS Applications, and Geology IV. Remote Sensing Europe 2004, 13 September 2004, Maspalomas, Gran Canaria- Spain, 13 September 2004, 5574, pp 1–13. doi:10.1117/12.565160, 2004.
EHLERS, M. 2006. New developments and trends for urban remote sensing. In: WENG, Q.; QUATTROCHI, D. (Eds.). Urban Remote Sensing. Florida. CRC Press, pp. 357-376.
EHLERS, M.; KLONUS, S.; ASTRAND, P.J; ROSSO, P. Multi-sensor image fusion for pansharpening in remote sensing. International Journal for Image and Data Fusion, (1), 25–45, 2010.
ERDAS Imagine 9.1 Field Guide. Leica Geosystems Geospatial Imaging, LLC. pp 166-168, 2005.
ERSDAC PALSAR User Guide, 3rd Edition. Earth Remote Sensing Data Analysis Center (ERSDAC), 2006. Available from: http://www.palsar.ersdac.or.jp/e/ guide/pdf/U_Guide_en.pdf [Accessed 8.11.2011].
GENDEREN, J. L. VAN; POHL, C. Image Fusion: Issues techniques and Applications: a selected bibliography on image fusion. In: GENDEREN, J.L.VAN.; CAPELLINI, V. (Eds.). Proceedings EARSeL Workshop, Strasburg, France,11 September , pp 18-26, 1994.
HALL, D. L. Mathematical techniques in multisensory data fusion. Arteech House Inc. Norwood, 1992.
HELMY, A. K.; NASR, A. H.; EL-TAWEEL, G.H.S. Assessment and Evaluation of Different Data Fusion Techniques. International Journal of Computers 4(4), 107-115, 2010.
JAIN, A. Fundamentals of Digital Image Processing, Prentice Hall, Upper Saddle River, NJ, 1988.
KLONUS, S. Comparison of pansharpening algorithms for combining radar and multispectral data. In: Proceedings of XXI. ISPRS Congress , The International Archives of the Photogrammetry, Remote Sensing and Spatial Information Sciences (ISPRS 2008) , Beijing –China, 3-11 Jul 2008, XXXVII (B6b), pp189–194, 2008.
KLONUS, S.; EHLERS, M. Image fusion using the Ehlers spectral characteristics preserving algorithm. GIScience and Remote Sensing 44(2), 93–116, 2007. KUNTZ, S.; SIEGERT, F.; RÜCKER, G. (1999). ERS SAR Images for Tropical
Rainforest and Land Use Monitoring: Chane Detection Over Five Years and Comparison with RADARSAT and JERS SAR images. In: IGARSS '99 Proceedings Geoscience and Remote Sensing Symposium.IEEE 1999 International, 2, 910-912, 1999.
KURUCU, Y.; BALIK-SANLI, F.; ESETLILI, M.T.; BOLCA, M.; GOKSEL, C. Contribution of SAR images to determination of surface moisture on the Menemen Plain, Turkey. International Journal of Remote Sensing, 30, 1805-1817, 2009.
KUPLICH, T.M.; FREITAS, C.C.; SOARES, J.V. The study of ERS-1 SAR and Landsat TM synergism for land use classification. International Journal of Remote Sensing, 21, 2101–2111, 2000,
LI, S.; WANG, Y. Discrete multiwavelet transform method to fusing Landsat-7 panchromatic image and multi-spectral images. In: Proceedings of IEEE 2001 Geoscience and Remote Sensing Symposium (IGARSS '01), Sydney, NSW, 9-13 July 2001, 4, 1962–1964. doi: 10.1109/IGARSS.2001.9779-130, 2001. LIU, J. G. Smoothing Filter-based intensity modulation: a spectral preserve image
fusion technique for improving spatial details. International Journal of Remote Sensing, 21, 3461–3472, 2000.
PAL, S.K.; MAJUMDAR, T. J.; BHATTACHARYA, A. K. ERS-2 SAR and IRS-1C LISS III data fusion: A PCA approach to improve remote sensing based geological interpretation. ISPRS Journal of Photogrammetry & Remote Sensing 61 (5) 281–297, 2007.
PALUBINSKAS, G.; REINARTZ, P.; BAMLER, R. Image acquisition geometry analysis for the fusion of optical and radar remote sensing data. International Journal of Image and Data Fusion, 1(3), 271–282, 2010.
POHL, C.; GENDEREN, J.L. Van. Multisensor image fusion in remote sensing: concepts, methods and applications. International Journal of Remote Sensing,
19 (5), 823-854, 1998.
Toulouse, France, 21-25 July 2003, 6, 3656–3658. doi:10.1109/IGARSS.2003.1295228, 2003.
SHI, W.; ZHU, C. O.; TIAN, Y.; NICHOL, J. Wavelet-based image fusion and quality assessment. International Journal of Applied Earth Observation and Geoinformation, 6, 241–251, 2005.
SIMONE, G.; FARINA, A.; MORABITO, F. C.; SERPICO, S. B.; BRUZZONE, L. Image fusion techniques for remote sensing applications. Information Fusion
3(1), 3–15, 2003.
SUN, W.; HEIDT, V.; GONG, P.; XU, G. Information fusion for rural land-use classification with high resolution satellite imagery. IEEE Transactions on Geoscience and Remote Sensing, 41, 883–890, 2003.
TAHA, L.G.E.; ELBEIG, S.F.. Investigation of fusion of SAR and Landsat data for shoreline super resolution mapping: the northeastern Mediterranean Sea coast in Egypt. Applied Geomatics, 2, 177–186, 2010.
TEGGI, S.; CECCHI, R.; SERAFINI, F. TM and IRS-1C-PAN data fusion using multiresolution decomposition methods based on the 'a tròus' algorithm.
International Journal of Remote Sensing, 24 (6), 1287–1301, 2003.
TSAI, V.J.D. Evaluation of Multiresolution Image Fusion Algorithms. In:
Proceedings of IEEE 2004 Geoscience and Remote Sensing Symposium (IGARSS '04), Anchorage, AK, 20-24 Sept. 2004, doi: 10.1109/IGARSS.2004.1369104, 2004.
WALD, L.; RANCHIN, T.; MANGOLINI, M. Fusion of satellite images of different resolutions: Assessing the quality of resulting images,
Photogrammetric Engineering & Remote Sensing, 63(6), 691–699, 1997. WALD, L. Data Fusion: A Conceptual Approach for an efficient Exploitation of
Remote Sensing Images. In: RANCHIN, T.; WALD. L. (Eds.). In:
Proceedings of EARSeL Conference on Fusion of Earth Data, Sophia
Antipolis, France 28-30 January, pp pp. 17-23, 1998.
WALD, L. Definitions and terms of references in data fusion. In: Proceedings of joint EARSeL/ISPRS Workshop, International Archives of Photogrammetry and Remote Sensing, Valladolid-Spain, 323-4 June 1999, (part 7-4-3 W6), 2-6, 1999.
WALD, L. Data Fusion: Definitions and Architectures-Fusion of Images of different Spatial Resolutions. In: Les Presses de l'Ecole des Mines, Grou Radenez, Paris. ISBN:2-911762-38-X, 2002.
WANG, Z.; BOVIK A. C. A Universal Image Quality Index. IEEE Signal Processing Letters, 9 (3), pp. 81–84, 2002.
WANG, Z.; ZIOU, D.; ARMENAKIS C. A comparative analysis of image fusion methods. IEEE Trans. Geosci. Remote Sens. 43 (6), 1391–1402, 2005.
ZHANG Y. A new merging method and its spectral and spatial effects.
International Journal of Remote Sensing, 20 (10) 2003-2014, 1999.
ZHANG, Y.; HONG, G. An IHS and wavelet integrated approach to improve pan-sharpening visual quality of natural colour IKONOS and QuickBird images.
Information Fusion, 6, 225–234., 2005.
ZHOU, J.; CIVCO, D. L.; SILANDER, J. A. A wavelet transform method to merge Landsat TM and SPOT panchromatic data. International Journal of Remote Sensing, 19 (4), 743–757, 1998.