A Comparative Analysis of Image Fusion
Techniques for Remote Sensed Images
Asha Das
1and K.Revathy
2Department of Computer Science, University of Kerala.
1
asha_das_2000@rediffmail.com,
2revathy_srp@yahoo.com
Abstract—This paper deals with different techniques for registration and fusion of remote sensed images. In this work the lower spatial resolution multispectral and higher resolution panchromatic images of SPOT satellite are used. These images are registered using a registration algorithm that combines a simple yet powerful search strategy based on stochastic gradient with the similarity measure as mutual information, together with a wavelet-based multi-resolution pyramid. The algorithm is found to give sub pixel registration accuracy. The study is limited to pairs of images, which are misaligned by rotation and/or translation. The registered images are subjected to a pixel level multispectral image fusion process using wavelet transform approach. Spectral quality assessments shows that compared to other conventional image fusion techniques, this fusion process using wavelet transform keeps much of the spectral information in the merged image with respect to the original multispectral one. Finally, segmentation is performed on the fused images to validate the algorithms used for registration and fusion and the results show better accuracy for wavelet based methods than the conventional methods.
Index Terms—Fusion, image registration, mutual
information, segmentation, stochastic optimization.
I. INTRODUCTION
To address challenges in the field of remote sensing, integration of multiple sensor data is a key component, and as a first step towards this goal, very accurate registration of multi-sensor data is the first requirement for such integration. The aim of the work is to develop and assess an image registration methodology that will enable this accurate multi-source integration. This study focuses on precision correction or automatic image registration, with the goal of providing methods that can handle mono- and multi-sensor data with multi-resolution from a spatial or spectral point of view.
For combining the spatial and spectral features, data fusion techniques are used [1]. The high-resolution SPOT panchromatic (SPOT-PAN) images and multispectral SPOT (SPOT-XS) images are fused using the conventional techniques and the wavelet based methods, and the results are compared for their spectral quality.
Spectral quality assessments shows that compared to other conventional image fusion techniques, the pixel level multispectral fusion process using wavelet transform applied on these images keeps much of the spectral information in the merged image with respect to the original multispectral one. Very accurate registration of panchromatic and multispectral images is the first requirement for such integration. A registration algorithm that combines a simple yet powerful search strategy based on a stochastic gradient with the similarity measure as mutual information, together with a wavelet-based multi-resolution pyramid is found to give subpixel registration accuracy. The study is limited to pairs of images, which are misaligned by rotation and/or translation.
The result of registration and fusion of the higher resolution panchromatic image and that of the Multispectral image are subjected to watershed segmentation. The segmentation accuracy is better for the fusion using wavelet-based methods than the other conventional methods.
Section II gives an overview of the registration method adopted and section III summarizes the wavelet fusion techniques used in this work. Data sets used and results are discussed in section VI and discussions and conclusion are given in section V.
II. MULTIRESOLUTION IMAGE REGISTRATION
Fig. 1. Summary of the wavelet-based mutual information registration method
Since its introduction, MI has been used widely in many medical image registration problems, whereas its application in remote sensing image registration has been limited. Only recently, some work has been initiated on registration of remote sensed images using mutual information. For our application we selected MI as the similarity measure as they are found to give good results for the remote sensed images taken by different sensors.
The first step in registering two images is to decide on the feature space to use for matching. The wavelets or wavelet-like features are used as the feature space for the registration process. Fig.1 summarizes the adopted registration scheme when wavelet or wavelet-like information is utilized. Both the reference and input images are first decomposed following a multi-resolution wavelet or frame decomposition. In order to achieve computational efficiency, search strategy follows the multi-resolution decomposition, working iteratively from the deepest level of decomposition (where the image size is the smallest) to the top level of decomposition, i.e., going from coarse to fine spatial resolution. For all levels of decomposition, the similarity measure between sub-band images of the reference image and input image is successively computed and maximized. The accuracy of this search increases when going from coarse resolution to fine resolution [2]. Steerable Simoncelli filters [3] are more robust to translation, rotation and noise than the standard Daubechies wavelet filters and so they are adopted to extract the feature space for matching. The method described by Simoncelli enables one to build translation and rotation-invariant filters by relaxing the critical sampling condition of the wavelet transforms.
The next step is to apply the similarity measure based on Mutual Information (MI) on the extracted features of the multispectral and panchromatic images. The mutual information [4] of two images is expressed in terms of the entropy of the images, where entropy is a measure of uncertainty of how well one is able to predict the gray value of an arbitrary point in an image. Given two images A and B, the mutual information M(A ,B) of the images is defined by
M(A,B ) = H(A) + H(B) - H(A,B), (1)
with H(A) and H(B) the marginal entropies of the separate images and H(A,B) the entropy of the joint image.
The problem of registering images A and B is summarized as maximizing M (A, B), which means that the joint entropy H (A, B) is minimized (i.e. the joint histogram has sharp peaks). At the same time the marginal entropies H (A) and H (B) are maximized to avoid situations where the images are shifted so far apart that only two small regions of background coincide. Now the optimal transformation to align the images have to be found out for which the MI is maximum. The optimization technique, which is implemented in this work, is the Simultaneous Perturbation Stochastic Approximation (SPSA) algorithm [5] introduced by Spall. SPSA is based on an easily implemented and highly efficient gradient approximation that relies only on measurements of the objective function to be optimized. It does not rely on explicit knowledge of the gradient of the objective function, or on measurements of the gradient.
III
.
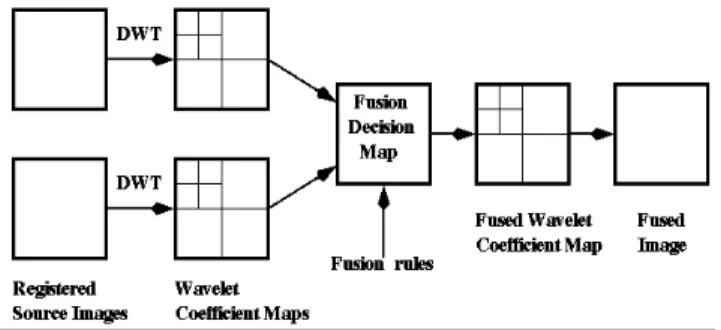
IMAGE FUSIONImage fusion is a tool for integrating a high-resolution panchromatic image with a multispectral image, in which the resulting fused image contains both the high-resolution spatial information of the panchromatic image and the color information of the multispectral image. In this study, a pixel level multispectral image fusion process using wavelet transform approach is performed [6]. Many papers about image fusion based on wavelet transform have been published in recent years [7]-[12]. The block diagram of a generic wavelet-based image fusion scheme is shown in Fig. 2.
Fig. 2. Block diagram of a generic wavelet-based image fusion approach
horizontal, vertical and diagonal components of the input images. The same process needs to be applied to all source images one by one. Then, these wavelet coefficients from the different input images are combined according to certain fusion rules to get fused wavelet coefficients. After selecting the new fused wavelet coefficients according to a fusion rule, an inverse wavelet transform is done to construct the fused image.
Implementation of image fusion by means of wavelet transform based on substitutive and additive approaches are adopted. In these approaches, first PAN image and the R, G, and B bands of multi-spectral image are decomposed using wavelet transform method. After decomposing the R, G, and B
bands of the multispectral image using wavelet transform in N
level of transformation, usually N = 2 or 3, we will have one approximation coefficients, (ANR,G,B) and 3N wavelets Planes for each band
)
(
)
(
)
(
B l B l N l B l B N WT G l G l N l G l G N WT R l R l N l R l R N WTD
V
H
A
B
D
V
H
A
G
D
V
H
A
R
+
+
+
→
+
+
+
→
+
+
+
→
(2)
- AN: is Approximation coefficient at level N or approximation plane
- Hl: is Horizontal coefficient at level l or horizontal wavelet plane
- Vl: is Vertical Coefficient at level l or vertical wavelet plane
- Dl: is Diagonal coefficient at level l or diagonal wavelet plane
Similarly by decomposing the panchromatic high-resolution image we will have one approximation coefficients, (ANP) and
3N wavelets Planes for Panchromatic image, where PAN
means, panchromatic image.
Following this step, the wavelet coefficients sets from two images are combined via substitutive or additive rules. In the case of substitutive method, the wavelet coefficient planes (or details) of the R, G, and B decompositions are replaced by the similar detail planes of the panchromatic decomposition. Then, for obtaining the fused images, the inverse wavelet transform is implemented on resultant sets.
new IWT P l P l N l P l B N new IWT P l P l N l P l G N new IWT P l P l N l P l R N
B
D
V
H
A
G
D
V
H
A
R
D
V
H
A
→
+
+
+
→
+
+
+
→
+
+
+
)
(
)
(
)
(
(3)Another possibility for fusion decision map construction is using additive fusion method in which the wavelet coefficient planes of the high-resolution image is added directly to the wavelet coefficient planes of the low spatial-resolution image in each band.
new IWT P l B l P l B l P l N l B l B N new IWT P l G l P l G l P l N l G l G N new IWT P l R l P l R l P l N l R l R N B D D V V H H A G D D V V H H A R D D V V H H A → + + + + + + → + + + + + + → + + + + + + ]) [ ] [ ] ([ ]) [ ] [ ] ([ ]) [ ] [ ] ([
(
4)For comparison purpose, the same images are also fused using Intensity, Hue, Saturation (IHS) method and Brovey and Multiplicative Transformation methods to evaluate the proposed wavelet transformation approach.
IV. DATA SETS USEDAND RESULTS
In this study, SPOT satellite images are used as the test images. A multispectral SPOT scene consists of three bands-XS1, XS2 and XS3. The first two bands characterize the ground cover in the visible wavelength range and the third band the near infrared wavelength range. These bands are acquired with a spatial resolution of 20*20m per pixel. The wavelength range of the panchromatic image covers the bands XS1 and XS2 with a ground resolution of 10*10m. After registration of the lower resolution SPOT-XS image into the high resolution SPOT-PAN image, a 512*512 pixels subset with various features that is sufficient for fusion purpose is selected. The reason for the choice of SPOT imagery is the relative simple geometric relation between panchromatic and multispectral scenes but the method described is suitable for imagery from other scenes as well. Fig. 3(a) and Fig. 3(b) show the SPOT-XS and SPOT- PAN images used in this study.
(a) (b)
Fig. 3. Test Images, (a) SPOT-XS (b) SPOT-PAN
registered with the higher resolution SPOT PAN images. An up-sampling of the lower resolution images are performed to make the pixel size equal to that of the higher resolution SPOT-PAN images. Tables I, II and III give the results of the registration of each of the bands.
TABLE I: Mutual Information Using Simoncelli Decompositions for PAN and XS1: starting point (0, 0, 0), Max: No: Iterations = 100
Actual Parameters
Level Starting MI
Estimated Parameters
Max: MI
RMS error
0 3 2
4 1.3763 0.3308 -0.8212 -0.5578
1.4045
3 0.3939 -0.0079 -1.2474 -0.9880
0.4231 1.8052
2 0.0548 0.0685 -2.1570 -1.6668
0.0576
1 0.0060 0.0834 -4.2312 -3.2374
0.0062
TABLE II: Mutual Information Using Simoncelli Decompositions for PAN and XS2: starting point (0, 0, 0), Max: No: Iterations = 100
TABLE III: Mutual Information Using Simoncelli Decompositions for PAN and XS3: starting point (0, 0, 0), Max: No: Iterations = 100
The registration of the first band XS1 with the SPOT-PAN is performed with an RMS error of 1.8052. The registration of the second band XS2 with the SPOT-PAN is performed with an RMS error of 0.64066 and 0.4529 for the case of XS3 and SPOT-PAN.
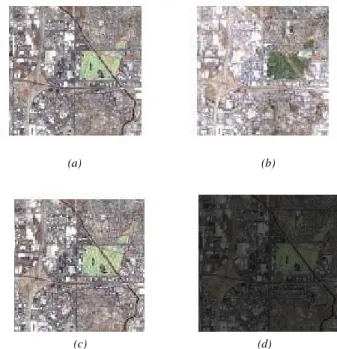
Fusion of SPOT-PAN and SPOT-XS is performed using substitutive method and additive wavelet methods and compared with other conventional methods like IHS and Brovey methods with respect to statistical and visual methods. Fig. 4(a) shows the fused image by Substitutive wavelet method and Fig. 4(b) shows the fused image by Additive wavelet method. Fusion results for IHS and Brovey methods are shown in Fig. 4(c) and Fig. 4(d) respectively.
(a) (b)
(c) (d)
Fig. 4 .Fused Images (a)WT (Substitutive Method) (b) WT (Additive Method). (c) IHS Fusion (d) Brovey Fusion
The performance of various fusion methods are analyzed by the following methods. One of the quantitative assessment criteria that is considered as a spectral quality index is the deviation index, measuring the normalized global absolute difference of the fused image with low-resolution multi-spectral image. Spectral quality of fused images is illustrated in a better way by this quantity. The Fig. 5 shows this parameter for the fused images using various methods. It can be seen that the minimum values for all of the three bands belong to the wavelet based image fusion methods.
0 0.2 0.4 0.6 0.8 1
HIS Brvy Sbst Addi
XS1 XS2 XS1
Fig 5. Deviation index of fused images
Actual Parameters
Level Starting MI
Estimated Parameters
Max: MI
RMS error
0 3 2
4 1.6274 -0.0388 -0.4203 -0.5540
1.7514
3 0.6666 -0.2618 -0.7375 -0.4012
0.7809 0.64066
2 0.2942 0.0269 -1.6284 -0.8122
0.3125
1 0.1392 0.0315 -3.2605 -1.6118
0.1392
Actual Parameters
Level Starting MI
Estimated Parameters
Max: MI
RMS error
0 3 2
4 1.6783 -0.2661 -0.4337 -0.5285
1.7527
3 0.6778 -0.2815 -0.8100 -0.4683
0.7453
0.45291
2 0.2692 -0.1657 -1.7418 -0.9790
0.2863
1 0.1277 -0.0105 -3.4676 -1.8049
Control of the radiometric correspondence of the two images at a local scale, can be performed by measuring the correlation coefficient between the two images. It is obvious from the diagram of Fig. 6 that the fused image with the wavelet transform fusion method has the maximum correlation in all the three bands. Since the correlation coefficient represents the degree of similarity, the value of the correlation coefficient is desirable to be as higher as possible, but it cannot reach to 1 which means that the fused image is the same with the original multi-spectral image and no spatial information from panchromatic image is added to the fused image. In this sense, it shows that the wavelet based fusion algorithm results in a very higher similarity between original multi-spectral image and the fused images.
0 0.2 0.4 0.6 0.8 1
HIS Bry Subs Addi
XS1
XS2
XS3
Fig 6: Correlation coefficients between SPOT-XS image and fused images
The histograms of the fused image using wavelet transform in the NIR band have a little difference with the histogram of the SPOT-XS image in the similar band (Fig.7). In spite of wavelet transform fusion method; the two others have changed the histogram of the fused image to a more extent. This means, in fusion by wavelet transform, spectral characteristics of fused image is very similar to spectral characteristics of SPOT-XS image.
0 50 100 150 200 250 0
1000 2000
a. NIR Band Histogram from XS image
0 50 100 150 200 250 0
1000 2000
b. NIR Band Histogram from WT
0 50 100 150 200 250 0
1000 2000 3000
c. NIR Band Histogram from IHS
0 50 100 150 200 250 0
2000 4000
d. NIR Band Histogram from Brovey
0 50 100 150 200 250
0 1000 2000
Fig 7: Histograms of NIR band in fused images and SPOT-XS image after (a) without fusion (b) Substitution Wavelet fusion (c) IHS Fusion (d)
Brovey Fusion (e) Additive Wavelet Fusion
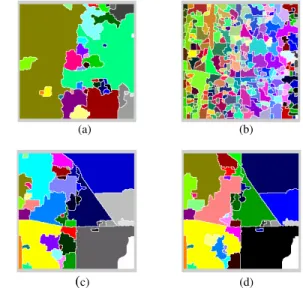
Finally the results of fusion are compared by subjecting the fused images to segmentation. We have used a typical segmentation method namely watershed algorithm. The results of the segmentation of fused images are shown in Fig. 8. It can be observed that the segmentation accuracy is better for the case of fusion using wavelet methods than using other conventional methods.
(a) (b)
(c) (d)
Fig 8 Results of watershed segmentation. Segmentation result in (a) original MS image. (b) Wavelet Fused MS image. (c) IHS Fused MS image and
(d) Brovey Fused MS
V. DISCUSSIONS AND CONCLUSION
Image Fusion aims at the integration of disparate and complementary data to enhance the information apparent in the images as well as to increase the reliability of the interpretation. This leads to more accurate data and increased utility in application fields like segmentation and classification. In remote sensing this finds immense application as the reduced amount of data in the multispectral images can be fused through efficient fusion techniques with the high informative panchromatic images to yield better high spectral and spatial resolution images. These high quality fused images can be used for landmass classification or for military purposes like target localization etc. The quality of the fused image greatly affects the classification accuracy. For this a good registration technique is required which greatly affects the quality of fused image. The entropy based MI based registration technique which is applied only quite recently to the remote sensing field is found to be giving better results for the classification purposes in this field.
REFERENCES
[2] Arlene A. Cole-Rhodes, Kisha L. Johnson, Jacqueline LeMoigne, and Ilya Zavorin,” Multiresolution Registration of Remote Sensing Imagery by Optimization of Mutual Information Using a Stochastic Gradient”, IEEE Transactions On Image Processing, Vol. 12, No. 12, December 2003
[3] E. P. Simoncelli, and W. T. Freeman, “The Steerable Pyramid: A Flexible Architecture for Multi-scale Derivative Computation,” Proc. ICIP-95, 444-447.
[4] F. Maes, A. Collignon, D. Vandermeulen, G. Marchal, P. Suetens, Multimodality image registration by maximization of mutual information, IEEE Transactions on Medical Imaging 16 (1997) 187– 198.
[5] J. C. Spall, “Multivariate stochastic approximation using a simultaneous perturbation gradient approximation,” IEEE Trans. Automat. Contr., vol. 37, no. 3, pp. 332–341, 1992
[6] A Fusion Approach of Multi-sensor Remote Sensing Data Based on Wavelet Transform, He Guojin Li Kelu Hu Deyong 1998
[7] Ranchin, T. and Wald, L., 2000. Fusion of High Spatial and Spectral Resolution images: The ARSIS Concept and Its Implementation. Photogrammetric Engineering & Remote sensing Vol. 66, pp. 49-61. [8] Yocky, D. A., 1995. Image merging and data fusion using the discrete
two-dimensional wavelet transform.J. Opt. Soc. Am. A., Vol. 12, No 9, pp. 1834-1841.
[9] Yocky, D. A., 1996. Multiresolution WaveletDecomposition Image Merger of Landsat ThematicMapper and SPOT Panchromatic Data.Photogrammetric Engineering & Remote sensing Vol. 62, No. 3, pp295-303.
[10] Zhou, J., Civco, D. L., and Silander, J. A., 1998. A wavelet transform method to merge Landsat TM and SPOT panchromatic data. International Journal of Remote Sensing, Vol. 19, No. 4, pp. 743-757. [11] Núñez, J., X. Otazu, O. Fors, A. Prades, V. Palà, and R. Arbiol,
“Multiresolution-based image fusion with additive wavelet decomposition,” IEEE Trans. Geosci. Remote Sensing, vol. 37, pp. 1204–1211, May 1999.