Corresponding author: Hamza A.Ali, Faculty of Computer Science and Information Technology, Al-Isra Private University, P.O. Box 22, Code: 11622, Amman, Jordan
Dhia Alzubaydi and
Walid A. Mahmmoud
1
Faculty of Computer Science and Information Technology,
2Faculty of Engineering,
Al-Isra Private University, P.O. Box 22, Post Code: 11622, Amman, Jordan
Abstract: Problem statement: Image fusion is a process by which multispectral and panchromatic images, or some of their features, are combined together to form a high spatial/high spectral resolutions image. The successful fusion of images acquired from different modalities or instruments is a great importance issue in remote sensing applications. Approach: A new method of image fusion was introduced. It was based on a hybrid transform, which is an extension of Ridgelet transform. It used the slantlet transform instead of wavelet transform in the final steps of Ridgelet transform. The slantlet transform was an orthogonal discrete wavelet transform with two zero moments and with improved time localization. Results: Since edges and noise played fundamental role in image understanding, this hybrid transform was proved to be good way to enhance the edges and reduce the noise. Conclusion: The proposed method of fusion presented richer information in spatial and spectral domains simultaneously as well as it had reached an optimum fusion result.
Key words: Fusion, multispectral, panchromatic, remote sensing, wavelet, transform, slantlet, image
INTRODUCTION
Remote sensing and mapping are some of the application fields benefiting from the image fusion. Many image fusion techniques and software tools have been developed. The well-known methods are, for example, Principle Component Analyses (PCA) introduced by Chavez[1], Intensity Hue Saturation (IHS) transform performed by de Bethune et al.[2] and Brovey method proposed by Seetha et al.[3].
If the objective of image fusion is to construct synthetic images that are closer to the reality they represent, then, according to the criteria proposed by PCA, IHS and Brovey fusion methods meet this objective. However, one drawback of such methods is some distortion of spectral characteristics in the original multispectral images Choi et al.[4].
Recently, developments in wavelet analysis provide a potential solution to these drawbacks. Several wavelet based techniques for fusion of 2-D images have been described in the literature[4-17].
Wavelet-based image fusion method provides high spectral quality of the fused satellite images. However, the fused images by Wavelets have much less spatial information than those by the PCA, IHS and Brovey
methods. The spatial information of fused image is an important factor as much as the spectral information in many remote sensing applications. In particular, this improves the efficiency of the image fusion application, such as unsupervised image classification. In other words, it is necessary to develop advanced image fusion method so that the fused images have the same spectral resolution as the multispectral images and the same spatial resolution as the panchromatic image with minimum artifacts Choi et al.[4].
In this study, firstly, a new Hybrid transform which is improvement from the Ridgelet transform is proposed. The Hybrid transform is based on replacing the Wavelet transform in the Ridgelet transform with the Slantlet transform. This method provides richer information in the spatial domains than Wavelets by represents better edges since edges play a fundamental rule in image understanding. A good way to enhance spatial resolution is to enhance the edges.
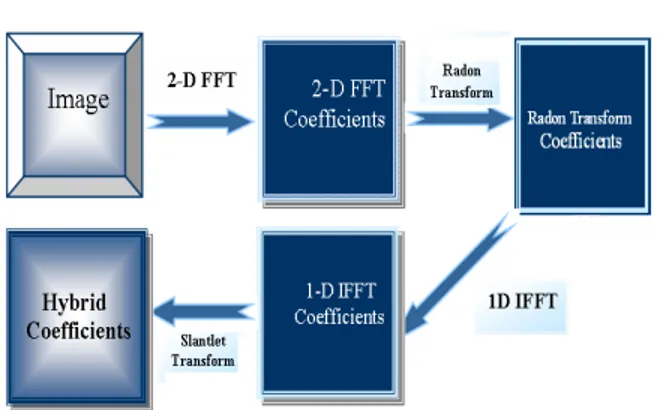
Fig. 1: Hybrid Transform Structure
The hybrid transform: To improve the performance of the individual transforms and to overcome their weakness points, here another transform is proposed, which is named as Hybrid transform.
The main idea behind the Hybrid transform is, first to apply the two dimensions Fast Fourier Transform (2-D FFT) to the two dimensions signal (image). Next, to map line sampling scheme into a point sampling scheme using the Radon transform. It is required to take the one dimension inverse Fast Fourier Transform (1-D IFFT) for each column of the produced two dimensions signal. Finally, it is required to perform the Slantlet transform to each row of the resultant two dimensions signal.
It is expected that this new hybrid transform will give a high performance and strong properties. This is because combines together the good properties of the local transforms. Particularly the Slantlet transform, the properties and performance of the Slantlet are higher even than that of the Wavelet transform. The structure of the Hybrid transform is given in Fig. 1.
MATERIALS AND METHODS
Slantlet transform filter bank: The Slantlet uses a special case of a class of bases described by[18], the construction of which relies on Gram-Schmidt orthogonalization. It is useful to consider first the usual two-scale iterated DWT filter bank and an equivalent form, which is shown in Fig. 2. The “slantlet” filter bank described here is based on the second structure, but it will be occupied by different filters that are not products. With the extra degrees of freedom obtained by giving up the product form, it is possible to design filters of shorter length while satisfying orthogonality and zero moment conditions[19].
For the two-channel case, the shortest filters for which the filter bank is orthogonal and has K zero moments are the well known filters described by Daubechies[20]. For K = 2 zero moments the iterated
Fig. 2: Two-scale iterated filter bank and an equivalent structure
Fig. 3: Two-scale filter bank structure using the slantlet
filters of Fig. 2b are of lengths 10 and 4 but the slantlet filter bank with K = 2 zero moments shown in Fig. 3 has filter lengths of 8 and 4. Thus the two-scale slantlet filter bank has a filter length which is two samples less than that of a two-scale iterated Daubechies-2 filter bank. This difference grows with the number of stages.
1 0
2 3
10 2 3 10 2
E (z) ( ) ( )z
20 4 20 4
3 10 2 10 2
( )z ( )z
20 4 20 4
− − − = − − + + + − − + + (1) 1 1 2 3 4 5 6 7
7 5 3 55 5 55
E (z) ( ) ( )z
80 80 80 80
9 5 55 17 5 3 55
( )z ( )z
80 80 80 80
17 5 3 55 9 5 55
( )z ( )z
80 80 80 80
5 55 7 5 3 55
( )z ( )z
80 80 80 80
− − − − − − − = − + − − + − + + − + + − − + + + − − + − − (2) 1 1 2 3 4 5 6 7
1 11 3 11
E (z) ( ) ( )z
16 16 16 16
5 11 7 11
( )z ( )z
16 16 16 16
7 11 5 11
( )z ( )z
16 16 16 16
3 11 1 11
( )z ( )z
16 16 16 16
− − − − − − − = + + + + + + + + − + − + − − + − (3) 3 3 2 1 E (z) z E ( )
z
−
= (4)
The proposed method of fusion consists of processing of the two images using the Hybrid transform as shown in Fig. 4. The two images are of the same scene, each with a different camera resolution. Usually the coefficients of each transform have different magnitudes within the regions of different resolution. The steps of image fusion using Hybrid Transform are:
Step 1: Image conversion: Convert the multispectral image (RGB) to IHS space. The multispectral image converted from RGB (Red, Green and Blue) space to IHS (Intensity, Hue and Saturation).
Step 2: Transform computation: Computation of slantlet transform of the two images. In this step the two images (the Pan Image and Intensity component of the RGB image) are decomposed using the Hybrid transform.
Fig. 4: Block diagram of image fusion based on hybrid transform
Step 3: Fusion selection step: There are three developed fusion rule schemes that can be used here for the proposed image fusion. The maximum selection scheme just picks the coefficient in each subband with the largest magnitude. The weighted average scheme developed by Kolczynski[22] uses a normalized correlation between the two images' subbands over a small local area. The resultant coefficient for reconstruction is calculated from this measure via a weighted average of the two images' coefficients.
Finally, the window based verification scheme that developed by[7] creates a binary decision map to choose between each pair of coefficients using a majority filter. Since the proposed method of fusion uses the one-dimension multiwavelet then there will be two bands rather than four bands which are low band (L) and the high band (H). Several experimental tests were carried out to test the fusion using the above three type schemes. It was found that using the weighted average is the best for fusion of the low band and the maximum selection scheme is the best among them for the band (H).
Step 4: Reconstruction or inverse Hybrid transform: The selection coefficients are reconstructed to get the new Intensity component for multispectral image by the Inverse Hybrid Transform.
Step 5: Inverse (IHS) to (RGB) image: Finally, we convert the new Intensity component with the same H and S to the RGB component which represent the new multispectral image. The block diagram of the proposed image fusion is shown in Fig. 4.
RESULTS
(a)
(b)
Fig. 5: IKONOS Panchromatic image and Multispectral image (×4 zoom). (a): PAN image; (b): MS image
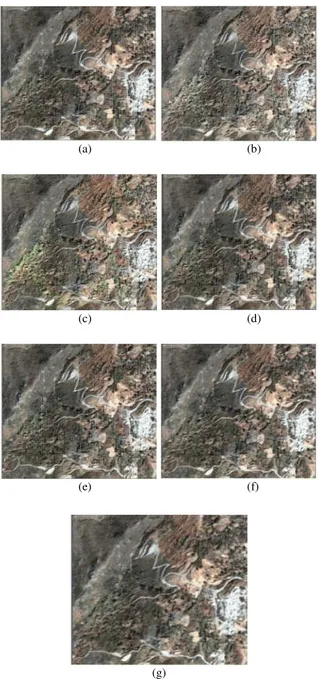
Different fusion methods applied to this data set to produce the fused multispectral images in Fig. 6.
Since the Hybrid transform is well-adapted to represent pan image containing edges and the multiwavelet transform preserves spectral information of original multispectral images, the fused image has high spatial and spectral resolution simultaneously.
From the fused image in Fig. 6, it should be noted that both the spatial and the spectral resolutions have been enhanced, in comparison to the original images. The spectral information in the original panchromatic image has been increased and the structural information in the original multispectral images has also been enriched. Hence, the fused image contains both the structural details of the higher spatial resolution panchromatic image and the rich spectral information from the multispectral images. Compared with the fused result by the wavelet, the fused result by the Hybrid has a better visual effect in IKONOS image fusion in Fig. 6.
Assessing image fusion performance in a real application is a complicated issue. In particular, objective quality measures of image fusion have not received much attention. Some techniques to blindly estimate image quality are used in this research. Such quality measures are used to guide the fusion and improve the fusion performance.
(a) (b)
(c) (d)
(e) (f)
(g)
Fig. 6: PCA, Brovey, WLT, DRGT and HYBRID fused Images. (a): Fused IHS image; (b): Fused brovey image; (c): Fused DWT based (haar) Image; (d): Fused DWT based (Db4) Image; (f): Fused DRGT based (haar) image; (g): Fused DRGT based (Db4) Image; (h): Fused hybrid image
DISCUSSION
Where:
I (r, c) = the ideal image F (r, c) = the fused image
N×N = the image size. This measure is used in Carter[3]
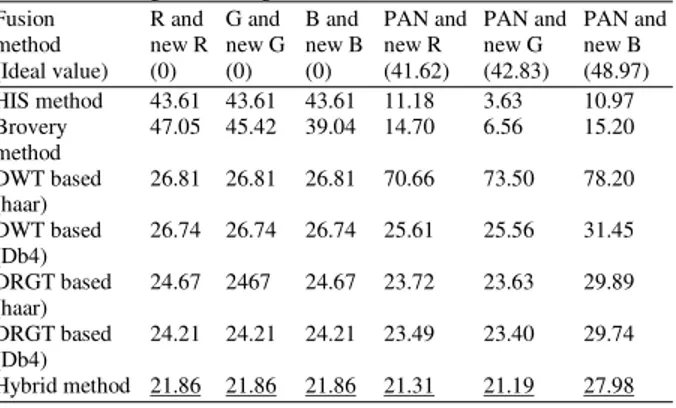
The experimental result was analyzed based on the root mean square error (RMSE) in (Table 1):
• The RMSE values between the fused image bands with their corresponding MS image bands indicate that the pixel values are less distorted in the, Hybrid method compared to the IHS, Brovey, DWT and DRGT methods
• The RMSE values between the fused images bands with the original PAN image indicate that the pixel values are less distorted in the Hybrid method compared to DWT based fusion. But it's more distorted compared to HIS, Brovey, DWT and DRGT methods
Correlation coefficient: The closeness between two images can be quantified in terms of the correlation function. The correlation coefficient ranges from -1 to +1 Carter[3]. The correlation coefficient is computed from:
(
)(
)
(
)
(
)
N N
r 1 c 1
N N 2 N N 2
r 1 c 1 r 1 c 1
I(r,c) I F(r,c) F Corr(I, F)
I(r,c) I F(r,c) F
= =
= = = =
− −
=
− −
∑∑
∑∑
∑∑
(6)
Where:
I (r, c) = The ideal image F(r, c) = The fused image
I and F = Stand for the mean values of the corresponding data set
N×N = The image size
Table 2 shows that:
•
The correlation coefficient values between each new image band with its original MS band indicate that the Hybrid fusion method produce the best correlation result(haar)
DWT based 26.74 26.74 26.74 25.61 25.56 31.45 (Db4)
DRGT based 24.67 2467 24.67 23.72 23.63 29.89 (haar)
DRGT based 24.21 24.21 24.21 23.49 23.40 29.74 (Db4)
Hybrid method 21.86 21.86 21.86 21.31 21.19 27.98
Table 2: Training and testing times for the network
Fusion R and G and B and PAN and PAN and PAN and
method new R new G new B new R new G new B
(Ideal value) (0) (0) (0) (41.62) (42.83) (48.97) HIS method 0.7205 0.6944 0.6798 0.9858 0.9975 0.9877 Brovery 0.6871 0.6720 0.7351 0.9767 0.9920 0.9750 method
DWT based 0.8871 0.8766 0.8727 0.8695 0.8758 0.8493 (haar)
DWT based 0.8877 0.8772 0.8733 0.8705 0.8763 0.8492 (Db4)
DRGT based 0.9063 0.8975 0.8947 0.8865 0.8946 0.8682 (haar)
DRGT based 0.9101 0.9018 0.8991 0.8884 0.8968 0.8704 (Db4)
Hybrid method 0.9309 0.9246 0.9233 0.9058 0.9165 0.8907
•
The correlation coefficient values between each new image band with the original panchromatic image indicate that the Hybrid fused method produces the closest correlation with the panchromatic bands compared to IHS, Brovey, DWT and DRGT methods•
Based on the experimental results obtained from this study, the Hybrid-based image fusion method is very efficient for fusing IKONOS images. Thus, this new method has reached an optimum fusion resultCONCLUSION
This study presented a newly developed method based on the Hybrid transform for fusing IKONOS images. The experimental study was conducted by applying the proposed method and compared with other image fusion methods, namely IHS, Brovey, wavelet and Ridgelet transform methods.
noise resulting from the fusion process due to the use of the Slantlet is well representing images containing edges.
REFERENCE
1. Chavez, P.S. Jr. and A.Y. Kwarteng, 1989. Extracting spectral contrast in Landsat thematic mapper image data using selective principal component analysis. Photogrammet. Eng. Remote Sens., 55: 339-348.
http://terraweb.wr.usgs.gov/projects/RSDust/#Contact 2. de Bethune, S., F. Muller and J.P. Donnay, 1998.
Fusion of multispectral and panchromatic image by local mean and variance matching filter techniques. Fusion of Earth Data, Sophia Antipolis, Jan. 28-30, Nice, France, pp: 31-37.
ftp://ftp2.fabrice-muller.be/fabricem2/publications/fusion1.pdf 3. Seetha, M., I.V. MuraliKrishna and B.L. Deekshatulu,
2005. Data fusion performance analysis based on conventional and wavelet transform techniques. Proceeding of the IEEE International Symposium on Geoscience and Remote Sensing, July 25-29, IEEE Xplore Press, USA., pp: 2842-2845. http://www.ieeexplore.ieee.org/iel5/10226/32598/0 1525660.pdf
4. Choi, M., R.Y. Kim and M.G. Kim, 2004. The curvelet transform for image fusion. Int. Soc. Photogrammet. Remote Sens., 35: 59-64. http://www.isprs.org/congresses/istanbul/yf/papers/ 931.pdf
5. Koren, I., A. Laine and F. Taylor, 1995. Image fusion using steerable dyadic wavelet transforms. Proceedings of the IEEE International Conference on Image Processing, Oct. 23-26, IEEE Computer Society, Washington DC., USA., pp: 232-235. DOI: 10.1109/ICIP.1995.537623
6. Hill, P.R., D.R. Bul and C.N. Canagarajah, 2005. Image fusion using a new framework for complex wavelet transforms. Proceeding of the IEEE International Conference on Image Processing, ICIP, Sept. 11-14, IEEE Xplore Press, USA., pp: 1338-1341. DOI: 10.1109/ICIP.2005.1530311 7. Li, H., B.S. Manjunath and S.K. Mitra, 1995.
Multisensor image fusion using the wavelet transforms. Graph. Models Image Process., 57: 235-245. DOI: 10.1006/gmip.1995.1022 8. Hong, G. and Y. Zhang, 2008. Wavelet-based
image registration technique for high-resolution remote sensing images. Comput. Geosci., 34: 1708-1720. DOI: 10.1016/j.cageo.2008.03.005
9. Wilson, T.A., S.K. Rogers and L.R. Myers, 1995. Perceptual based hyperspectral image fusion using multiresolution analysis. Optimiz. Eng., 34: 3154-3164. DOI: 10.1117/12.213617
10. Rockinger, O., 1996. Pixel-level fusion of image sequences using wavelet frames. Proceedings of the Image Fusion and Shape Variability Techniques, Leeds University Press, Leeds, UK., pp: 149-154.
http://www.rockinger.purespace.de/lasr96.pdf 11. Rockinger, O., 1997. Image sequence fusion using
a shift invariant wavelet transform. Proceedings of the IEEE International Conference on Image Processing, Oct. 26-29, Santa Barbara, CA.,
USA., pp: 288-291. DOI:
10.1109/ICIP.1997.632093
12. Koren, I. and A. Laine, 1997. A Discrete Dyadic Wavelet Transform for Multidimensional Feature Analysis Time Frequency and Wavelets. In: Biomedical Signal Processing, Akay, M. (Ed.). IEEE Press, USA., pp: 425-449. 13. Stathak, T., 2008. Image Fusion: Algorithms and Applications. Academic Press, ISBN: 0123725291 pp: 500.
14. Zhang, Z. and R. Blum, 1999. A categorization of multiscale-decomposition-based image fusion schemes with a performance study for a digital camera application. Proc. IEEE., 87: 1315-1326. DOI: 10.1109/5.775414
15. Wald, L., 2002. Data Fusion: Definitions and Architectures-Fusion of Images of Different Spatial Resolutions. International Polytechnique Press, Monterial QC, Canada.
http://www.polymtl.ca/pub/doc.php?id=7517&l=eng 16. Starck, J.L., E.J. Cand`es and D.L. Donoho, 2002.
The curvelet transform for image denosing. IEEE Trans. Image Process., 11: 670-684. DOI: 10.1109/TIP.2002.1014998
17. Dehghani, M., 2003. Wavelet-based image fusion using “A trous” algorithm. Proceeding of the Map India Conference, Jan. 28-31, New Delhi, India. http://www.gisdevelopment.net/technology/ip/pdf/ 53.pdf
Society for Industrial and Applied Mathematics, Philadelphia, PA., ISBN: 0-89871-274-2, pp: 354.