Maria José Rodrigues Ferreira
MASTER IN INFORMATICS ENGINEERING
October
|
2013
DM
Predicting and Breaking Sedentary
Behaviour at Work
MASTER DISSERTATION
Nome do Projecto/Relatório/Dissertação de Mestrado e/ou T
ese de Doutoramento |
Nome
do
Autor
DM
Predicting and Breaking Sedentary Behaviour at W
ork
SUPERVISOR
Evangelos Karapanos
Maria José Rodrigues Ferreira
MASTER IN INFORMATICS ENGINEERING
Predicting and Breaking Sedentary
Behaviour at Work
Acknowledgments
I would like to thank to my advisor Evangelos Karapanos for all the help and the guidance given. Thank you for the advice on the best options to take the multiple suggestions during the course of this thesis. For the explanations on how to use statistical software and how to interpret the data collected. For providing all the materials need to build the final prototypes and for helping me with my written and spoken English which helped me better myself.
I would also like to thank the PhD student Rúben Gouveia, for helping during the whole year, especially with the surveys, user interviews, and analysis of the data obtained during one study.
A special thanks to Délia Canha Gouveia Reis PhD in Probability and Statistics, from the Centre of Exact Sciences and Engineering of University of Madeira, for explaining and helping with the analysis of the data obtained from the first study.
I would like to thank all my friends, colleagues and testers for the availability shown and for the motivation help given.
I’m grateful to my family for all the support and encouragement given, especially during
Resumo
O objetivo desta tese foi planear e desenvolver um sistema que pude a) deduzir a necessidade dos indivíduos em fazer uma pausa a partir do seu comportamento sedentário no trabalho, b) persuadir os indivíduos para fazer uma pausa através da utilização de diferentes técnicas de psicologia persuasiva. Foram postuladas três variáveis, nomeadamente, postura do indivíduo, nível de stresse e envolvimento com a atividade mediada pelo computador. Foi desenvolvido um programa e um estudo que poderia inferir essas variáveis usando uma câmara web e o registo de teclas pressionadas e cliques do rato. Descobriu-se que o programa conseguia prever a postura através da distância do ecrã e o stresse através do movimento detetado. Foi então criada uma fórmula geral que prevê a necessidade de um indivíduo fazer uma pausa, usando só os indicadores postura e stresse.
Uma vez definido o principal objetivo, construiu-se uma aplicação e um estudo que usa três formas de comunicar uma recomendação para pausa ao utilizador: implícito, “mesmo a
tempo” e através do ambiente. O feedback implícito é feito no computador dos utilizadores através de mudanças subtis do fundo do ambiente de trabalho que fornecem pistas visuais. O
feedback “mesmo a tempo” é composto por alertas no canto inferior direito do ecrã dos
utilizadores. A esta implementação foi adicionada uma técnica de interação intuitiva na parte de trás do ecrã, onde os utilizadores podiam suspender uma notificação usando gestos simples. O
feedback através do ambiente foi feito através da utilização de uma escultura origami posta na mesa do utilizador. A escultura reflete continuamente a postura do utilizador e executa movimentos rítmicos quando é necessário recomendar pausas. Um estudo demonstrou o sucesso global do sistema, com 69% das recomendações para pausas recebidas pelos utilizadores sendo aceites. O estudo revelou ainda os pontos fortes e fracos dos três mecanismos persuasivos.
Palavras
-
chave
Abstract
This thesis aimed at designing and developing a system that can a) infer individuals’ need for a break from sedentary behaviour in the workplace, and b) persuade them to take a break through the use of different techniques from persuasive psychology. We postulated three variables, namely, individuals’ posture, stress levels and involvement in their computer mediated activity. We developed and field-studied a system that could infer these using a web camera and a key presses and mouse clicks log. We found that the system could predict posture from viewing depth and stress from the movement detected. We then created a general formula
that predicts individuals’ need for a break using only the posture and stress predictors.
Once the first objective was set, we built and field-studied a system that used three ways to communicate a recommendation for a break to a user: implicit, just-in time and ambient feedback. The implicit feedback was operationalized through changes in the users’ computer wallpaper that provided subtle visual cues. The just-in time feedback employed prompting at the
bottom right side of the user’s screen. In addition, we implemented an intuitive behind-screen interaction technique where people can snooze a notification using simple gestures. The ambient
feedback mechanism employed an origami sculpture sitting on the user’s desk. This prototype was continuously reflecting the user’s posture and performed rhythmic movements when to recommend breaks. A field study demonstrated the overall success of the system, with 69% of the break recommendations received by users were accepted. The study further revealed the strengths and weaknesses of the three persuasive mechanisms.
Keywords
List of Figures
Figure 1.1 Breakaway - On the left examples of emotions created with Line of Action, on the
right the sculpture design with Line of Action incorporated, adapted from [2] ... 1
Figure 1.2 On top left, the Fish 'n' Steps user application, on top right the public kiosk and pedometer platform, and on bottom the growth levels and facial expressions of the fishes, adapted from [3] ... 2
Figure 1.3 FitBit devices, adapted from [4] ... 2
Figure 1.4 GetWitIt popups, on top 1-button version, in the middle the 3-button version and on bottom the creator notification ... 3
Figure 2.1 Lilsys prototype, adapted from [11]... 8
Figure 2.2 MyConnector architecture, adapted from [12] ... 9
Figure 2.3 Examples of fidgeting, adapted from [15] ... 11
Figure 2.4 Changing positions of the ads, heat maps on top for eye tracking and in bottom for the mouse tracking, adapted from [17] ... 12
Figure 2.5 Impact of distractions in the ads, heat maps on top for eye tracking and in bottom for the mouse tracking, adapted from [17] ... 13
Figure 2.6 Examples of good and bad postures, adapted from [20] ... 16
Figure 2.7 Good seated posture at the computer, adapted from [21] ... 17
Figure 2.8 Layout of a working area, with colours representing areas of frequent work, adapted from [21] ... 18
Figure 2.9 Examples of four stretches, adapted from [21] ... 18
Figure 2.10 Worksurface height depending of the work executed, adapted from [22] ... 19
Figure 2.11 Common anthropometric measurements for the seated position, adapted from [22] ... 19
Figure 2.12 Zones identification for the back and the neck, adapted from [22] ... 20
Figure 2.13 Desk and worksurface placement, adapted from [22]... 20
Figure 2.14 System overview, adapted from [8] ... 21
Figure 2.15 Information presented to the user, adapted from [8] ... 22
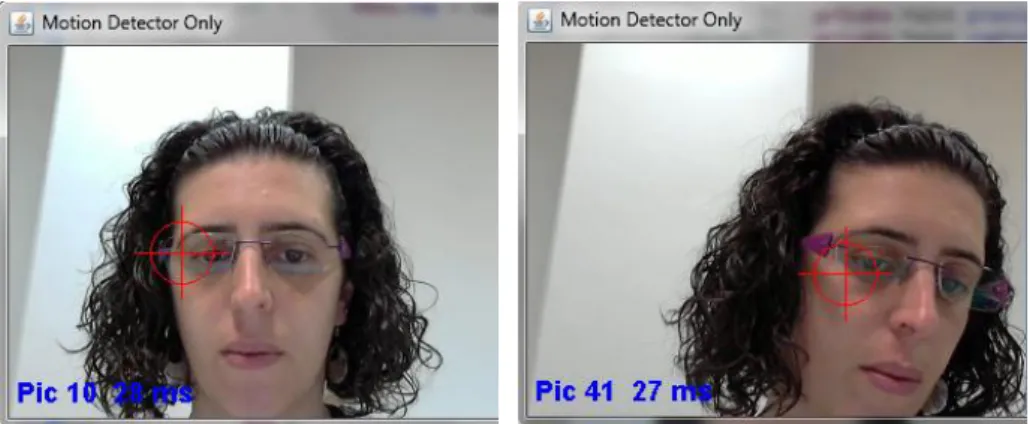
Figure 3.1 Detection of movement on pictures with seconds of difference ... 26
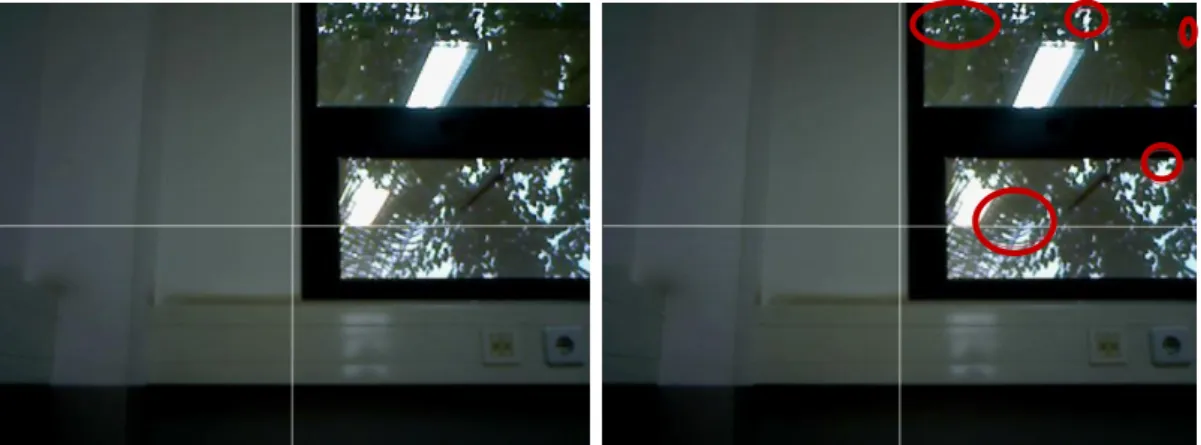
Figure 3.2 Pictures taken with the application when the user was on a break with half second of interval, the right picture contain red indications of movement compared with image on left ... 27
Figure 3.3 Pictures taken by the application, when the user was present, with half second of interval, the right picture contains red indications of movement compared with image on left . 27 Figure 3.4 Diagram of how hypothesis relate them self ... 29
Figure 3.6 Procedure follow after take a picture ... 31
Figure 3.7 Study I popup questionnaire ... 33
Figure 3.8 What users saw when used the application in Study I ... 34
Figure 3.9 On the left side frontal face detection and on the right side the original picture ... 35
Figure 3.10 On the left side the Profile detection and on the right side the original picture ... 36
Figure 3.11 On the left a picture with right profile and on the right side the horizontal flip ... 36
Figure 3.12 On the left side the Profile detection of the flipped picture and on the right side the original picture after the new flip ... 36
Figure 3.13 Measurements collected at 25cm in the upper left side, 50cm in the upper right, 75cm in bottom left and 100cm at bottom right ... 37
Figure 3.14 Popup identifying the first distance that the user must be at the current moment ... 37
Figure 3.15 Folders structure where the settings pictures were save ... 38
Figure 3.16 Architecture for Study I ... 42
Figure 3.17 Conversion of the face detection intervals in cm to a Likert scale of 1 to 5 ... 43
Figure 3.18 Face detection with the user away from the screen 50cm on left and 100cm right . 44 Figure 3.19 Stress scale in red based in Stress versus Posture predictors ... 49
Figure 4.1 Final application Use Case Diagram ... 51
Figure 4.2 Servo Motor, adapted from [29] ... 54
Figure 4.3 Screen prototype used ... 55
Figure 4.4 Sculpture moving and blinking when recommending a break ... 56
Figure 4.5 Sculpture bending forward on left and leaning back or too far position on right ... 56
Figure 4.6 Sculpture in a middle position +/- 90 degrees ... 57
Figure 4.7 Window with information of how presence is show to the user in red ... 59
Figure 4.8 Popup show when recommend a break. ... 60
Figure 4.9 Popup show after the user had made delay in the first popup ... 60
Figure 4.10 How the servo motor rotates ... 61
Figure 4.11 Wallpaper used when the user start the application and return from a break, adapted from [33] ... 62
Figure 4.12 Wallpaper used when the user is starting feeling tired, adapted from [34] ... 63
Figure 4.13 Wallpaper used when the user is feeling very tired, adapted from [35] ... 63
Figure 4.14 Wallpaper use to recommend a break, adapted from [36] ... 64
Figure 5.4 Percentage of utilization of each version, with interactive prototypes highlighted ... 77
Figure 5.5 Process of break recommendations ... 78
Figure 5.6 User making a delay movement when a popup recommendation show up ... 81
Figure 5.7 Elapsed time that users take to do a break after receiving a break recommendation . 82 Figure 8.1 GetWitIt – Create Event – first step ... 96
Figure 8.2 GetWitIt – Create Event – second step ... 96
Figure 8.3 GetWitIt – Event List ... 96
Figure 8.4 GetWitIt – View Event ... 97
Figure 8.5 GetWitIt – Notification 3 button version ... 97
Figure 8.6 GetWitIt – Notification 1 button version ... 97
Figure 8.7 GetWitIt – Notification for the event creator ... 97
Figure 8.8 GetWitIt – Rate Event ... 98
Figure 8.9 GetWitIt – History ... 98
Figure 8.10 Number of events per day ... 99
Figure 8.11 Number of events per creator with detailed category information ... 100
Figure 8.12 Entity-Relationship Model for GetwitIt application ... 106
Figure 8.13 Joints motion for the wrist, shoulder, back and neck, adapted from [22] ... 110
Figure 8.14 Measurements in degrees for the movement joints present in Figure 8.13, adapted from [22] ... 111
Figure 8.15 Java Media Framework - Select Components window ... 112
Figure 8.16 Diagram of how Cartesian coordinates relate with Polar coordinates, adapted from [39] ... 115
Figure 8.17 Entity–Relationship Model use in Study I ... 116
Figure 8.18 Entity–Relationship Model use in Study II ... 117
Figure 8.19 Origami of nine cubes, final result ... 118
Figure 8.20 Cardboards stripes ... 118
Figure 8.21 What you need to build one cube ... 118
Figure 8.22 Rolling two strips with the same size ... 118
Figure 8.23 Result of rolling two strips ... 118
Figure 8.24 Three stripes each with six squares long ... 118
Figure 8.25 With strip one, fold two squares up ... 119
Figure 8.26 With strip two, fold one square up ... 119
Figure 8.27 With strip three, fold three squares up ... 119
Figure 8.28 Start folding the cubes one the same way with strip three ... 119
Figure 8.29 Fold cubes in the same way with one of the remaining strips ... 119
Figure 8.30 Fold cubes in the same way with last strip ... 119
Figure 8.32 Folding last cube of a strip ... 120
Figure 8.33 Folding cubes of another strip... 120
Figure 8.34 Folding cubes were the strip has only two cubes ... 120
Figure 8.35 Folding last cube ... 120
Figure 8.36 Diagram of who to connect the cubes ... 120
Figure 8.37 How connect the middle cubes ... 121
Figure 8.38 Start connecting the cubes with a ten square strip ... 121
Figure 8.39 Result of the connection with one cube ... 121
Figure 8.40 Result of the connection with three cubes ... 121
Figure 8.41 Result of the connection with six cubes ... 121
Figure 8.42 Result of the middle connection ... 121
Figure 8.43 How to connect the left side of the cubes to the middle group ... 122
Figure 8.44 How to connect the right side of the cubes to the middle group ... 122
Figure 8.45 Schematic used for screen prototype ... 123
Figure 8.46 Schematic used in sculpture prototype ... 124
List of Tables
Table 3.1 Correlation between Face detection measurements and popup question about Posture
... 44
Table 3.2 Correlation between Motion detected and Stress question ... 46
Table 3.3 Correlation between Mouse and Keyboard activity with Involvement question ... 47
Table 3.4 Correlation between all four questions... 48
Table 3.5 Correlation between Posture and Stress predictors ... 48
Table 5.1 How groups were split using the A/B methodology ... 69
Table 5.2 Breaks calculated and done, grouped by type of feedback ... 72
Table 5.3 Number of break events for the sculpture and screen prototypes ... 78
Table 5.4 Metrics for the Chi-Square test ... 79
Table 8.1 Categories of events frequency ... 100
Table 8.2 Variation on attendance by positive/neutral button messages ... 101
List of Equations
Equation - 3.1 Ratio of the faces detected in the last 30 seconds ... 41
Equation - 3.2 Ratio of the movement in the last 30 seconds ... 41
Equation - 3.3 Need for a break ... 49
Equation - 4.1 Time that a person in on the computer ... 58
Equation - 4.2 Average of Stress in the last 5 minutes ... 58
Equation - 4.3 Average Posture in the last 5 minutes ... 59
Equation - 4.4 Detection of the Symmetry ... 59
Equation - 4.5 Angle to be used in the rotation of the motor ... 61
Equation - 8.1 Absolute difference between two arrays ... 114
Equation - 8.2 Moment defined for an image ... 114
Equation - 8.3 X Point based on Spatial Moment ... 114
Equation - 8.4 Y point based on Spatial Moment ... 115
Equation - 8.5 Point created with xPoint and yPoint coordinates ... 115
Equation - 8.6 Distance between a point and the origin ... 115
Equation - 8.7 X coordinate based on actual and previous Point ... 115
Equation - 8.8 Y coordinate based on actual and previous Point ... 115
List of Acronyms
BIFMA– Business and Institutional Furniture Manufacturers Association
CHIL– Computer in the Human Interaction Loop
ESM– Experience-Sampling Methodology
HCI– Human Computer Interaction
HSDF– Height of the Square that Detect a Face
IID– Interface and Interaction Design
JavaCV– Java Computer Vision
JMF– Java Media Framework
LED– Light-Emitting Diode
NIOSH– National Institute for Occupational Safety and Health
OB– Observed Breaks
OpenCV– Open Source Computer Vision
OSHA– Occupational Safety and Health Administration
RB– Recommended Breaks
SI Mean HSDF– Scale of the Interval that belong the Mean HSDF
SI Median HSDF– Scale of the Interval that belong the Median HSDF
SYCMY– Scale Y coordinate that identifies the movement
TCB– Total of Calculated Breaks
USB– Universal Serial Bus
UTP– Unshielded Twisted Pair
WinXP– Windows XP (eXPerience)
XCIM– X coordinate that identifies the movement
List of Appendices
Appendix I - GetWitIt article ... 92
Appendix II - Entity–Relationship Model for GetWitIt application ... 106
Appendix III - GetWitIt Online Questionnaire ... 107
Appendix IV - Zones of Motion joints ... 110
Appendix V - Installation steps for: OpenCV, JavaCV, Java Media Framework and other programs ... 112
Appendix VI - Process to detect Motion ... 114
Appendix VII - Entity–Relationship Model for Pilot Study ... 116
Appendix VIII - Entity–Relationship Model for Study I ... 117
Appendix IX - How to build the origami cubes ... 118
Appendix X - Schematic from Screen prototype ... 123
Appendix XI - Schematic from Sculpture prototype ... 124
Appendix XII - Entity–Relationship Model for Final application ... 125
Index
1. Introduction ... 1
1.1. Thesis Structure ... 4
1.2. Contributions... 5
2. Predicting breaks ... 6
2.1. Availability and/or Interruptibility ... 7
2.2. Stress and Involvement ... 11
2.3. Posture... 16
2.4. Conclusion ... 24
3. Study I – Predicting posture, stress and engagement through the web camera on computer tasks ... 25
3.1. Pilot Study ... 26
3.2. Research hypothesis ... 28
3.3. Research Design and Methods for Study I ... 30
3.3.1. Population, Study Sample and Sample Size ... 30
3.3.2. Collection of Data ... 30
3.3.3. Data Analysis Strategies ... 31
3.3.4. Ethics and Human Subjects Issues ... 32
3.4. Reused work from the Pilot Study ... 33
3.5. Predicting Posture ... 34
3.5.1. Face detection ... 34
3.5.2. Distance detection ... 36
3.6. Predicting Stress ... 39
3.6.1. Motion detection ... 39
3.7. Predicting Involvement ... 40
3.7.1. Mouse and Keyboard activity ... 40
3.8. Behaviour analysis ... 40
3.9. Architecture for Study I ... 42
3.10.1. Posture... 43
3.10.2. Stress ... 46
3.10.3. Involvement ... 47
3.10.4. Need of a break ... 48
3.11. Conclusion ... 50
4. System – Breaking sedentary behaviour through feedback ... 51
4.1. Planning ... 51
4.2. Hardware description ... 53
4.2.1. Tools ... 53
4.2.2. Construction ... 54
4.2.2.1. Arduino sensors - capacity sensor and servo ... 54
4.2.2.2. Screen prototype ... 55
4.2.2.3. Sculpture prototype ... 56
4.3. Implementation description... 58
4.3.1. Predicting time for a break ... 58
4.3.2. Just-in time prompting, with screen prototype ... 60
4.3.3. Ambient feedback ... 61
4.3.4. Just-in time prompting, with screen and sculpture prototypes ... 62
4.3.5. Implicit feedback ... 62
4.3.6. No feedback ... 65
4.4. Architecture for Study II ... 66
4.5. Conclusion ... 67
5. Study II – Users behaviour when faced with different types of feedback ... 68
5.1. Research Questions ... 68
5.2. Research Method ... 69
5.3.5. Just-in time recommendations ... 76
5.3.6. No feedback – pre and post use ... 80
5.3.7. Intuitive interaction ... 81
5.3.8. Conclusion ... 82
6. Conclusion ... 83
6.1. Contributions... 83
6.2. Limitations ... 85
6.3. Future Work ... 86
7. References ... 87
1.
Introduction
Sedentary behaviour exists since ever, but it has increased a lot due to the intrusion of computers in the workplace [1]. About 20 years ago, computers were not in fashion, because they were too expensive and too big. With the technological enhancements computers and laptops became cheaper and smaller and nowadays most people have at least one. Even companies had adopted computers as a mandatory equipment to have in the office. Working with computers has become common, and the levels of sedentary behaviour are increasing because of that, as people stay seated for too long.
Every time a problem arises, there is an attempt to find a technological solution to it; some examples that try to discourage sedentary behaviour are: Breakaway, Fish ‘n’ Steps and FitBit+. Breakaway it’s an ambient display (see Figure 1.1), with a design inspired in body language, common in theatre and animation arts, to express emotions. This application collects information from sensors placed in the user chair about the time the user spend sat. The more sedentary the user is more slumps the sculpture will be and the more breaks he does more upright it will be [2].
Figure 1.1 Breakaway - On the left examples of emotions created with Line of Action, on the right the
sculpture design with Line of Action incorporated, adapted from [2]
Figure 1.2 On top left, the Fish 'n' Steps user application, on top right the public kiosk and pedometer platform, and on bottom the growth levels and facial expressions of the fishes, adapted from [3]
FitBit is a device (see Figure 1.3) that tracks the steps, distance, calories burned and sleep through leading-edge accelerometer. This device can be synchronized to several equipment’s, such as computers, android phones and others. In these devices the user can see his progress with graphs, charts and reward badges [4].
Figure 1.3 FitBit devices, adapted from [4]
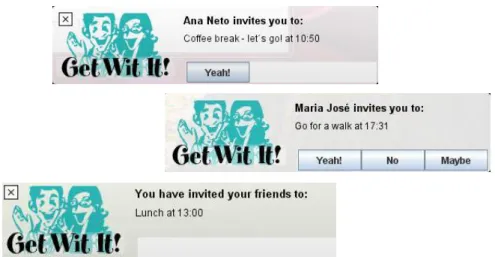
Figure 1.4 GetWitIt popups, on top 1-button version, in the middle the 3-button version and on bottom the creator notification
The GetWitIt program (see Appendix I - GetWitIt article, Appendix II - Entity– Relationship Model for GetWitIt application, Appendix III - GetWitIt Online Questionnaire) was developed as part of the Social Web course and had the purpose of encouraging people to do more breaks during the day through the help of other people that used the application; they could be friends, acquaintances or complete strangers. The strength of the application was in the notification system, one of the novelties was introduced in the buttons for acceptance/refusal choices in the notifications popups (see Figure 1.4). Some users preferred to be alerted ahead to be prepared to go to a break and others had no problem receiving always the same message as long as they knew the sender.
GetWitIt used a micro-meetup strategy for prompting activities that were specific, short-term and actionable [5]. We expected that users would choose activities that they are confident they can attain. Users receive cues-to-action through reminder messaging and the system design allowed them to experiment, seeing how they could integrate into their daily life.
The results collected with this application show that the main idea works, but people tend to be unpredictable. Letting the program be dependent only on the users input revealed to be the wrong approach to encourage people to be less sedentary. This approach does not have into account if the user needs a break and if the moment is the most appropriate to receive a recommendation.
1.1.
Thesis Structure
In chapter 2 we motivate the importance of predicting user’s context and specifically their need for a break, before recommending a break of sedentary behaviour. To predict the better way of recommend a break, it was essential to understand what types of systems already exist and what researches have conducted in this area. The methodologies present in the literature review served as support, either to replicate or to set aside, what is the best way to break sedentary behaviour without disrupting the user workflow.
Chapter 3 reports a study that aimed at predicting users’ posture and stress levels using features derived from the web camera as well as the continuous monitoring of users involvement based on mouse and keyboard activity. The goal was to infer users posture from on the viewing depth from a user to a screen; stress from the movement performed by the user; and the involvement from the actions when using the mouse and the keyboard. Based on the three previous characteristics the intent was to analyse if the need of a break is likely. The results collected from the study were positive for three of the four original hypotheses and it made creating general formulas to predict posture, stress and the need for a break possible.
Chapter 4 presents a system that monitors users’ levels of posture, stress and involvement at the computer tasks and attempts to motivate users to break sedentary behaviour through the use of three mechanisms: implicit, just-in-time and ambient feedback. The implicit feedback uses wallpaper changes to alert the user of his current state. To represent the user states of sedentary behaviour three levels of stress were implemented (low, medium and high). This was based on the time the user was sat at the computer. The just-in-time recommendations were characterized by the existence of two extra pieces – the screen and the sculpture prototypes – to give feedback to the user concerning a break alert (both prototypes) and his current posture (just sculpture prototype). The ambient feedback used the sculpture prototype and had the purpose to provide influence from the sculpture movements, not just in the user but also the surrounding people.
1.2.
Contributions
With this work we developed and field-studied two systems. In the first study we
postulated three variables, namely, individuals’ posture, stress levels and involvement in their
computer mediated activity. The goal was to achieve the users need for a break by the inference of the variables using a web camera and the log of mouse and keyboard activity.
In the second study we implemented three ways to communicate a recommendation for a break to a user: implicit, just-in time and ambient feedback. The goal of this system was to
analyse if the feedback provided would have some influence on the user’s acceptance to do a
2.
Predicting breaks
Knowledge workers spend between 4.5 to 9 hours seated on a daily basis [6]. This
sedentary behaviour (i.e., spending considerable time seated and along with low levels of energy [7]) is the cause of considerable health problems, such as eye strain, neck and shoulder pain [8], metabolic disruptions, obesity and premature mortality [7].
In order to encourage individuals to break sedentary behaviour during working hours, we aim to build a computer system that estimates appropriate times when individuals might want or need a break. Because prompting at inappropriate time might disturb the user concentration and workflow. User’s workflow could be disturbed especially if the notifications were: about unimportant information; too frequent; a flood of notifications and have annoying persistent sound [9].
2.1.
Availability and/or Interruptibility
Availability and interruptibility are two important concepts to have in mind when thinking if someone needs a break. But what does availability mean? To be available means that
someone it’s receptive to receive any kind of disruption in his/her work without perturbing the
current task. On the contrary interruptibility means to break the continuity of an action/event. These two concepts are not the same, because one reflects the willing/acceptance to be disturbed
and the other it’s related with case with which an action/event can be stopped.
To see when a person need a break it’s important to understand if she is available or not
and/or if it can be interrupted or not. The level of availability and interruptibility it’s dependent on the current task of the person. For example if a person is writing an article and its very focus her availability to speak and/or stop the current reasoning probably will be very low because this might break her concentration.
To create systems that can predict if someone it’s available and it can be interrupted can
be very difficult, because unfortunately, computer cannot perceive information like people can - from emotions and behaviour observation. Computer and communications systems are almost entirely unconscious to the human context and cannot judge whether “now is a bad time.” [10]
Lilsys and MyConnector were developed for office environments in order to help predict
user’s availability. These systems were developed to track information from several sensors and
some communication devices. Sensors can be used in different ways and can track a lot of different information, Hudson, et al. [10] study tries to understand which sensors are the most accurate to predict human interruptibility.
Lilsys is a prototype system that uses ambient sensors in predicting the user’s
unavailability. In this paper the authors argue that a system that is working – left online – does
not want to say “someone is here” or nearby. People tend to leave their computer unlocked when they are shortly absent, or when they work in the surrounding environment, so having the
computer on does not mean someone is using it or it’s in the proximity. In Lilsys they use a set
Figure 2.1 Lilsys prototype, adapted from [11]
In this system they try to examine notions of presence and availability and problems related to determining availability in telecommunications. In the end of this analysis they concluded that machine interpretation of ambient sensors was detecting cases of lower availability; they detected issues in: portrayal of usability assessment; hardware interface elements; user image control and asymmetric capabilities. One of their findings contrasted their expectations, despite what unavailability assessments show the interruptions were no less frequent.
Although Lilsys system was not 100% accurate in the predictions made, it was more assured to detect non-presence, when using the combination of motion, sound, phone and mouse plus keyboard activity. This information was compared with the Awareness system that only used keyboard and mouse monitoring to detect presence. [11]
MyConnector it’s a context-aware proactive service used to facilitate the communication based on availability of the two interested parts. This system display availability of a person based on her calendar entries, affording a number of actions such as calling, emailing and others. This program uses the framework of the project CHIL – Computer in the Human Interaction Loop that had the goal to create services that can sense human activities, interactions
and intentions. My Connector it’s available for standard phones, smart phones, desktop
Figure 2.2 MyConnector architecture, adapted from [12]
Results on this pilot study, show that PC activity – mouse plus keyboard activity, frequency of windows switching and active programs – presented lower results than the expected to predict availability. But with the MyConnector active, it revealed to be the best indicator for detect availability. Information about person’s activity like urgency and importance of current activity it was extremely valuable. With this information they achieved two different approaches. In the first approach they assume availability is too complex and difficult to be
automatically learned and sense. So the senders would decide whether it’s the best appropriate
time to contact the receiver. In the second approach they assume all intelligence is in the system so he decides in behalf of the receiver [12].
Predicting interruptibility was attempted by Hudson, et al. [10] in a study that explores which sensors are the best interpreters to use in this situation. It was used human coding of audio and video recording as ground truth and filter for non-relevant information (for example, after encoding the number of people present in the room, there were no visible sequences of images without occupants). In this study they used different learning algorithms to construct different forms of predictive models to achieve and answer to which sensor(s) it’s better to
It were created 23 simulated sensors based on information logged from the coding done in the recorded data and grouped in three categories, occupant related, guest related and environment. Some examples of the simulated sensors are: occupant presence, interaction with desk and other nearby material, sitting, writing, number of guest present, door open or closed, etc. They used several learning algorithms such as Decision Tree, support vector machine, naïve Bayesian predictors and AdaBoost with decision stumps, based on the binary decision problem
with two states, ‘interruptible’ and ‘non-interruptible’ using the simulated sensors with more information.
The results collected from the above models were similar and didn’t produce statistical significance. Since different unrelated approaches produce similar results they hope that robust models with 75-80% accuracy range can be driven from real sensors. The best modelling technique was provided by the Decision Tree model with an accuracy of 78%. Outcomes from and information gain metric based on the features collected – simulated sensors –found that speech and movement detection are the top two sensors with higher predictive power. But this information not shows if these features indicate interruptibility or non-interruptibility [10].
The existing systems and researches have some problems because they might be too intrusive for the user and/or too costly. Having systems that decide in behalf of the user might become too aggressive and make them feel presser to do something or completely ignore the system. The cost of the system its influence by the quantity of extra equipment that is need to make it work more accurately, so the more equipment its need to detect availability and/or
2.2.
Stress and Involvement
Stress and work-task involvement are two attributes that go hand by hand. The European Agency for Safety and Health at Work define stress as an imbalance that people suffer between the demands made of them and the resources they have available to cope with those demands [13]. In a working place stress sometimes can be “visible” by the person actions and behaviour, through what is called fidgeting, the act of moving about restlessly [14]. When individuals feel more pressured, they are unable to control their stress and the situation, and in most of the times, they do not have conscience of their actions. Fidgeting examples can be seen in Figure 2.3.
Figure 2.3 Examples of fidgeting, adapted from [15]
Fidgeting is one of the easiest ways to understand if people are under stress. In a
computer workstation, fidgeting often extends to users’ interactions with the computer. Computer “fidgeting” is most usually observed through an excessive amount of mouse clicks
and, sometimes, also keyboard presses.
An increase of mouse and keyboard activity does not necessarily suggest increased levels
of stress; it may also relate to users’ heightened engagement or involvement in their computer
It’s hard to identify emotions like stress, frustration, nervousness, tiredness and other with systems, but studies like the ones from Navalpakkam, et al. [17] and Epp, et al. [18] are trying to obtain user states based on specific tasks and actions in the computer.
Mouse and Eye tracking were combined to detect in a web page the user’s frustration and reading struggles. Navalpakkam, et al. [17], described how the use of those two data sources in the evaluation of content layouts more specifically the position of an ad can contribute for a better reading experience. They try to identify mouse markers that can predict user frustration and reading struggles at reasonably high accuracy. They performed two different experiments, each with 90 and 20 participants respectively. [17]
Figure 2.4 Changing positions of the ads, heat maps on top for eye tracking and in bottom for the mouse tracking, adapted from [17]
The first experiment had three treatments, each had 20 participants and all participants saw six articles. In the first treatment the ad was always on the top right page; in the second the ad was at the top right in 50% of the cases, the other 50% they were random at one of the five remaining positions; in the third treatment the ad could appear at any position of the page (see Figure 2.4). In the end of this experience user give their feedback and fill a survey. It was used standard algorithms to parse eye track data to obtain eye fixation. [17]
Figure 2.5 Impact of distractions in the ads, heat maps on top for eye tracking and in bottom for the mouse tracking, adapted from [17]
The second experiment (see Figure 2.5) had three factors: no distraction, medium distraction and high distraction created by presenting no graphics, static graphics and animated graphics. In this experiment participants saw 3 essays and answer to five questions for each essay. The results for this experiment show that when distraction levels increase, participants
have more difficulties reading the text. The eyes gaze and mouse activity it’s higher in this
cases. The report experience measured in a five points scale that mouse can predict pleasantness experiences 15% better than chance. The eye gaze and mouse patterns contain rich information about the user state. These findings suggest that mouse tracking could offer a scalable way to infer user attention and experience on the web [17].
Epp, et al., [18] study tries to answer problems like: wrong interruptions, inappropriate feedback and increase of frustration by making advances in: set of mechanisms for collection and modelling user context, set of techniques for adapting user interfaces and system behaviour based on contextual information. This type of system that detect and respond to an emotional state could improve user performance and satisfaction. [18]
In the study they executed an experience-sampling were users entered an additional sample of fixed text from Alice’s Adventures in Wonderland and also categorized their data with their level of agreement scaled with 15 emotional sates. [18]
Areas such as affective computing are interested in emotional states from users; to define emotions it has been performed two approaches, the categorical and the dimensional. The
categorical approach it’s related to give appropriate labels to different states through language.
To study unique timing patterns in an individual typing it was used keystroke dynamics, in this type of studies normally are extracted some features in keystroke timing such as: duration of a key press and elapsed time between key presses. This kind of research had been made previously in authentication systems and they show strong evidences in the interference of authentication because of strong emotional states. [18]
It was used an ESM – Experience-Sampling Methodology to obtain keystroke as well labels to each data point through responses of an emotional state questionnaire. The purpose was to receive emotional information’s in real-world time and explore more emotional states. To help users accomplish this they needed to use a device that alert them to complete the self-report. It was used a C# program to collect keystrokes measurements regardless of the focus application. The users had the hypothesis to choose or not to exclude the prompted data from the sample of the last 10 minutes. To collect current emotional state of user (example I am frustrated, I feel confident, I feel tired, etc) it was use the questionnaire with answers measured through a 5 point Likert scale. [18]
With the data we get three categories of information related to: keystroke/content features, emotional state classes and additional data points. The data related to keystroke involved was: events of key press and release, unique codes for each key and time stamp when a key event occurred. In the keystroke features they had measurements such as: keystroke duration feature (dwell) - for single key features and graphs; keystroke latency feature (flight) – always involved two keys; other keystroke features – features that combine latency and duration (example key down to down); keystroke feature overlap – some features overlap slightly. There were some specific features for the free keystroke, such as: number of characters, numbers,
punctuation marks, uppercase characters and the number and percentage of “special characters”.
For both free keystroke and fixed text it was collected the number of mistakes (backspace + delete key). In the classification of the emotional states they group up the results for only 3
classes agree, neutral and disagree; the “strongly agree” and “strongly disagree” were group in the “agree” and “disagree” respectively. [18]
For identifying emotions it was used the decision tree algorithms approach, and to choose prominent features for the emotional states models they use the correlation-based feature. It was used the under-sampling method that randomly takes out instances from majority classes to make them stay equal to the ones with minor instances to create a uniform distribution. To emotional states that suffer this method they performed 10 times the classification process and collected the mean classification accuracy and variance. [18]
In this study it was made separated models for fixed text and free text, but it’s only
that accomplished their top three are a top emotional state. There are some emotional states
(“tired” and “relaxation”) that had lower variance in the classification rate and kappa statistic,
this could mean that this model results are reliable indicators of the predictive power of keystroke dynamics for emotional state decision. [18]
The results presented in the article show that keystroke dynamics can perfectly classify from seven emotional states (confidence, hesitance, nervousness, relaxation, sadness and tired) at least two states. These results also found two new potential states for this type of
classification, anger and excitement. The current software doesn’t “know” when the user might
be in a low emotional state to prompt them with the experience sampling questionnaire so the prompts are made at random times. [18]
2.3.
Posture
Posture it’s a position of the body or of body parts [19]. Posture must be taken into account in almost all movements and actions, because severe health problems might show up by
making “bad moves”. The most common problems associated with posture are related with the
head and the shoulders (see Figure 2.6).
Figure 2.6 Examples of good and bad postures, adapted from [20]
Why posture it’s something important when working at the computer? The importance of
posture when people work in a computer it’s related with the fact that bad postures might get a
bad influence at least in user productivity.
There are several things that affect negatively the user posture when he works in the
computer and they do not depend exclusively from him. Computer workstations furniture it’s a
good example of something that normally does not depend on user choice and might produce a bad influence when does not follow the standard requirements to prevent injuries in users.
Ergonomic books are a good source of information to better understand how to identify good and bad postures, what type of equipment can be used and the types of measures that can be taken in order to correct/improve the user health. In the guidebooks of Office Ergonomics – Guidelines for Preventing Musculoskeletal Injuries and Ergonomics and Design a Reference Guide it can be found some recommendations to identify: if you work in an appropriate workstation, if you are at a good distance from screen, if you are well seated and so one.
The first thing to do it’s to know how to identify what a good posture is. A chair, the
work surface, the accessories, the monitor and the input devices can help you, or hold back in maintaining good posture. An ideal posture should be defined as: head upright and over shoulders; eyes looking slightly downward without bending from the neck; back should be supported by the backrest of the chair; wrist in a neutral posture; elbows bent at 90º, forearms horizontal, shoulders should be relaxed, but not depressed; thighs horizontal with a 90º - 110º angle at the hip; feet fully supported and flat on the floor, if not possible supported by footrest (see Figure 2.7).
Figure 2.7 Good seated posture at the computer, adapted from [21]
Figure 2.8 Layout of a working area, with colours representing areas of frequent work, adapted from [21]
Studies have found that monitor distance should be between 60 – 90 cm, if you straighten your arms in front of you and touch the monitor; probably you are too close of it.
A laptop computer when use often the same principles apply as with any computer workstation. If you have the chance use a docking station, these will help you turn your computer into a desktop computer.
Always as possible people should do stretches (every hour or throughout the day). Some examples of stretches: shake out hands, shrug your shoulders; raise one arm above your head switching arms and etc (see Figure 2.9). [21]
Figure 2.9 Examples of four stretches, adapted from [21]
When a user stand, the desk height could be in a range of 71.1 – 109.2cm depending on the type of desk work (precision, light or heavy), and be aware that the computer monitor should be located at eye level or slightly below (see Figure 2.10).
Figure 2.10 Worksurface height depending of the work executed, adapted from [22]
Users that use to be in seated position should follow the common anthropometric measurements that are slightly different for female and male. In Figure 2.11 it’s represented by
A and F letters examples of two of these measurements: sitting height (female range 79.5 – 90.9cm; male range 85.3 – 97.3cm) and knee height (female range 50.3 – 58.9cm); male range 54.4 – 63.5cm).
Figure 2.11 Common anthropometric measurements for the seated position, adapted from [22]
join movements and Appendix IV - Zones of Motion joints) in order to minimize awkward or healthy positions.
Figure 2.12 Zones identification for the back and the neck, adapted from [22]
Operators work can be support using adjustable desks when considering heavy work, the table can be at a height that allows good leverage for lifting and moving objects. For precision work, desk height can be higher than normal because the worker will need to focus closely on the workpiece.
The placement of some accessories such as keyboard tray and mouse pad holder can allow users to put them in comfortable positions where there is minimal strain to the back, arms and wrists. For example one measurement considers supporting surfaces for computer desks its viewing depth, which according to BIFMA – Business and Institutional Furniture Manufacturers Association guidelines should be greater than 39.9cm from the visual display terminal to eyes, in Figure 2.13 the H letter). [22]
Figure 2.13 Desk and worksurface placement, adapted from [22]
stay at the same position the whole time. The stress, the tiredness, the eye fatigue and other factors have influence in the person posture during that period.
Chen, et al. [8] article shows how an application can be created using a collaborative framework for ergonomic feedback using only web cameras to track all the information into an office environment.
The agencies OSHA – Occupational Safety and Health Administration – and NIOSH – National Institute for Occupational Safety and Health – are increasing their promotion about the importance of proper ergonomics for improve office workers health and wellbeing. Chen, et al. [8] describe a collaborative framework that uses a computer’s web camera and cameras in the workplace environment to collect workers current feedback about their ergonomic state. With the created program they collect measurements such as: worker average, work breaks periods, distance between worker and his monitor and measurement about worker head motion. The extra cameras spread around the office environment provide information about posture and social interaction (see Figure 2.14).
Figure 2.14 System overview, adapted from [8]
Nowadays ergonomic experts are developing strategies and references not just for workers but for employers too in order to reduce injuries in the workplace. Self-conscience
about bad habits in workers it’s important otherwise they will be reluctant in follow the
guidelines provided to correct it.
Figure 2.15 Information presented to the user, adapted from [8]
In Figure 2.15 there is an example of what is shown to users when they used the
application, (a) it’s the video from the computer web camera, (b) the user’s silhouette and eye
location, (c) graphical health bars – duration of use of the eyes, head mobility and presence in front of the computer.
Users can be alerted by the web camera feedback and by additional notifications. The web camera provides information through face detection that estimates posture and eye fatigue.
The posture it’s predictable by the foreground silhouette and the eye fatigue by the blink rate
calculation. The reminders shown to user can inform him about distance from screen, to rest the eyes and other pertinent information.
Nowadays there are applications that prompt reminders at predetermined time, but bad timing might interrupt the user work and affect negatively their efficiency and productivity. Systems must be intelligent in order to understand user’s behaviours to make reminders pertinent to them. The advances made in ubiquitous sensors and computing power had made possible gather complete personal information.
Eye tracking and gaze estimation have been used in several programs, and are fields that
are well studied, because it’s becoming important to understand where people are looking at. One of the biggest problems of these systems it’s because they can be too costly and/or too
intrusive for users. With the computer web camera it was tracked faces and gaze detection; the algorithm used to identify faces possesses a high range of detection in various poses, this because users do not stay too static along the development of their usual tasks. The face detection provides information to calculate the distance that users are from the screen (to understand computer viewing habits) and the measurements of the blinking detector (the head and the estimated eye location).
Foreground segmentation is an aspect of computer vision which is well developed, but even good algorithms that can predict motion base segmentation can fail if an object remains
human posture it being made a lot through the human silhouettes. In the developed program it’s made an assumption of the approximate silhouette of the foreground object in order to identify clearly a person from the background.
2.4.
Conclusion
In this chapter we wanted to get answers to three questions in order to understand what are the people needs and how can systems help them in order to help break sedentary lifestyle.
How do people know if they want or need to take a break? In order to understand if a person need to do a break it’s important to understand if she is available at the moment and if she can be interrupted.
How can be stress and posture predicted? The stress can be predicted through the movements that a person does and posture can be related with the viewing depth from the computer screen.
3.
Study I – Predicting posture, stress and
engagement through the web camera on
computer tasks
Nowadays people are even more dependent of the use of computers that sometimes they
lose track of time. Unfortunately it’s not only time they lose track, occasionally they don’t realise that they are sit in a wrong position for too long. There are some ergonomic guidebooks that explain how people can sit and work in a good posture when they are in front of the computer. What distance they should be from the computer, the layout that most frequent materials should have and other important factors. People that use to stay in bad postures for too long might be affected by several problems that can provoke injuries for the rest of their life, in the most severe cases.
It’s not only bad postures that can jeopardize work efficiency, stress can be too a bad
“ally”. The rise of stress can be related with the current task of the user or external factors to
that, and it’s important to understand if a person is feeling stress or not. One of the most common “visual effects” of stress are fidgeting’s. Fidgeting is associated with movement, so the
more stress a person is feeling probably more movements she is going to do.
When a person works with the computer it might suffer of “computer fidgeting”, sometimes people might feel more involved in their daily basis task and others not really; it depends on the task itself. Normally people when feel more involved tend to touch/hit in what they have nearby, normally mouse and keyboard are the closest object, so click more and/or press more the mouse and keyboard respectively might be one of the fidgeting “effects”.
It was chose university students to perform this study because they don’t have a fix
workload along the weeks and they spend a lot of their time studying, doing papers, practical works and others in the computer.
In this research it will be try to get answers to the following questions: Can posture be predicted from distance to screen? Can stress be predicted from motion detection? Can involvement be predicted through the mouse and keyboard activity? The need for a break can be predicted through posture, stress and involvement of the user? If the results achieved were positive for more than one of the hypothesis presented they will be apply in the application Break the Sedentary Behaviour through feedback (see section 4, page 51) to improve the non-sedentary behaviour of a person.
3.1.
Pilot Study
The Pilot Study had the purpose to understand and see if combining the mouse, keyboard and web camera would help foresee if there is someone at the computer. In this research it was analyse the behaviour that individuals say they had with what they really do, and understand if their normal work depend or not on the use of the computer.
Figure 3.1 Detection of movement on pictures with seconds of difference
The system created for this pilot experience (see Figure 3.1) used motion detection to analyse if it was detected any movement while the program was running (see Appendix VI - Process to detect Motion), storing all the information into an online database1 (see Appendix
VII - Entity–Relationship Model for Pilot Study). The pictures taken by the motion detector were all stored in the user’s computer to be verified the accuracy of the detection made. It was collected too mouse and keyboard activity in order to identify absence of the computer when combined with motion detection information.
Figure 3.2 Pictures taken with the application when the user was on a break with half second of interval, the right picture contain red indications of movement compared with image on left
One of the biggest problems detected with this study were the background environment choose by users, with access to the outdoor. Every time that there was wind and the user was away from the computer (see Figure 3.2) or wasn’t performing great changes in his behaviour (see Figure 3.3) the program captured the movement of the swaying trees.
Figure 3.3 Pictures taken by the application, when the user was present, with half second of interval, the right picture contains red indications of movement compared with image on left
From visual inspection of the pictures taken with the application it was detected that the amount of pictures save it was too much. One photo per each half second was too much because there was not too much difference between pictures (see Figure 3.3). The main purpose of the pictures was to find out if the person was present and if it was detected movement by the user.
3.2.
Research hypothesis
H1 – Can posture be predicted from distance to screen?
Why distance its important? The distance that user are from screen it’s an important metric to have into account when people work daily in the computer. Even researchers do not have an agreement into a minimum distance from screen; ones say that greater than 39.9cm [22]
it’s good, while others say that it should be between 60 and 90cm [21].
Predicting the user posture using only the distance from scree to user can tell us a lot about it. If people reflect a little bit about their own posture when they sit in front of the computer they will realize that they can translate it in to a distance from screen. For example if you are sit too bend in front of the screen you will be at a smaller distance from screen compared with the one that you were when you don’t had the head bend.
H2 – Can stress be predicted from motion detection?
Motion detection it’s important to be tracked why? Using movement detection to collect information about an environment could help to understand some people behaviours. Normally people cannot sit still for long periods. So capturing movement could help in the prediction of the user mood. On the other hand, absence of movement may tell us that there are no people in the surroundings.
Predicting stress can be something really tricky and inconstant, because people behave at different ways when they feel stress, some of them move a lot –head, fingers, feet’s, etc. – and
others don’t move at all. Using motion detection let’s see if it’s possible to detected movement or absence of movement when users feel more stress.
H3 –Can involvement be predicted through the mouse and keyboard activity?
Why it should be tracked the mouse and keyboard activity? The mouse and/or the keyboard might give a reflection about how frequently the person uses the computer and how engage it is with their tasks. Different tasks sometimes involve different uses of the mouse and/or keyboard, getting track of these differences might facilitate the understanding from the level of engagement of the user.
have support in his work, they will probably use the mouse or the keyboard, one more than the other.
H4 – The need for a break can be predicted through posture, stress and involvement of the user?
The necessity of a user to do a break it varies much and it’s not something that all persons
have in common. A lot of factors had influence on it; some of the more important factors might be associated with: how uncomfortable the person is when sat, how stressed is felling at the moment and how involved it is in task that’s performing (see Figure 3.4).
Figure 3.4 Diagram of how hypothesis relate them self
In this study we intend to infer the users viewing depth from the computer screen through face detection. We also expect to use motion detection to infer how stress the user is. In third place we aimed to log the mouse and keyboard activity to predict if the user is feeling involved with his work at the computer. The goal to predict the users need for a break it’s combined the previous three predictions - posture, stress and involvement.
DISTANCE
MOTION
MOUSE + KEYBOARD
POSTURE
STRESS
INVOLVEMENT
NEED
FOR
3.3.
Research Design and Methods for Study I
3.3.1.
Population, Study Sample and Sample Size
The population used in this study were students from University of Madeira, which used a Windows laptop with web camera. It was choose university students mainly because they spend more than half of their time sit either in class either studying.
This study had a sample of 4 participants and they performed the study for ten days.
3.3.2.
Collection of Data
It was performed one hour observation before the user start using the application, to collect data from his posture in front of the computer. With these observations it was collect the following data: viewing depth; standard posture of the user (may be or not a good posture), how the laptop is positioned, the type of chair and table.
The application that users used collected quantitative data that was stored in a local database (see Appendix VIII - Entity–Relationship Model for Study I).
The information needed will be obtain through pictures taken with the web camera and popup questions (see Figure 3.5).
The popup questions was shown at random times and the questions were related to the actual posture, level of stress, level of engagement and the need of a break of the participant. The answers were measured in Likert scales of 1 to 5, where 1 had a more negative connotation and 5 it was for a more positive connotation.
The pictures were taken every four seconds while the application was running following the procedure: first detection of motion, if movement present then analyse the distance moved (compared with the last picture taken) or no movement was detected; second detection of the number of persons present in front of the computer, if someone detected, gives their distance and posture in front of the screen (see Figure 3.6).
Figure 3.6 Procedure follow after take a picture
Every thirty seconds it was evaluated the mean, median and ratio for the distance of the movement detected and for the approximate distance of the participant to the screen, only for the last thirty seconds.
It was attempted to get answers to the following question: Can posture be predicted from distance to screen? Can stress be predicted from motion detection? Can involvement be predicted through the mouse and keyboard activity? The need for a break can be predicted through posture, stress and involvement of the user?
3.3.3.
Data Analysis Strategies
Before starting the analysis it was needed to execute a clean-up of the data, because the program may detect wrongly some metrics.
Take
Picture
Person(s)
Present
Get
Distance
Get
Posture
Detect
Motion
Movement
No Movement
Distance
measurements of central tendency and variability such as: mean, median and standard deviation to complement some of the finding.
3.3.4.
Ethics and Human Subjects Issues
In this research we may encounter two main issues, one is related to the use of the web camera to take pictures and the second is related to the installation of some extra applications/framework for the study application could work properly.
The web camera it’s only use to take pictures but these ones aren’t save to the computer,
they are only to do a better analysis of some functions related with presence, posture and movement. Participants may still feel “too observe” and have a different behaviour than the normal one.
For the need on the installation of extra applications/frameworks people may be unwilling
3.4.
Reused work from the Pilot Study
From the Pilot Study one of the main improvements its related with the database, it was needed to perform this changes because calls to an online database make the application work slowly and dependent on the internet connection. In order to reduce the time of this calls and the problem when no internet connection was detected, it was created a local database2.
Duo to changes made in the database and the connection (see Appendix VII - Entity– Relationship Model for Pilot Study and Appendix VIII - Entity–Relationship Model for Study I) it was needed to perform some changes in the code that collect information to be stored in the database.
Based on observations on the results from Pilot Study it was need to perform some alterations in the code to detect motion (increase the time to take each picture and remove the pictures storing). Since it was important identify clearly a person in the pictures taken, it was added the face detection to that purpose (describe in section 3.5.1, page 34).
Figure 3.7 Study I popup questionnaire
answers were measured in a Likert scale of 1 to 5 where 1 had a weak connotation and 5 a strong connotation.
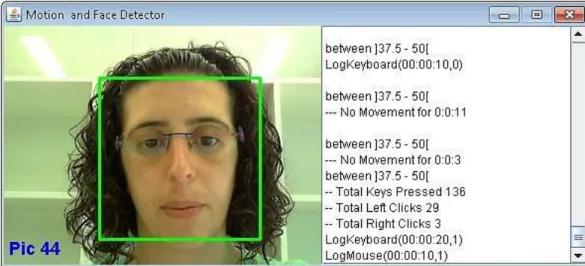
As in the Pilot Study the information obtained with the application was shown to the user, and they liked to have this kind of knowledge, in this version it was included information related to the face detection, the analysis of the distance and for how long it was detected absence of movement (see Figure 3.8).
Figure 3.8 What users saw when used the application in Study I
3.5.
Predicting Posture
Finding at least one measurement that could predict posture it’s one of the main purposes of this study. To get answer to this problem it’s intended to obtain response to the question of H1– Can posture be predicted from distance to screen?
To predict posture, it was used a face detection approach combined with the distance that the participant was to the computer screen.
3.5.1.
Face detection
The face detection was introduce in this new version in two separate ways, the first one its related with all pictures taken in the app and the second one with the main settings to detect the distance between the screen and the person.
To detect a face it’s was used a java class created by Andrew Davison as base (update of
To the original face detection code it was added a square in the location of the face, but for this approach it was needed to know not if a face was found but also the dimensions of the square, so it was made some alterations in Davison code in order to store this information.
With the original code of the face detection it was possible to know how many persons were being detected, but for the approach taken with this study that was not enough. Since the number of people present was identified through squares, it was used that information to collect posture metrics. Once the squares were not accessible to user and they would have a fundamental role in several moments, for example when detecting the Settings pictures, it was added that functionality to the original code. Based on the squares sizes it was collected information about their height, which would be used to detect distance between the user and the screen (describe in section 3.5.2, page 36).
Some of the new additional features added to Davison file were: choose the type of Haar Classifier Cascade file to be used (these files have measurements to identify frontal and profile faces), flip an image, analyse the distance (describe in section 3.5.2 page 36) and identifying the interval that belong the distance (describe in section 3.5.2 page 36). The first step performed
with these new functions it’s related with the type of detection that it’s intended to be done. It
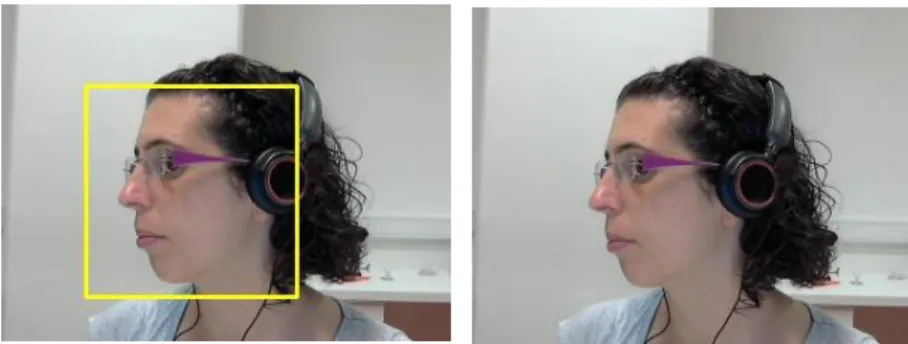
was chosen only two types of identification, the frontal face detection (see Figure 3.9) and the left profile detection (see Figure 3.10) because after some tests they seemed to be the most accurate for the type of detection desired.
Figure 3.9 On the left side frontal face detection and on the right side the original picture
![Figure 1.2 On top left, the Fish 'n' Steps user application, on top right the public kiosk and pedometer platform, and on bottom the growth levels and facial expressions of the fishes, adapted from [3]](https://thumb-eu.123doks.com/thumbv2/123dok_br/15678354.625271/18.892.214.682.109.426/figure-steps-application-public-pedometer-platform-expressions-adapted.webp)
![Figure 2.2 MyConnector architecture, adapted from [12]](https://thumb-eu.123doks.com/thumbv2/123dok_br/15678354.625271/25.892.201.733.117.456/figure-myconnector-architecture-adapted-from.webp)
![Figure 2.8 Layout of a working area, with colours representing areas of frequent work, adapted from [21]](https://thumb-eu.123doks.com/thumbv2/123dok_br/15678354.625271/34.892.130.726.107.390/figure-layout-working-colours-representing-areas-frequent-adapted.webp)
![Figure 2.10 Worksurface height depending of the work executed, adapted from [22]](https://thumb-eu.123doks.com/thumbv2/123dok_br/15678354.625271/35.892.194.679.213.422/figure-worksurface-height-depending-work-executed-adapted.webp)