November
|
2014
Non-Invasive
Strategy
in Assessing Asthma
Through Biofluids Metabolomics Exploration
Exhaled breath and urine potentialities
Michael Manuel Lima CaldeiraTD
Non-Invasive Strategy in Assessing Asthma
Through Biofluids Metabolomics Exploration
Exhaled breath and urine potentialities
DOCTORAL THESIS
DIMENSÕES:
45 X 29,7 cm
PAPEL:
COUCHÊ MATE 350 GRAMAS
IMPRESSÃO:
4 CORES (CMYK)
ACABAMENTO:
LAMINAÇÃO MATE
NOTA*
Caso a lombada tenha um tamanho inferior a 2 cm de largura, o logótipo institucional da UMa terá de rodar 90º ,
para que não perca a sua legibilidade|identidade.
Caso a lombada tenha menos de 1,5 cm até 0,7 cm de largura o laoyut da mesma passa a ser aquele que consta
no lado direito da folha.
Nome do Projecto/Relatório/Dissertação de Mestrado e/ou T
ese de Doutoramento |
Nome
do
Autor
TD
Michael Manuel Lima Caldeira
DOCTORATE IN CHEMISTRY
SUPERVISORS
José Sousa Câmara
Sílvia Maria da Rocha Simões Carriço
Michael Manuel Lima Caldeira
DOCTORATE IN CHEMISTRY
SPECIALTY IN ANALYTICAL CHEMISTRY
Through Biofluids Metabolomics Exploration
Non-invasive strategy in assessing asthma through biofluids
metabolomics exploration: exhaled breath and urine potentialities
Michael Manuel Lima Caldeira
Thesis submitted to Madeira University in order to obtain the degree of Doctor
in Analytical Chemistry
Thesis supervised by:
Professor Doutor José Sousa Câmara
Professora Doutora Sílvia Maria da Rocha Simões Carriço
Funchal – Portugal
Dedication
"The important thing is not to stop questioning.
Curiosity has its own reason for existing."
i
Acknowledgements
I would like to express my appreciation to all persons, colleagues and friends that helped me throughout my dissertation and herein I shall mention them:
My supervisors Prof José S. Câmara and Prof Sílvia M. Rocha, for their support, assistance, patience and availability to guide me through the right path throughout these years
Dr António Barros (UA) for the various insights, advice in multivariate analysis and
very rewarding discussions in several parts of the developed work
Profª Dr. Ana Gil and Dr Iola Duarte for allowing the possibility of using the NMR
and for the healthy discussions in the analysis of the results
A special thanks to Fundação para a Ciência e Tecnologia (FCT) for my PhD grant (SFRH/BD/40374/2007). To both universities for providing the conditions: Aveiro
University (UA) I thank for welcoming me and providing the conditions to develop all
experimental and written work for my thesis and Madeira University (UMa) for the last stage of this thesis. Funding is acknowledged from the European Regional Development Fund (FEDER) through the Competitive Factors Thematic Operational Programme
(COMPETE) and from the FCT, Portugal, under projects PEst-C/QUI/UI0062/2013
(Research Unit 62/94 QOPNA), PTDC/QUI-QUI/117803/2010,
PTDC/QUI-BIQ/119881/2010 and PEst-OE/QUI/UI0674/2011) (Research Unit CQM). I also thank
Sigma-Aldrich® for providing the first dimension column for GC×GC–ToFMS analysis.
To Hospital Infante D. Pedro E.P.E (Aveiro, Portugal) for allowing this work to be
accomplished. A special thanks to Dr Arménia Parada, Dr Maria João Bilelo and Dr Ana
Morête for their support in the sample and data collection for this thesis. A special
acknowledgment to Dr Ana Morête for receiving me for three years on her consultation, for the discussions that allowed me a deeper insight to the asthma pathology and for giving me the medical perspective on asthma from a diagnosis to the continuous healthcare administered to the patients. I am very grateful to the donors that kindly supplied the samples from
Paediatric Service of Hospital D. Pedro E.P.E (Aveiro, Portugal) and Immunoalergology
Services of the Hospital Infante D. Pedro E.P.E (Aveiro, Portugal) for allergic asthma
ii
I acknowledge my colleagues that made this a special journey and made this an easier ride. They are forever in my heart and prayers: Andrea da Silva, Claúdia Rocha, Eduarda
Correia, Elisabete Coelho, Gonçalo Graça, Joana Carrola, João Rodrigues, Juliana
Vinholes, Magda Santos, Sílvia Diaz, Inês Sousa, Catarina Luís Silva and Freddy
Rodrigues. A special thanks to my friend and colleague Rosa Perestrelo for her company in
and out of the lab, camaraderie and wit.
To the most important people in my life: my family. A heartfelt and special thanks to my beautiful wife Joana Luís. Her continuous support, affection, love (even being thousands of kilometers away) was essential to the completion of my PhD and of course this thesis. Our long talks encouraged me to pursue the goals and for that I do not have enough words to express how grateful I am… And my loving parents Conceição Caldeira and Manuel
Caldeira, I also wish to express a very heartfelt acknowledgment for providing me with all
the support, love and for listening even when they did not understand what I was talking about… Thank you for teaching work ethics, for my education, for pushing me to do better, for being an example. In conclusion, for helping to build the man that I am today.
Resumo
iii
Resumo
A asma é um problema de saúde pública com impacto significativo na população pediátrica que tem apresentado um crescimento notável ao longo dos anos.O desafio proposto para esta tese de doutoramento foi o desenvolvimento de metodologias avançadas para o estabelecimento de padrões metabolómicos em urina e ar exalado associados à asma, cuja aplicabilidade foi posteriormente explorada para avaliar o estado da doença, a adesão ou efeito da terapia e para fins de diagnóstico.
A composição volátil do ar exalado foi estudada combinando a microextração em fase sólida em modo espaço-de-cabeça (HS-SPME) com cromatografia de gás acoplada a espectrometria de massa ou com a cromatografia gasosa bidimensional abrangente acoplada à espectrometria de massa com analisador de tempo de voo de alta resolução (GC×GC- TOFMS). Estas metodologias permitiram identificar centenas de compostos de diferentes famílias químicas. A análise multivariada (MVA) permitiu concluir que o perfil metabolómico de indivíduos com asma é caracterizado por teores mais elevados de compostos associados à peroxidação lipídica, eventualmente associado a stress oxidativo e inflamação
(alcanos e aldeídos). Com vista a futuras aplicações em contexto clínico, foi definido um conjunto de 9 metabolitos, cuja aplicabilidade foi comprovada na monitorização do estado da doença e avaliação do efeito e/ou adesão à terapia.
O metaboloma volátil global de urina também foi explorado usando um método HS-SPME/GC×GC-TOFMS, tendo sido identificados cerca de 200 compostos. Foi realizada uma análise-direccionada usando 78 metabolitos relacionados com a peroxidação lípidica e consequentemente com os níveis de stress oxidativo e inflamação. O padrão metabolômico
não volátil urinária de asma foi estabelecido usando ressonância magnética nuclear de protão (1H NMR). Esta análise permitiu identificar vias metabólicas, como o stress oxidativo,
metabolismo dos amino ácidos e lipídico e alterações da microflora intestinal, alterações no ciclo do ácido tricarboxílico, no metabolismo da histidina, acidose láctica, e a modificação de resíduos de tirosina livre após a estimulação de eosinófilos.
Os resultados obtidos permitiram explorar e demonstrar a potencialidade da análise do perfil metabolómico do ar exalado e urina na asma. Além do desenvolvimento bem sucedido das metodologias de análise, foi possível explorar através do ar exalado e da urina vias metabólicas afetadas pela asma observando-se complementaridade entre as matrizes, bem como verificar a aplicabilidade clínica dos métodos desenvolvidos.
Palavras-chave
v
Abstract
Asthma is a significant health issue in the pediatric population with a noteworthy growth over the years. The proposed challenge for this PhD thesis was the development of advanced methodologies to establish metabolomic patterns in urine and exhaled breath associated with asthma whose applicability was subsequently exploited to evaluate the disease state, the therapy adhesion and effect and for diagnostic purposes.
The volatile composition of exhaled breath was studied combining headspace solid phase microextraction (HS-SPME) with gas chromatography coupled to mass spectrometry or with comprehensive two-dimensional gas chromatography coupled to mass spectrometry with a high resolution time of flight analyzer (GC×GC–ToFMS). These methodologies allowed the identification of several hundred compounds from different chemical families. Multivariate analysis (MVA) led to the conclusion that the metabolomic profile of asthma individuals is characterized by higher levels of compounds associated with lipid peroxidation, possibly linked to oxidative stress and inflammation (alkanes and aldehydes) known to play an important role in asthma. For future applications in clinical settings a set of nine compounds was defined and the clinical applicability was proven in monitoring the disease status and in the evaluation of the effect and / or adherence to therapy.
The global volatile metabolome of urine was also explored using an HS-SPME/GC×GC–ToFMS method and c.a. 200 compounds were identified. A targeted analysis
was performed, with 78 compounds related with lipid peroxidation and consequently to oxidative stress levels and inflammation. The urinary non-volatile metabolomic pattern of asthma was established using proton nuclear magnetic resonance (1H NMR). This analysis allowed identifying central metabolic pathways such as oxidative stress, amino acid and lipid metabolism, gut microflora alterations, alterations in the tricarboxylic acid (TCA) cycle, histidine metabolism, lactic acidosis, and modification of free tyrosine residues after eosinophil stimulation.
The obtained results allowed exploring and demonstrating the potential of analyzing the metabolomic profile of exhaled air and urine in asthma. Besides the successful development of analysis methodologies, it was possible to explore through exhaled air and urine biochemical pathways affected by asthma, observing complementarity between matrices, as well as, verify the clinical applicability.
Keywords
vii
Publications
Publications in international journals with referee
M. Caldeira, A.S. Barros, M.J. Bilelo, A. Parada, J.S. Câmara, S.M. Rocha, Profiling allergic asthma volatile metabolic patterns using a headspace-solid phase microextraction/gas chromatography based methodology. J. Chromatogr. A 1218 (2011) 3771.
M. Caldeira, R. Perestrelo, A.S. Barros, M.J. Bilelo, A. Morête, J.S. Câmara, SM. Rocha, Allergic asthma exhaled breath metabolome: a challenge for comprehensive two-dimensional gas chromatography. J. Chromatogr. A 1254 (2012) 87.
M. Caldeira, A.S. Barros, A. Morête, J.S. Câmara, S.M. Rocha, The unexplored potential of exhaled breath analysis in the aid of asthma clinical management, 2015, submitted.
M. Caldeira, A.S. Barros, A. Morête, J.S. Câmara, S.M. Rocha, Asthma volatile urinary metabolome uncovered by comprehensive two-dimensional gas chromatography-time of flight mass spectrometry (under preparation).
Oral communications
M. Caldeira, J.S. Câmara, S.M. Rocha, Estabelecimento de perfis metabólicos em crianças com asma alérgica e crianças controlo, 4ªs Jornadas de Bioquímica da Universidade de
Aveiro, Aveiro, Portugal, April 2010.
M. Caldeira, J.S. Câmara, S.M. Rocha, In-deep study of compounds from oxidative stress in breath: a challenge to allergic asthma diagnosis,12th International Symposium on Extraction Technologies,Poznan, Poland, September 2010.
viii
Poster communications
M. Caldeira, A.S. Barros, J.S. Câmara, S.M. Rocha, Development of complete factorial design to assess of allergic respiratory diseases metabolomic patterns by SPME/GC-qMS based methodology, International Conference on Breath and Breath Odor Research, Dortmund, Germany, April 2009.
M. Caldeira, A.S. Barros, A. Parada, J.S. Câmara, S.M. Rocha, Development of a complete factorial design to assess allergic respiratory diseases metabolomic patterns by a solid-phase microextraction gas chromatography-mass spectrometry based methodology, 6º Encontro Nacional de Cromatografia, Funchal, Portugal, December 2009.
M. Caldeira, J.S. Câmara, S.M. Rocha, Allergic asthma exhaled breath: from one dimensional to comprehensive two-dimensional chromatographic analysis, 34nd International Symposium on Capillary Chromatography and 7th GCxGC Symposium, Riva del Garda, Itália, May
2010.
ix
Table of Contents
Acknowledgements ... i
Resumo ... iii
Abstract ...v
Publications ... vii
Table of Contents ... ix
Figure Captions ... xiii
List of Tables ...xix
CHAPTER 1 INTRODUCTION ...1
1.1 Asthma ... 1
1.1.1 Asthma: definition, symptoms and clinical diagnosis ... 1
1.1.2 Costs, incidence and prevalence ... 5
1.1.3 Disease management ... 7
1.1.4 Asthma Pathophysiology ... 10
1.2 Metabolomics ... 25
1.2.1 Concept ... 25
1.2.2 Analytical techniques in metabolomics: MS or NMR based methodologies ... 27
1.2.3 Metabolomics in asthma ... 29
Exhaled breath ... 30
Urine ... 32
1.3 Biofluid Analysis: breath and urine ... 34
1.3.1 Methodological aspects of sampling procedures ... 34
Exhaled breath ... 34
Urine ... 37
1.3.2 Breath and urine characterization based on solid phase microextraction combined with gas chromatography analysis ... 38
1.3.3 Urine characterization based on proton based nuclear magnetic ressonance ... 47
1.4 Data pre-processing and multivariate analysis ... 51
1.4.1 Data normalization in metabolomics ... 51
1.4.2 Principal component analysis and partial least squares - discriminant analysis ... 52
1.4.3 Statistical models validation ... 53
1.5 Aims and outlines of this PhD thesis ... 55
1.6 References ... 57
x
2.1 Overview ... 71
2.2 Profiling allergic asthma volatile metabolic patterns using a headspacesolid phase microextraction/gas chromatography based methodology ... 73
2.2.1 Abstract ... 74
2.2.2 Framework ... 75
2.2.3 Experimental ... 76
Standards and materials ... 76
Breath samples ... 76
Experimental design ... 77
Breath analysis ... 77
GC-MS analysis ... 79
Statistical analysis ... 79
2.2.4 Results and discussion ... 80
Experimental design: HS-SPME optimization ... 80
Breath analysis ... 82
Multivariate analysis ... 89
2.2.5 Concluding remarks ... 92
2.3 Allergic asthma exhaled breath metabolome: A challenge for comprehensive two-dimensional gas chromatography ... 95
2.3.1 Abstract ... 97
2.3.2 Framework ... 98
2.3.3 Experimental ... 99
Standards and materials ... 99
Samples ... 99
Breath sampling... 100
HS-SPME methodology ... 101
GC×GC–ToFMS analysis ... 101
Multivariate Analysis ... 102
2.3.4 Results and Discussion ... 103
Structured chromatogram and sensitivity ... 103
Multivariate analysis in the establishment of asthma “breath-print” ... 110
“Breath-print” exploration as a potential aid to the clinical practice ... 114
2.3.5 Concluding remarks ... 117
2.5 The unexplored potential of exhaled breath analysis in the aid of asthma clinical management ... 119
.5.1 Abstract ... 119
2.5.2 Framework ... 120
2.5.3 Material and methods ... 120
Patients clinical history and samples collection schedule ... 120
Breath sampling and analysis ... 123
Multivariate Analysis ... 124
xi
PLS-DA model prediction: applicability of developed breath metabolomics based model ... 125
Asthma clinical management through breath analysis: exacerbation condition ... 129
Omalizumab therapy adherence: Evaluation of breath sampling relation and patient’s clinical status 131 2.5.5 Concluding remarks ... 134
2.6 References ... 135
CHAPTER 3 ... 141
EXPLORATION OF ASTHMA URINE METABOLOME ... 141
3.1 Overview ... 143
3.2 Asthma volatile urinary metabolome uncovered by comprehensive two-dimensional gas chromatography-time of flight mass spectrometry ... 145
3.2.1 Abstract ... 145
3.2.3 Material and Methods ... 147
Subjects ... 147
Urine analysis using SPME/GC×GC–ToFMS ... 148
Data Processing ... 148
3.2.4 Results and discussion ... 149
Urine volatile composition provided by HS-SPME/GC×GC–ToFMS ... 149
Targeting urinary asthma metabolomics toward oxidative stress impact ... 158
3.2.5 Concluding remarks ... 164
3.3 Exploring the urinary metabolomic profile of children with asthma by 1H Nuclear Magnetic Resonance ... 165
3.3.1 Abstract ... 165
3.2.2 Framework ... 166
3.2.3 Experimental ... 166
Subjects ... 166
Sample Preparation and 1H NMR analysis ... 168
Data processing ... 168
3.2.4 Results and discussion ... 170
Normalization of urinary compounds ... 170
Improving metabolomic data through variable selection ... 173
Asthma urinary asthma metabolomics based on 1H NMR ... 177
3.2.5 Concluding remarks ... 180
CHAPTER 4 CONCLUSIONS AND FUTURE PERSPECTIVES ... 185
4.1 Conclusions ... 189
4.2 Future Work ... 189
xiii
Figure Captions
Figure 1.1 - The interaction between airway inflammation and clinical symptoms…….. 1
Figure 1.2 - Skin prick test………. 4
Figure 1.3 - Cost of care for asthma in Europe……….. 6
Figure 1.4 -Worldwide prevalence of asthma……….. 7
Figure 1.5 - Non-pharmacological and pharmacological asthma management………… 8
Figure 1.6 - Asthma management continuum (ICS- Inhaled Corticosteroid; LABA- long
acting beta2-agonists; LTRA- Leukotriene Receptor
Antagonist).………. 9
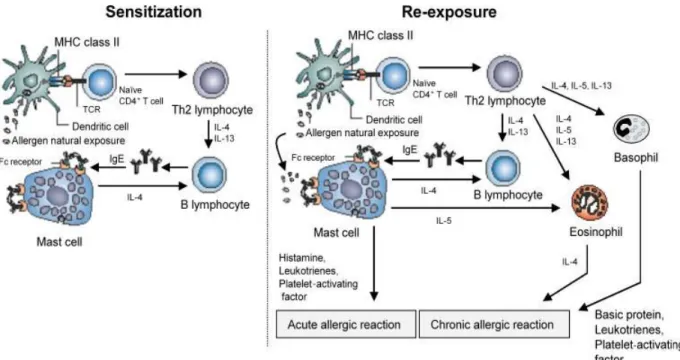
Figure 1.7 - Allergic asthma pathophysiology representation of sensitization and re-exposure
(CD- Cluster of Differentiation; IL- Interleukin; TCR- T-cell receptor). ……… 11
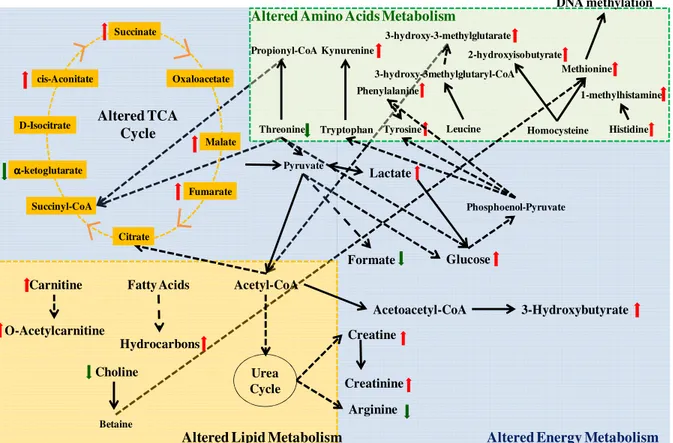
Figure 1.8 - Main altered biochemical pathways in asthma………. 13
Figure 1.9 - Allergens and reactive oxygen species linked in asthma Allergens and reactive
oxygen species linked in asthma (DEP- Diesel Exhaust Particles; GM-CSF- granulocyte macrophage colony-stimulating factor; MCP- Monocyte chemotactic protein; TNFα- tumor necrosis factor alpha).……….. 14
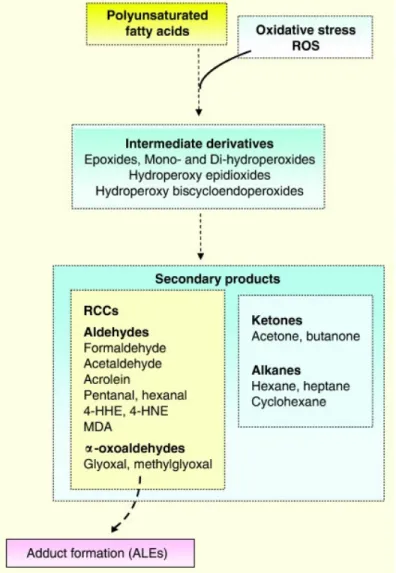
Figure 1.10- Secondary products formation in LPO (ALEs - advanced lipoxidation end
products)……… 16
Figure 1.11 - Possibilities of the damage caused by ROS……… 17
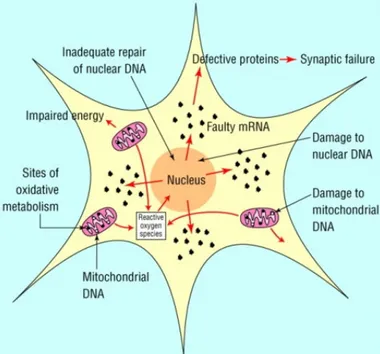
Figure 1.12 - Reactive oxygen species damage nuclear and mitochondrial DNA……… 18
Figure 1.13 – Example of amino acid involvement in other biochemical pathways ( AAs –
xiv
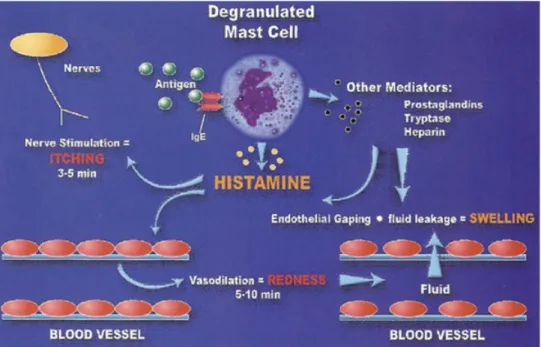
Figure 1.14 - Role of histamine in allergic reaction………... 22
Figure 1.15 – Methionine pathway to cysteine and glutathione (AMP- Adenosine
monophosphate SAH- S-adenosyl-homocysteine; SAM- S-adenosyl methionine).………. 23
Figure 1.16 - The interactions between the different omics fields……… 25
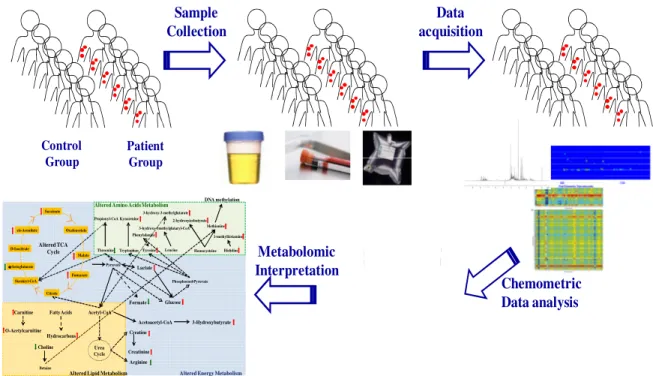
Figure 1.17 - Metabolomic analysis workflow………. 26
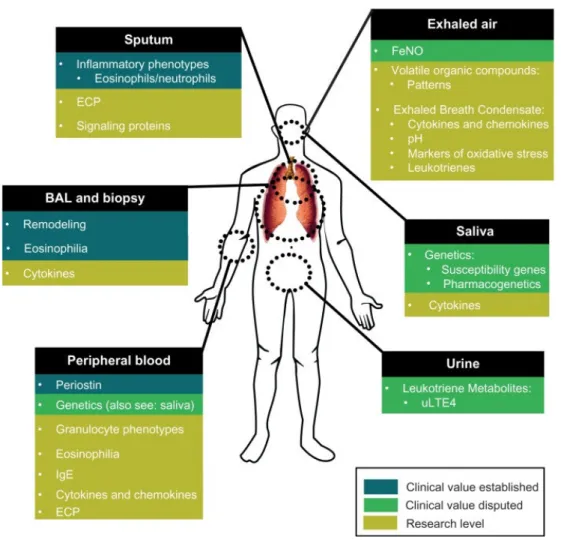
Figure 1.18 - Asthma biomarkers overview: present and future? (ECP- Eosinophil Cationic
Protein; FeNO- Fractional exhaled nitric oxide; uLTE- Urinary Leukotriene)... 29
Figure 1.19 - Representation of non-invasive to invasive sampling techniques………… 31
Figure 1.20 - Capnograph waveforms with mixed expiratory and alveolar sampling (Phase I-
Respiratory baseline, Phase II- Expiratory Stroke, Phase III- Expiratory Plateau; PetCO2-
partial pressure of end-tidal carbon dioxide…... 35
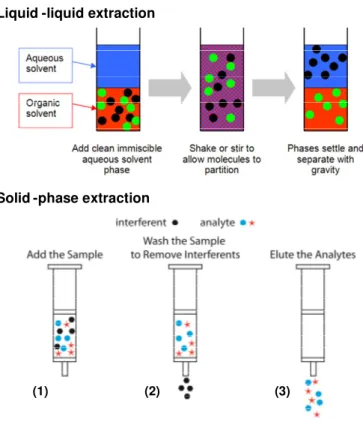
Figure 1.21 - Comparison between liquid-liquid and solid phase extraction……… 39
Figure 1.22 - GC×GC generation and visualization……….. 46
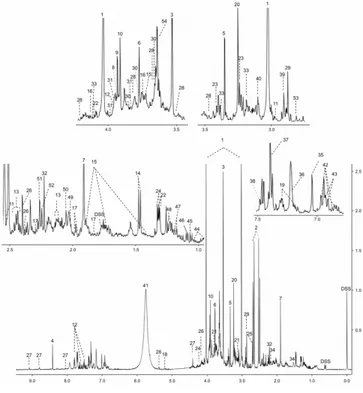
Figure 1.23 - Example of a urine 1H NMR spectrum………. 48
Figure 2.1 - Full factorial design of solid-phase microextraction conditions for GC-MS
analysis of exhaled breath
………... 81
Figure 2.2 - Total peak area and number of compounds comparison between two breath
collection containers (Tedlar® gas sampling bags and BIOVOC®). a.u. – arbitrary units………. 83
Figure 2.3 - Cleaning procedure effects with rising number of nitrogen flushes for two
xv
Figure 2.4 - Evaluation of the intra-individual variability over a period of three weeks for selected group of six compounds. – u.a. arbitrary units……….. 86
Figure 2.5 - (A) PLS-DA LV1xLV2 scores scatter plot and (B) loading weights plot of
exhaled breath for allergic asthma (AA and AA+RA) and heatlhy children. Peak identification is presented in Table 2.5……… 89
Figure 2.6 - Peak apex plot of the alkanes (linear, ramified and cyclic), alkenes, aldehydes
and ketones identified using allergic asthma exhaled breath sample……… 108
Figure 2.7 - Blow-up of a part of total ion GC×GC chromatogram contour plot obtained from
an allergic asthma exhaled breath showing the corresponding ramified alkane, cycloalkane and ramified aldehyde: 4-ethyloctane (33), 1,1,2,3-tetramethylcyclohexane (34) and 2-ethylhexanal(35), respectively………. 109
Figure 2.8 - Total ion GC×GC chromatogram and corresponding contour plots of 1-dodecene
(94) and dodecane (95) varying the concentration from 20 (A) to 200×103 pg/L (B)…… 110
Figure 2.9 - PLS-DA LV1×LV2 scores scatter plot (A) and LV1 loading weights plot (B) of
exhaled breath for allergic asthma and healthy children using a sub-set of 23 compounds identified by GC×GC –ToFMS, and previously reported in a study related to allergic asthma (peak attribution shown in Table 2.5)………. 111
Figure 2.10 - PLS-DA LV1×LV2 scores scatter plot (A) and LV1 loading weights plot (B)
showing the potentiality of exhaled breath using the full dataset of 134 compounds identified by GC×GC –ToFMS for allergic asthma and healthy children discrimination..……… 112
Figure 2.11 - Q2 values distribution of the original and permuted Monte-Carlo Cross
Validation for PLS-DA of exhaled breath of full dataset (134 compounds)………. 113
Figure 2.12 - PLS-DA LV1×LV2 scores scatter plot (A) showing the potentiality of using a
xvi
Figure 2.13 - Q2 values distribution of the original and permuted Monte-Carlo Cross
Validation for PLS-DA of exhaled breath of sub-set of 9 compounds: nonane, 2,2,4,6,6-pentamethylheptane, decane, 2-methyldecane, dodecane, tetradecane, nonanal, decanal, and dodecanal……… 117
Figure 2.14 - (A) Projection of new exhaled breath dataset using the breath metabolomics
based model of chapter 2.4 for asthmatic and healthy children and (B) validation of the obtained results Q2 values distribution of the original and permuted MCCV (1000
permutations)………... 125
Figure 2.15 - (A) Projection of new exhaled breath dataset using the breath metabolomics
based model of chapter 2.4 using a sub-set of 9 compounds (nonane, 2,2,4,6,6-pentamethylheptane, decane, 2-methyldecane, dodecane, tetradecane, nonanal, decanal, and dodecanal) and (B) validation of the obtained results Q2 values distribution of the original and
permuted MCCV (1000 permutations) ... 127
Figure 2.16 - PLS-DA LV1×LV2 scores scatter plot of exhaled breath for asthmatic and
healthy children using a data set with 130 compounds coloured according to (A) age range (3 to 5 years old, 6 to 9 years old and 10 to 16 years old) and (B) according to exhaled breath collection site demonstrating no influence on the discrimination. Figures based on metabolomic PLS-DA based models previously developed... 128
Figure 2.17 - (A) Alkane variations for 10 breath samples collected for three years in the same asthmatic child based on the built PLS-DA model with two LVs and (B) predicted Y value against reference Y value behavior. a. u. arbitrary units……… 130
Figure 2.18 - PLS-DA LV1×LV2 scores scatter plot of exhaled breath for asthmatic and
xvii
Figure 2.19 - (A) Omalizumab therapy monthly frequency monitoring and (B) PLS-DA
LV1×LV2 scores scatter plot of exhaled breath for asthmatic and healthy children using a sub-set of 9 compounds. Path of the severe asthma patient is highlighted - A through F sampling moments: 4 months (a), 4 months and half (b), 6 months (c), 6 months and half (d), 17 months (e), and 20 months (f) after Omalizumab initial treatment……….. 132
Figure 3.1 - Peak apex plot of the compounds identified in urine depicting all the chemical
families present in Table 3.2……… 156
Figure 3.2 - Peak apex plots depicting five biochemically relevant selected families: alcohols,
aldehydes, alkanes, alkenes and ketones. Comparison between the asthma and healthy groups scaled peak areas………. 158
Figure 3.3 - Heat map of biochemically relevant selected families, aldehydes, ketones,
alkanes, alkenes and alcohols. Each line represent a scaled volatile compound (organized by chemical families) and each column represents a subject (organized by healthy and asthma children)……….. 159
Figure 3.4 - (A) A) PLS-DA scores scatter plot showing a clear discrimination between
allergic asthma and healthy children, (B) LV1 loading weights plot of the selected 78 metabolites with the identification of main compounds related to the healthy group ………. 161
Figure 3.5 - ROC space (A) where each point represents a prediction result (sensitivity and
1-specificity) of the confusion matrices obtained from MCCV (500 iterations) of the PLS-DA model for the different data normalization techniques employed and Q2 values distribution (B)
of the original and permuted Monte-Carlo Cross Validation for PLS-DA of exhaled breath of full dataset……… 162
Figure 3.6 - Partial Least Squares Discriminant Analysis (PLS-DA) applied to 1H NMR urine
spectra ( 0.50 to 10.0, excluding 4.55-6.05) using different data normalization techniques:
(A) normalized to total area, (B) normalized to creatinine signal and (C) by probabilistic quotient normalization (PQN). The R2 for the total area, creatinine normalizations and PQN
xviii
asthma patients are represented by open symbols ………... 171
Figure 3.7 - ROC space, where each point represents a prediction result (sensitivity and
1-specificity) of the confusion matrices obtained from MCCV of the PLS-DA model with PQN; full symbols, prediction results in the original model (class membership, healthy or asthma, correctly assigned); open symbols, prediction results in the permuted model (class membership randomly permuted) ……… 172
Figure 3.8 - PLS-DA LV1 loadings plot of all compounds colored as a function of VIP. Blue
represents VIP starting from 0 and red represents the highest obtained VIP value……… 173
Figure 3.9 - Scores plot for the first two latent variables of PLS-DA models from 1H NMR
spectra of urine using PQN using two possible variable selection: (A) Variable Importance in Projection (VIP) higher than 1 and (B) by selecting regions between 0.5-3ppm and 6-9.5ppm combined with VIP>1………. 175
Figure 3.10 - ROC space, where each point represents a prediction result (sensitivity and
xix
List of Tables
Table 1.1 - LPO mechanism phases …...14
Table 1.2 - Lipid metabolism related compounds by Nuclear Magnetic Ressonance ... 15
Table 1.3 - Oxidative stress and LPO secondary compounds in asthma studies analysing
exhaled breath by GC-MS……….. 17
Table 1.4 - Energy metabolism affected by asthma………... 19
Table 1.5 - Amino acid metabolism affected by asthma……… 20
Table 1.6 - Commercially available SPME coatings……….. 41
Table 2.1 - Characteristics of the studied population in GC-MS study: allergic asthma and
healthy children……….. 77
Table 2.2 - Volatiles identified in Tedlar bags and cleansing procedure effects with rising number of nitrogen flushes………. 84
Table 2.3 - Identified compounds in exhaled breath in both children with allergic asthma and
healthy children and obtained from ambient air parallel sampling………. 87
Table 2.4. - Characteristics of the studied population in the GC×GC-ToFMS: allergic asthma
and healthy children……… 100
Table 2.5 - List of volatile compounds identified by GC×GC –ToFMS in exhaled breath of
allergic asthma and healthy children………... 105
Table 2.6 - Traits of the allergic asthma population used in the projection………... 121
Table 3.1 - Characteristics of the studied population in the GC×C-ToFMS study: allergic
asthma patients and healthy controls... 147
Table 3.2 - Urinary compounds dataset tentatively identified by GC×GC–ToFMS from
xx
Table 3.3 – Characteristics of the studied population in the1H NMR : allergic asthma patients
and healthy children……… 167
Table 3.4 - Compounds (variables) contributing for the discrimination between healthy
subjects and asthma patients (VIP>1; highest VIP and corresponding chemical shift highlighted) and comparison between the data available in the literature for each compound and the obtained results in this study. The bold values were used in test T……… 174
Table 3.5 - Prediction Results Obtained by MCCV (500 Iterations) of PLS-DA Models Built
for the Classes: Healthy vs Asthma (n=142).Comparison between the PLS-DA using PQN,
xxi
List of Abbreviations
Abbreviation/ Acronyms
Significance
1D One dimensional
1H NMR Proton nuclear magnetic resonance
AIT Allergen specific immunotherapy BAL Bronchoalveolar lavage BALF Bronchoalveolar lavage fluid Car/PDMS Carboxen / polydimethylsiloxane
CLTs Cysteinyl leukotrienes CW/DBV Carbowax/divinylbenzene
DC Direct current
DVB/CAR/PDMS Divinylbenzene/carboxen/polydimethylsiloxane EBC Exhaled breath condensate
FeNo Fractional exhaled nitric oxide FEV1 Forced expiratory volume 1
FVC Forced vital capacity
GC×GC–ToFMS Comprehensive two-dimensional gas chromatography coupled to mass spectrometry with a high resolution time of flight analyzer GC–MS Gas chromatography coupled to mass spectrometry
GINA Global Initiative for Asthma
GMC-SF Granulocyte macrophage colony stimulating factor HS-SPME Headspace solid phase microextraction
ICS Inhaled corticosteroids IgE Immunoglobulin E
IL Interleukin
ISAAC International Study of Asthma and Allergies in Childhood LABAs Long acting beta2 agonists
LC-MS Liquid chromatography coupled to mass spectrometry LLE Liquid-liquid extraction
LOO-CV Leave one out cross validation LPO Lipid peroxidation LTC4 Leukotriene C4 LTMs Leukotriene modifiers LTRA Leukotriene receptor antagonists
xxii
Abbreviation/ Acronyms
Significance
MDGC Multidimensional gas chromatography MVA Multivariate analysis
PA Polyacrylate
PCA Principal component analysis PDMS Polydimethylsiloxane
PDMS/DVB Polydimethylsiloxane/ divinylbenzene PLS-DA Partial least squares discriminating analysis
PQN Probabilistic normalization quotient RF Radio frequency
RI Retention indices RNS Reactive nitrogen species ROC Receiver operating characteristics ROS Reactive oxygen species SABAs Short acting beta2 agonists
SPE Solid-phase extraction TCA Tricarboxylic acid
Th T-helper
TNF-α Tumor necrosis factor alpha
UPLC-MS Ultra performance liquid chromatography coupled to mass spectrometry
CHAPTER 1
INTRODUCTION
Chapter
1
1.1 Asthma
1.1.1 Asthma: definition, symptoms and clinical diagnosis
Asthma is a complex chronic disorder of the airways characterized by variable and recurring symptoms, airflow obstruction, bronchial hyperresponsiveness, and an underlying inflammation1. These characteristics interact and determine the clinical
manifestations, asthma severity and treatment response. The symptomatology associated with asthma is coughing, wheezing, breathlessness and chest tightness that varies from person to person in severity and frequency (Figure 1.1).
Figure 1.1 – The interaction between airway inflammation and clinical symptoms1.
Asthma severity is divided into four groups: intermittent, persistent-mild, persistent-moderate and persistent-severe. Asthma control can also be classified as well, not well and poorly controlled2. Both asthma severity and control are assessed by
2
establish the adequate therapy. Nevertheless, asthma severity can change over time and therefore continuing care is highly recommended3.
Asthma complexity leads to an evolving concept. Previously, asthma emphasized the duality of allergic asthma and non-allergic asthma. More recently, research in this field led to separate into subgroups based upon clinical, physiologic, and pathologic characteristics. Thus, an array of phenotypes and endotypes arose. Asthma phenotypes include allergic asthma, severe steroid-resistant asthma and asthma induced by exposure to air pollution, cigarette smoke, diesel exhaust particles, obesity, aspirin and exercise4. Eighty percent of childhood asthma has been reported to be allergic5. The triggers that cause allergic asthma are known as allergens. These comprise a large array of substances that two important characteristics: (1) they are almost always organic and (2) are always harmless to non-allergic individuals. Common sources include animal proteins (cat and dog allergens), dust mites, cockroaches, fungi and pollens.
Asthma symptoms can manifest at any time in life, although many people develop asthma as children. In this PhD thesis, the focus was on pediatric asthma. Diagnosing asthma in children can be a difficult task to perform differing from pre-school children, school-aged children, adolescents and adults in several ways. In early life, asthma is quite variable and not fully grasped. Early childhood wheezing and symptoms related to asthma are heterogeneous disorders with several phenotypes and variable expressions during infancy. Another issue is related to the use of objective lung function tests in children, as these procedures poses a challenge for children to perform. Asthma control in children is also a complex issue due to the anatomic differences, as for example the smaller size of airways and lower inspiratory flow rate, affecting medication deposition in the affected airways. In addition to these aspects, there are a number of comorbidities that have similar symptoms to the ones caused by asthma, as well as, asthma is also associated with other pathologies such as rhinitis, hay fever, atopic eczema and rhinosinusitis. These comorbidities have a role in asthma clinical expressions and are documented to influence asthma management and control6.
3
and older, pulmonary function tests are performed: auscultation, spirometry and bronchodilator response test1.
Spirometry is a relatively simple and non-invasive method to measure the full lung inflation air volume and flow using forced manoeuvres7. It plays an important role
in diagnosis and managing respiratory diseases; nevertheless there is no standard reference tests to accurate determine the sensitivity or specificity of spirometry to establish airflow limitation8. Gender, age, height, weight and ethnic group are factors that influence the obtained values9. The volume of air exhaled forcefully in 1 second is denominated forced expiratory volume 1 (FEV1) and the forced vital capacity (FVC) is the volume that can be maximally forcefully exhaled, so FVC contains FEV1. To detect an obstruction the ratio FEV1/FVC has to be lower than 0.7 and FEV1 less than 80% of the predicted value. FVC is highly dependent on the effort and collaboration of the subject and to complete a maneuver subjects must expel air forcefully and completely at least three times. This is extremely difficult for elderly subjects, children and those with severe airflow limitation. Another disadvantage in spirometry is that it is not recommended for asymptomatic individuals, being used for those with respiratory symptoms and there is no benefit in using spirometry to monitor disease status. This limitation leads to underdiagnosis in younger subjects and overdiagnosis in elderly subjects, which leads to false positives and false-negatives depending on age10.
The determination of nitric oxide (NO) levels in exhaled breath is also an available tool that may complement asthma diagnosis. NO induced by inflammatory mediators in the airways are reportedly increased in asthmatic patients11. Several reports have been published to demonstrate its clinical value. NO is produced when L-arginine is catalyzed by nitric oxide synthases (NOS) into L-citrulline12. NO can be measured online allowing the evaluation with a real-time display. In the offline mode exhaled breath is collected into containers for posterior analysis. NO values are affected by several factors such as age, race, gender, atopy, diet, nasal NO contamination, measurement techniques, exhalation flow rate, among others. Although a connection between NO levels and eosinophils in blood, bronchoalveolar lavage fluid (BALF), sputum, and bronchial biopsies may correlate to eosinophilic inflammation, there are confounders that might result in higher eosinophilic content. Other pathologies that cause inflammation other than asthma, as atopic eczema reported by Zinelli and co-authors13, increase the levels of NO found in exhaled breath. Recently, Hastie et al.14
4
prediction of sputum eosinophil and neutrophil percentages. The link between NO and treatments remain unclear, nevertheless lower values of NO are reported with the administration of short acting β-agonists15. Using NO in the clinical practice is still debated due to the inconsistencies and due to the large number of factors that can affect the outcome.
Whenever the doctor suspects that asthma is related to allergens evaluation can be performed by skin prick tests. This test is performed by pricking the skin with a pin that contains a small dosage of the allergen, and if an immune-response arises in the form rash or urticaria the conclusion is that the patient has a hypersensitivity to that allergen (Figure 1.2).
Figure 1.2 – Skin prick test16
5
important parameters such as airway inflammation, instead of symptoms and lung function.
The invasive method of obtaining samples such as BALF, bronchoscopy or bronchial biopsy are normally used to measure airway inflammation and to give more detailed information of asthmatic patients. Sputum induction is performed by inhaling isotonic or hypertonic solutions by nebulisation to induce airway secretion that can be expectorated18. BALF is an important tool in the diagnosis of several lung diseases in which a bronchoscope is passed through the mouth or nose into the lungs and a liquid is squirted in and collected for examination. The use of lung tissue in asthma is also a possibility using samples obtained during the bronchoscopy procedure yielding important information on tissue resident cells19. Although these procedures indicate
airway inflammation more accurately, the invasiveness impairs their regular use in the clinical practice creating the necessity to assess the inflammation status in a less invasive manner. Blood is a less invasive method than sputum induction and bronchoscopy. It can be assumed that it can be used to indirectly measure the state of asthma as the inflamed tissue releases chemoatratractants and cytokines, which recruit activated immune cells from peripheral blood.Another possibility for atopy evaluation is the determination of allergen specific Immunoglobulin E (IgE) from blood samples. IgE antibodies are detected and measured by allergen-specific IgE antibody assays. The amount of bound allergen-specific IgE is interpolated from a standard calibration curve linked to WHO IgE standard20.
1.1.2 Costs, incidence and prevalence
6
Figure 1.3 – Cost of care for asthma in Europe (data from 2003)24.
These elevated costs are related to disease severity, poor illness control and underdiagnosis (direct costs) in addition to the costs related to time off work or school (indirect costs). It can be observed from Figure 1.3 that more than 50% of the costs are due the indirect costs of asthma not only of those affected by the pathology but also the caregivers. In England, up to 69% of parents had to miss working days due to their child asthma and 13% have been reported to quit their jobs25. The direct costs have also increased in the primary and secondary care, in addition to hospital admissions and treatment costs. The expenses associated with asthma drugs represent about 20% of the total costs in Europe25. Asthma, therefore, has a significant socioeconomic impact not
only on patients, but on the whole family and consequently reducing life quality26.27
Incidence and prevalence are two important concepts. Incidence is the risk evaluation to develop a new condition in a specific period of time whereas prevalence is the population portion that has the said condition28. Over the last years, it has been observed a striking increase in asthma incidence mainly in the urban areas of developed countries. It is thought that urbanization and industrialization are the main contributors to this tendency. Developing countries have also shown signals in following this pathway. Nevertheless, globally in the past 5-10 years data suggests stabilization of asthma incidence29. Asthma prevalence, despite of hundreds of reports, is difficult to determine as there is a lack of a precise and well-defined definition of asthma that makes the comparison of reported prevalence rather difficult30 (Figure 1.4). Globally the
prevalence of asthma for different countries varied between 1 and 18%31 accordingly to
the data listed in 2012 GINA report.
Outpatient care 3.8
Billion
Drugs 3.6 Billion Inpatient care
0.5 Billion Productivity
Figu
There is a sharp increase 50% each decade. The data f asthma severity and poor disea In Portugal, the latest as Portuguese population has ast this, and according to the Int (ISAAC) performed in 4 di Porto), children between the teenagers (13-14 years old) va
1.1.3 Disease managemen
After diagnosing asthm The control is focused in dec symptoms frequency and inte may possess - such as lung fun
igure 1.4 – Worldwide prevalence of asthma32
se in global prevalence over the last 40 years, inc a from hospitalization due to asthma reflects an i sease management, especially in young children33. asthma prevalence study (2012) has shown that 6 sthma currently whilst 10.5% had lifetime asthma International Study of Asthma and Allergies in
different Portuguese cities (Coimbra, Funchal, e ages of 6-7 asthma prevalence was 13%, whilst varied between 9% (in 1995) and 12% (2002)35.
ent
thma and assessing its severity, an action plan is decreasing the risk of asthma attacks, the impai
tensity and whatever functional restrictions that nction decline1.
7
increasing by n increase in
.
t 6.8% of the ma34. Before
n Childhood l, Portimão, lst asthma in
8
The control of asthma symptoms can be achieved by either a pharmacological and/or a pharmacological management (Figure 1.5). The non-pharmacological management can be performed before or after the disease onset being designated primary and secondary prophylaxis, respectively. House dust mite, animal allergens (dog or cat fur, for example), tobacco smoke, pollen, specific foods (for example, eggs or milk) are some examples of triggers if avoided can help in controlling asthma symptoms.
Figure 1.5 – Non-pharmacological and pharmacological asthma management36
Asthma treatment is an intricate pathway involving several steps that aims to achieve asthma control (Figure 1.5). The objective is to promote the decrease on medication intake to the lowest possible whilst the asthma condition remains stable. Nevertheless, treatment is approached in a step wise fashion, i.e., if the asthma severity increases the frequency and medications increases or if it diminishes the opposite is observed36. Asthma is treated with two types of medicines: controller asthma (long-term control) and rescue asthma (quick-relief) medications. Long-term control medicines help reduce airway inflammation and prevent asthma symptoms. Quick-relief, or "rescue," medicines alleviate asthma symptoms that may flare up. The initial treatment will depend on the asthma severity. In case of allergic asthma, many triggers can set off or worsen your asthma symptoms.
The pharmacological management aims to control the disease, which entails several parameters to be achieved such as no daytime or nighttime symptoms, no need for rescue medications, no exacerbations, normal lung function, no limitation in activity and all with minimal medication side effects. Asthma medication can be divided into two main classes: medication for long-term control that includes inhaled corticosteroids (ICS), leukotriene modifiers (LTMs) and long acting beta2-agonists (LABAs). For quick
relief of airflow obstruction and symptoms there are available short-acting beta2
-Asthma management
Non-pharmacological Pharmacological
Primary prophylaxis Secondary prophylaxis
Corticosteroids Leukotriene
receptor antagonist Inhaled
anticholinergic
Long-acting beta2-agonist
Rescue asthma medication Controller asthma medication
9
agonists (SABAs), anticholinergics and systemic corticosteroids. ICS are the most effective long term control medication for asthma that reduces inflammation in the airways and clinically there is a reduction of symptom severity, improvement of asthma control, diminished airway hyperresponsiveness, hospitalization reduction and prevention of exacerbation, among others. Moreover, ICS suppresses cytokine generation and the release of inflammatory mediators37. LTMs are divided into two classes: leukotriene-receptor antagonists (LTRA) and leukotriene-receptor inhibitors (LTRI). Leukotrienes are potent biochemical mediators that contract airway smooth muscle, increase vascular permeability, increase mucus secretions and activate inflammatory cells in airways of patients with asthma. LTRA prevents leukotriene binding whilst LTRI focus on synthesis inhibition38. As for inhaled LABAs, their
actions is to relax airway smooth muscle by stimulating beta2-receptors and are used as
an adjunct to inhaled CCS to provide long-term control of asthma symptoms39. SABAs provide quick relief of symptoms relaxing the muscles lining the airway within 5 minutes, increasing the airflow thus relieving asthma symptoms. Nevertheless, SABAs do no control the inflammation. Asthma management is a continuous appreciation of the patient’s asthma status as shown in Figure 1.6.
Figure 1.6 – Asthma management continuum40 (ICS- Inhaled Corticosteroid; LABA- long
acting beta2-agonists; LTRA- Leukotriene Receptor Antagonist).
Environmental Control
Controlled
Uncontrolled
Fast-acting bronchodilator on demand
Inhaled Corticosteroid
Second line: Leukotriene Receptor Antagonist
12 years: Add LABA
6-11 years: Increase ICS
12 years: Add LTRA
Prednisone
10
Allergen-specific immunotherapy (AIT) is a treatment used whenever asthma symptoms cannot be controlled by medication and environmental control, who cannot tolerate the medication, or do not comply with the medication regimen. AIT entails the administration of allergen extracts to provoke clinical and immunologic tolerance to the allergen. AIT can be administered subcutaneously or sublingually. This therapy stimulates desensitization and allergen specific tolerance in addition to the inhibition of allergic inflammation in affected tissues41. Several disadvantages limits a broader applicability, as for example, unwanted secondary effects, and poor efficacy/specificity that are mainly related to a poor quality of natural allergen extracts and the treatment takes several years42.
For those suffering from the severe type of asthma and that have allergies Omalizumab® can be considered. This drug is a humanized, monoclonal anti-IgE antibody that stops the allergy cascade by binding to the circulating IgE. This medication is subcutaneously injected every 2 to 4 weeks usually related to the total IgE levels. This therapy is used whenever in patients 6 years of age or older with severe, persistent allergic asthma and elevated serum IgE levels whose symptoms cannot be controlled with ICS. This drug lowers the IgE levels regardless allergen specificity preventing free IgE from interacting with mast cells, basophils, macrophages, dendritic cells, among other cells43.
1.1.4 Asthma Pathophysiology
11
mast cells so that the allergen specific receptor site is potentially accessible for the allergen. The process is completed with the production of allergen specific IgE-antibodies (Figure 1.7).
Figure 1.7 – Allergic asthma pathophysiology representation of sensitization and
re-exposure44(CD- Cluster of Differentiation; IL- Interleukin; TCR- T-cell receptor ).
Allergen re-exposure makes the immune system react more agressively and in a rapid memory response way. The allergen connects to the allergen-specific IgE on mast cells that leads to the release of the previously formed mediators. Whenever a sufficient number of mast cell/basophil- bound IgE antibodies are bound to the allergen cell degranulation occurs, leading to the release of inflammation mediators such as histamine chemokines, lymphokines, eicosanoids, proinflammatory cytokines and growth factors is initiated in an intra-cellular signalling process. The TH2 lymphocyte is
very important in asthma pathogenesis as it produces cytokines involved in the initiation and maintenance of the inflammation cascade. Cytokines, such as interleukin (IL) 3, granulocyte macrophage colony-stimulating factor (GMC-SF) and IL-5, play a critical role in the differentiation, proliferation, survival and activation of eosinophils45.
12
are required for isotype switch to IgE. IL-1 and tumor necrosis factor alpha (TNF-α) are potent pro-inflammatory cytokines that are involved in the upregulation of adhesion molecules on vascular endothelium, an essential step in the migration of leukocytes to sites of inflammation48.
The response of the immune system is usually split in two phases: early and late phase reaction. Early phase reaction is the immediate hypersensitivity where the chemical mediators, as histamine, prostaglandins, leukotrienes and thromboxane, are released by mast cells producing characteristic allergic reaction responses. Some examples are edema, mucus secretion and sneezing in the respiratory tract, vasodilation in the nose and bronchoconstriction in the lung that leads to wheezing. In the late phase reaction, that usually occurs 4-6 hours after the early phase reaction, the continued allergic response leads to cellular infiltration, fibrin deposition and tissue destruction. This reaction increases bronchial reactivity, edema and extra inflammatory cell recruitment. Eosinophils, T lymphocytes and macrophages, as well as, the epithelial, endothelial and smooth muscle cells support the airway inflammation chronic symptoms. These cells are also thought to play an important role in the formaiton of inflammatory mediators like chemokines, cytokines, and leukotrienes44. IgE plays an
important tole in the response that the immune systems yields to allergens as it triggers mas cell mediator release that directs to early and late phase reactions49.
The role of oxidative stress in asthma pathogenesis is still in debate. Oxidative sress is observed on asthma patients and it may be derived from the inflammation or it may a contributory factor to asthma pathogenesis as several reports have been made on the role of oxidative stress in the immulogic diseases. ROS act as transfer stimulating signals as a critical intracellular second menssenger modulating immune responses. Oxidative stress increases airway inflammation as it induces pro-inflammatory mediators, which in its turn enhaces bronchial hyperresponsiveness, stimulates bronchspasm and increases mucus secretion. In fact, intracellular ROS, whenever NADPH oxidase activity occurs, increases temporarily in many types of cellular stimuli that include antigens, infections, chemical mediators and growth factors50,51.
Asthma metabolic disorders
13
metabolic signature would be different for differentiated conditions52. The asthma complexity is reflected in the myriad of biochemical pathways involved, as shown in Figure 1.8.
Figure 1.8 – Main altered biochemical pathways in asthma53.
Compounds and the inherent metabolic pathways have been identified, such as oxidative stress (that damages lipids, proteins and DNA), lactic acidosis, tricarboxylic acid (TCA) cycle, the amino acids and energy metabolisms.
Oxidative stress and lipid peroxidation (LPO) is a lipid metabolism dysfucntion
54 and asthma is characterized by sistemic and localized oxidative stress and subsequent
LPO. Inflammatory cells (activated eosinophils, neutrophils, macrophages and monocytes) and epithelial/smooth muscle cells can generate reactive oxygen species50. Free radicals reactive oxygen species (ROS) and reactive nitrogen species (RNS) are generated in the body by various endogenous systems, exposure to different physiochemical conditions or pathological states. A free radical can behave as an oxidant or reductant as they can accept or donate an electron from other molecules. Table 1.1 shows the three phases of the LPO mechanism
Altered Amino Acids Metabolism
Tryptophan Tyrosine Homocysteine 2-hydroxyisobutyrate Kynurenine
Altered Energy Metabolism
Altered Lipid Metabolism
14
Table 1.1 - LPO mechanism phases
Phase Description
1 Initiation: formation of free radicals
2 Propagation: free radical chain reactions
3 Termination: formation of non radical products
The initiation can begin in a single event that can convert hundreds of fatty acids into lipid hydroperoxides. The length of the propagation depends on many factors as the lipid-protein ratio, the fatty acid composition, oxygen concentration and the presence of antioxidants within the membrane that might interrupt the chain reaction55. Propagation
takes place by the reaction of lipid radical with a methylene group of a non-oxidized unsaturated fatty acid molecule to yield another lipid hydroperoxide and another fatty acid radical, which can react with oxygen to start a chain reaction56. These reactions occur until termination that occurs when there is a combination of two radicals forming a non radical product or by the presence of hydrogen or electron donor57. Some
examples of important oxygen-containing free radicals in several disease states are for example superoxide anion, hydroxyl, hydrogen peroxide and peroxynitrite. Free radical formation occurs continuously in the cells as a consequence of both enzymatic and non-enzymatic reactions. Figure 1.9 shows the link of allergens and ROS in asthma.
Figure 1.9 – Allergens and reactive oxygen species linked in asthma58 (DEP- Diesel Exhaust
15
If an imbalance between the free radicals and the antioxidant defenses is observed, a condition known as oxidative stress arises. Free radicals alter lipids, proteins and DNA and are known to generate a number of human diseases. Oxidative stress is thought to have a role in the development of human diseases such as cancer, cardiovascular disorders and immunologic diseases59.
Lipid metabolism is also affected by asthma pathology as shown in the reports by Ho53, Saude et al.77 and Jung et al.81 (Table 1.2). Lipid metabolism has shown to
contribute to asthma pathophysiology in childhood60.
Table 1.2 - Lipid Metabolism related compounds by Nuclear Magnetic Ressonance
Author Compound ↑↑ ↑↑ Biofluid
Jung et al.81 methionine Asthma Serum
choline Healthy
Saude et al.77 carninitine Asthma Urine
O-acetylcarnitine Asthma
The latter author has demonstrated that there is a strong and direct influence of metabolic pathways on the immune mechanisms. Saude et al.77 has described that the
urinary levels of carnitine are high in asthma patients with unstable status. This compound has a role in oxidative metabolism in mitochondrial and hypoxemic stress. The identified compounds in lipid metabolism pathways are identified in Table 1.1.
Oxidative stress has been proven to affect smooth muscle contraction, induce airway hyperresponsiveness and increase mucus secretion and epithelial shedding within respiratory cells. Excessive ROS production in asthma can trigger key enzymatic and non-enzymatic reactions, leading to an antioxidant-oxidant imbalance in respiratory airways which promotes state of oxidative stress in asthma61.
There is evidence that free radicals are influential components of the molecular mechanisms involved in the pathogenesis of asthma, namely airway inflammation, and determinant of asthma severity61. Inflammatory cells and resident cells (epithelial and
smooth muscle cells) can generate ROS that can attack proteins to form carbonyls and react with nitrogen species and tyrosine to form nitrotyrosine. It has been shown that nitrotyrosine formation is increased after allergen exposure50. ROS also reacts with lipids to release isoprostane. 8-isoprostane has been reported to be elevated in the exhaled breath condensate of asthma patients62. ROS excess production also correlates
-16
when an asthma attack occurs being high at the sites of antigen challenge that persists through the late asthmatic phase63. NO also plays an important role in asthma. There is evidence that the autoxidation of NO results in nitrite, which is a substrate for eosinophil peroxidase and myeloperoxidase64. NO reacts with superoxide that yields
ONOO- and consequently can nitrate tyrosine residues and damage enzymes, structural
and functional proteins65. ROS production by neutrophils also correlates with asthma severity as demonstrated by the levels of 3-bromotyrosine, a product of eosinophil peroxidase and eosinophil, which was 3 times higher in the bronchoalveolar lavage fluid in individuals with asthma when compared with control subjects66.
Beside the previously identified compounds, volatile organic compounds (VOCs) have also been associated with asthma (Figure 1.10).
17
VOCs are generated during pulmonary physiologic and pathologic processes, such as LPO and inflammation68. The production of secondary compounds constitutes a minor degradation pathway and they comprise an array of chemical families, from aldehydes, ketones and alkanes with the latter being more stable not reacting with proteins. Dallinga et al.69 and Ibrahim et al.70 have reported C13 alkanes in the
characterization of asthmatic population through exhaled breath (Table 1.3). Although the mechanism by which these alkanes are formed (namely, ramified alkanes) is still not well understood there are been reports on the volatile composition of lung cancer cell lines where these metabolites have an important role71.
Table 1.3 - Oxidative stress and LPO secondary compounds in asthma studies analysing exhaled breath
by GC-MS
Author Compound
Dallinga et al.69
(branched) hydrocarbon (C13H28)
(branched) hydrocarbon (C13H28)
unsaturated hydrocarbon (C15H26)
(branched) hydrocarbon (C11H24)
Ibrahim et al.70 2,6,11-trimethyl-dodecane
(branched) hydrocarbon (C13H28)
Increased ROS is known to damage DNA, lipids, proteins and carbohydrates affecting cellular functions and increase inflammation (Figure 1.11).
Figure 1.11 – Possibilities of the damage caused by ROS 72.
The oxidative damage to DNA is known to affect nuclear or mitochondrial DNA leading to mutation, gene expression changes73. For example, it has been shown that hydrogen peroxide induces DNA strand breaks in airway epithelial cells that leads to modifications in the epithelial cell-specific gene expression74. DNA strand breaks also showed to influence type 2 alveolar epithelial cells and shows a relationship to the development of lung disease73 (Figure 1.12).
Cell membrane
damage
Mitochondria
18
Figure 1.12– Reactive oxygen species damage nuclear and mitochondrial DNA75.
ROS’s protein modification affects their biological function that in several occasions are important to initiate and maintain inflammation. An example is the loss of antioxidant capacity of the superoxide dismutases known to catalyze superoxide to hydrogen peroxide and subsequently to water. Moreover, inflammatory cells can secrete enzymes that damages oxidatively the protein by producing reactive brominating, chlorinating and nitrogen species76.
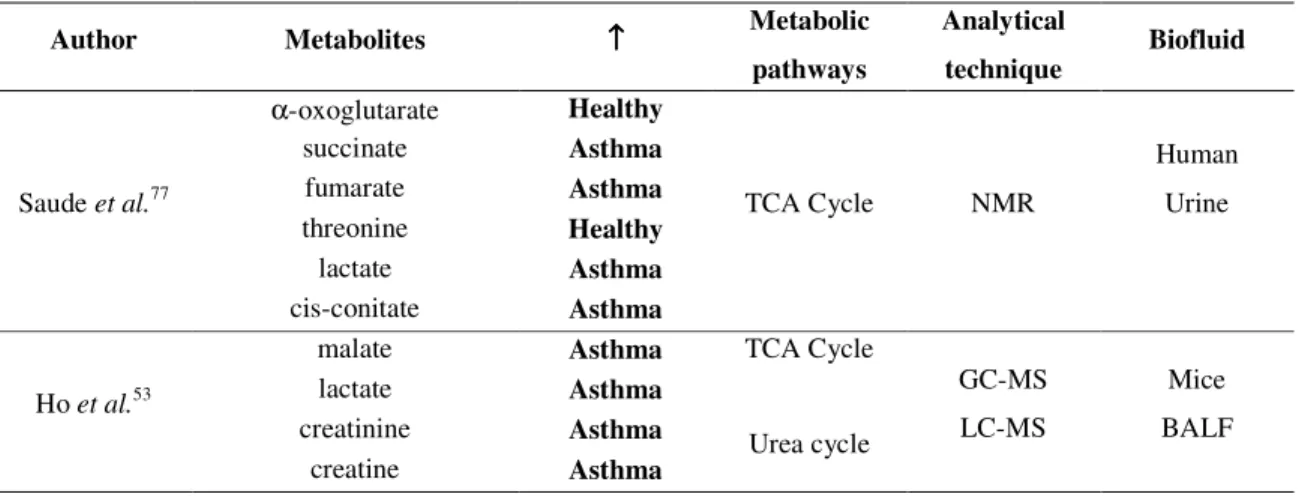
Other metabolic pathways are affected by asthma like the TCA and urea cycles. The TCA cycle is the central metabolic hub of the cell, which is the final common pathway for the oxidation of amino acids, fatty acids and carbohydrates. It is a fundamental metabolic pathway for energy production through aerobic respiration that takes place in the mitochondria. Saude et al.77 analyzed human urine from asthmatic
individuals using proton nuclear magnetic resonance (1H-NMR) and found compounds
related to the TCA that were critical for the discrimination attained between healthy individuals, outpatient asthmatics and even asthmatics from emergency department. Ho
et al.53 studied in sensitized mice BALF that also identified compounds that are related
to the TCA cycle.
19
and creatinine mice BALF that are energy metabolism related compounds. The behavior of these energy-related compounds may be explained by an increased burden and subsequent demand of a higher energy intake by the inflammatory cells. Higher levels of lactate are a consequence of poor oxygenation (hypoxia), in which the mitochondria are unable to produce adenosine triphosphate in a sufficient rate to supply the cell. Subsequently, glycolysis is increased and the pyruvate excess is converted in lactate that is released to the bloodstream. For example, lactate was also found to be elevated in patients with lung cancer78. Malate is a TCA cycle intermediate and there are no reports that describe this compound to be altered in asthma or any lung related pathology with the exception of Ho et al.53. Nevertheless, other intermediates of the TCA cycle
succinate, fumarate and cis-aconitate, have been reported by Saude et al.77 to be altered
in asthmatics which supports the evidence that TCA cycle is affected by this pathology. Creatine takes part in the energy supply to muscles, as for example airway smooth muscles79 and as shown by Saude et al.77 the levels of this compound is increased in the
asthmatic patients. This behavior is also attributed to the increased respiratory burden77.
Creatinine is a downstream compound of creatine, and according to Ho et al.53, it has
higher values in sensitized mice which corroborate the hypothesis of the promotion of energy metabolism, but by the urea cycle. The information is compiled in Table 1.4.
Pyruvate is an end product of glycolysis and is converted to acetyl CoA involved in the TCA cycle80. Pyruvate has been identified in asthmatic sera81, nevertheless there is no reference of asthma influencing this particular compound but compounds that arise from different pathways have been reported. Lactate levels were increased in the sera of asthma patients81, as well as, in urine77.
Table 1.4 - Energy metabolism affected by asthma
Author Metabolites ↑↑↑↑ Metabolic
pathways
Analytical
technique Biofluid
Saude et al.77
α-oxoglutarate Healthy
TCA Cycle NMR
Human Urine succinate Asthma
fumarate Asthma
threonine Healthy
lactate Asthma
cis-conitate Asthma
Ho et al.53
malate Asthma TCA Cycle
GC-MS LC-MS
Mice BALF lactate Asthma
creatinine Asthma Urea cycle