Marco Filipe Ganança Vieira
MASTER IN INFORMATICS ENGINEERING
September
| 2012
Interactive Music V
isualization – Implementation,
Realization and Evaluation
Marco Filipe Ganança Vieira
DM
Interactive Music Visualization – Implementation,
Realization and Evaluation
MASTER DISSERTATION
DIMENSÕES: 45 X 29,7 cm
PAPEL: COUCHÊ MATE 350 GRAMAS
IMPRESSÃO: 4 CORES (CMYK)
ACABAMENTO: LAMINAÇÃO MATE
NOTA*
Caso a lombada tenha um tamanho inferior a 2 cm de largura, o logótipo institucional da UMa terá de rodar 90º ,
para que não perca a sua legibilidade|identidade.
Caso a lombada tenha menos de 1,5 cm até 0,7 cm de largura o laoyut da mesma passa a ser aquele que consta
Nome do Projecto/Relatório/Dissertação de Mestrado e/ou T
ese de Doutoramento |
Nome
do
Autor
ORIENTAÇÃO
Mon-Chu Chen
Marco Filipe Ganança Vieira
MASTER IN INFORMATICS ENGINEERING
Interactive Music Visualization – Implementation,
Realization and Evaluation
Abstract
This thesis describes all process of the development of music visualization, starting with the implementation, followed by realization and then evaluation.
The main goal is to have to knowledge of how the audience live performance experience can be enhanced through music visualization. With music visualization is possible to give a better understanding about the music feelings constructing an intensive atmosphere in the live music performance, which enhances the connection between the live music and the audience through visuals. These visuals have to be related to the live music, furthermore has to quickly respond to live music changes and introduce novelty into the visuals. The mapping between music and visuals is the focus of this project, in order to improve the relationship between the live performance and the spectators. The implementation of music visualization is based on the translation of music into graphic visualizations, therefore at the beginning the project was based on the existent works. Later on, it was decided to introduce new ways of conveying music into visuals.
Several attempts were made in order to discover the most efficient mapping between music and visualization so people can fully connect with the performance. Throughout this project, those attempts resulted in several music visualizations created for four live music performances, afterwards it was produced an online survey to evaluate those live performances with music visualization.
In the end, all conclusions are presented based on the results of the online survey, and also is explained which music elements should be depicted in the visuals, plus how those visuals should respond to the selected music elements.
Abstracto
Esta tese descreve todo o processo de desenvolvimento de visualização musical, iniciando com a implementação, seguido pela realização e posteriormente avaliação.
O objectivo principal é obter o conhecimento de como a experiência da audiência de uma performance ao vivo pode ser melhorada através de visualização musical. Com visualização musical é possível dar uma melhor compreensão sobre os sentimentos da música construindo uma atmosfera intensa na performance musical ao vivo, a qual aperfeiçoa a conecção entre a música ao vivo e a audiência através dos visuais. Estes visuais têm que estar relacionados com a música ao vivo, para além disso têm que responder rapidamente às mudanças da música e introduzir novidade aos visuais. O mapeamento entre a música e os visuais é o foco deste projecto, podendo assim melhorar a relação entre a performance ao vivo e os espectadores. A implementação de visualização musical é baseada na tradução de música para visualizações gráficas, portanto no início o projecto foi baseado em trabalhos existentes. Mais tarde, foi decidido introduzir novas formas de transmitir música pelos visuais.
Várias tentativas foram realizadas para poder descobrir o mapeamento mais eficiente entre música e visualização para que as pessoas possam conectar-‐se totalmente à performance. Durante este projecto, estas tentativas resultaram em várias visualizações musicais criadas para quatro performances musicais, depois foi produzido um questionário online para avaliar essas performances ao vivo com visualizações musicais.
No fim, todas as conclusões são apresentadas baseadas nos resultados do questionário online, também é explicado quais são os elementos musicais que devem ser retratados nos visuais, e ainda como esses visuais devem responder aos elementos musicais selecionados.
Acknowledgments
In the first place I want to express my gratitude and appreciation for my thesis advisor, Dr. Mon-‐Chu Chen, for all the teaching, support and patience throughout the development of this thesis.
Secondly, I would also like to thank my family, specially my parents, godmother, and grandmother for all care, understanding and support during this period of my masters’ degree.
Table of Contents
ABSTRACT ... III
ABSTRACTO ... V
ACKNOWLEDGMENTS ... VII
FIGURES ... XI
TABLES ... XV
1. INTRODUCTION ... 1
1.1. GOALS AND MOTIVATION ... 2
1.2. CONTRIBUTION ... 3
1.3. SYNOPSIS ... 4
2. LITERATURE REVIEW ... 6
2.1. MUSIC VISUALIZATION ... 6
2.1.1. Objectives with performance visualization ... 8
2.1.2. Related Work ... 8
2.1.2.1. ANIMUS ... 9
2.1.2.2. Interactive Music Visualization ... 10
2.1.2.3. Comp-‐i ... 11
2.1.2.4. Visual and Aural-‐ Visualization of Harmony in Music with Colour ... 11
2.1.2.5. Emotion-‐based music visualization using photos ... 12
2.1.2.6. MuSA.RT ... 13
2.1.2.7. Visualizing Music ... 13
2.1.2.8. Visualization of Concurrent Tones in Music with Colours ... 14
2.1.2.9. Movie from Music: Visualizing musical compositions ... 15
2.1.2.10. Visualization of Music Performance as an Aid to Listener’s Comprehension ... 16
2.1.2.11. Towards Building an Experiential Music Visualizer ... 17
2.1.2.12. A Visualization of Music ... 18
2.2. AVAILABLE TECHNOLOGIES ... 19
2.2.1. Non-‐interactive Technologies ... 20
2.2.2. Interactive Technologies ... 21
2.3. QUARTZ COMPOSER ... 25
2.3.1. Compositions ... 25
2.3.2. Patches ... 26
2.3.3. Programing Patches ... 34
2.3.4. Coordinate System ... 36
2.3.6. User Interface ... 40
2.3.7. Building Custom Patches ... 42
2.4. GENERAL DISCUSSION ... 44
3. MUSIC BASIC STRUCTURE ... 48
3.1. DYNAMICS ... 48
3.2. TONALITY ... 48
3.3. TIMBRE ... 49
3.4. TEMPO AND DURATION ... 49
3.5. PITCH ... 49
4. METHODOLOGY ... 52
4.1. MUSIC MAPPING INTO VISUALIZATION ... 52
4.2. IMPLEMENTATION ... 53
4.2.1. Software ... 54
4.2.2. Hardware ... 55
4.2.3. Visualizations ... 55
Pitch detector ... 56
Major Detector ... 57
Mapping Function ... 57
Video Mapping ... 58
Visualizations examples ... 61
5. LIVE PERFORMANCES WITH MUSIC VISUALIZATION ... 71
5.1. LIVE MUSIC PERFORMANCE 1 ... 71
5.2. LIVE MUSIC PERFORMANCE 2 ... 72
5.3. LIVE MUSIC VISUALIZATION 3 ... 74
5.4. LIVE MUSIC VISUALIZATION 4 ... 75
6. RESULTS/ DISCUSSION ... 77
6.1. FIRST GOAL ... 78
6.2. SECOND GOAL ... 81
6.3. THIRD GOAL ... 86
7. CONCLUSION ... 88
BIBLIOGRAPHY ... 93
Figures
Figure 1 – First Live Performance with Music Visualization done by the author of this
thesis ... 7
Figure 2 -‐ User interacting with virtual character (Taylor, Boulanger, Torres, 2005) ... 9
Figure 3 -‐ System Particle with different parameters (Kubelka, 2000) ... 10
Figure 4 -‐ C Major Tone ... 11
Figure 5 -‐ Visualization Tchaikovsky's Walts of Flowers (Klemenc, Ciuha, Subelj, 2011) ... 11
Figure 6 -‐ Visualization of Prokofiev's Toccata in D minor (Klemenc, Ciuha, Subelj, 2011) ... 12
Figure 7 -‐ Sample images of the different existing categories (Chen, Weng, Jeng, Chuang, 2008) ... 12
Figure 8 -‐ MuSA.RT (Music on the Spiral Array Real-‐Time) system (Chew, Franc, 2003) ... 13
Figure 9 -‐ Lillie's music visualization program (Lillie, 2008) ... 14
Figure 10 -‐ Color association to musical tones (Ciuha, Klemenc, Solina, 2010) ... 14
Figure 11 -‐ Excerpt from Pachelbel's Canon in D Major (Ciuha, Klemenc, Solina, 2010) 15
Figure 12 -‐ Excerpt from Debussy's Clair de Lune (Ciuha, Klemenc, Solina, 2010) ... 15
Figure 13 -‐ Scale of blue violet (Herman, Badler, 1979) ... 16
Figure 14 -‐ Visualization for a two voices chant (Herman, Badler, 1979) ... 16
Figure 15 -‐ Rectangular format (Herman, Badler, 1979) ... 16
Figure 16 -‐ Explanatory figure of music visualization (Hiraga, Matsuda, 2004) ... 17
Figure 17 -‐ Audio-‐visual mapping of different instruments (Nanayakkara, Taylor, Wyse, Ong, 2007) ... 18
Figure 18 -‐ Sample output of the experiential music visualizer (Nanayakkara, Taylor, Wyse, Ong, 2007) ... 18
Figure 19 -‐ iTunes visualizer ... 20
Figure 20 -‐ Adobe After Effects Software with the main panels ... 21
Figure 21 -‐ VDMX software (DownloadAtoZ, 2011) ... 22
Figure 22 -‐ Resolume Avenue software (vBulletin Solutions Inc., 2011) ... 23
Figure 23 -‐ Max/MSP software sample ... 24
Figure 24 -‐ PD software example ... 25
Figure 26 -‐ Quartz Composer Patches ... 27
Figure 27 -‐ Patch Creator ... 28
Figure 28 -‐ Sample with a composite patch (Source Over) ... 28
Figure 29 -‐ Mouse Patch is a Controller Patch ... 29
Figure 30 -‐ Environment Patch ... 29
Figure 31 -‐ Filter Patch (Pixellate) ... 30
Figure 32 -‐ Generator Patch (Checkerboard) ... 30
Figure 33 -‐ Gradient Patch (Gaussian Gradient) ... 30
Figure 34 -‐ Numeric Patch (Mathematical Expression) ... 31
Figure 35 -‐ Plugin Patch (_1024_GL_Circle) ... 31
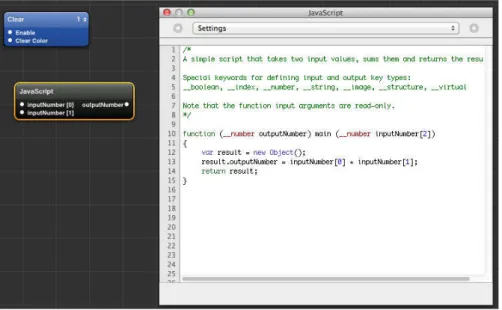
Figure 36 -‐ JavaScript Patch (Programming Patch) ... 32
Figure 37 -‐ Render Patch (Cube) ... 32
Figure 38 -‐ Source Patch (Directory Scanner) ... 33
Figure 39 -‐ Quartz Composer Patch Hierarchy ... 33
Figure 40 -‐ Quartz Composer Evaluation Order ... 34
Figure 41 -‐ Core Image Filter Patch ... 34
Figure 42 -‐ GLSL Shader Patch ... 35
Figure 43 -‐ JavaScript Patch ... 35
Figure 44 -‐ Quartz Composer Coordinate System ... 36
Figure 45 -‐ Available Quartz Composer Templates ... 37
Figure 46 -‐ Basic Composition Template ... 37
Figure 47 -‐ Graphic Animation Template ... 38
Figure 48 -‐ Graphic Transition Template ... 38
Figure 49 -‐ Image Filter Template ... 39
Figure 50 -‐ Music Visualizer Template ... 39
Figure 51 -‐ Quartz Composer Editor Window ... 40
Figure 52 -‐ Quartz Composer Viewer Window ... 40
Figure 53 -‐ Patch Parameter Pane ... 41
Figure 54 -‐ Patch Inspector ... 42
Figure 55 -‐ Available options on the patch inspector (red rectangle) ... 42
Figure 56 -‐ .h file for Quartz Composer plugin ... 43
Figure 57 -‐ attributes method ... 43
Figure 58 -‐ attributesForPropertyPortWithKey method ... 43
Figure 59 -‐ executionMode method ... 44
Figure 60 -‐ timeMode method ... 44
Figure 62 -‐ Fiddle patch from Pure Data ... 56
Figure 63 -‐ Primary Frequency patch from Quartz Composer (red rectangle) ... 56
Figure 64 -‐ Formula used to convert frequency to MIDI value ... 57
Figure 65 -‐ Formula to convert from a scale to another ... 58
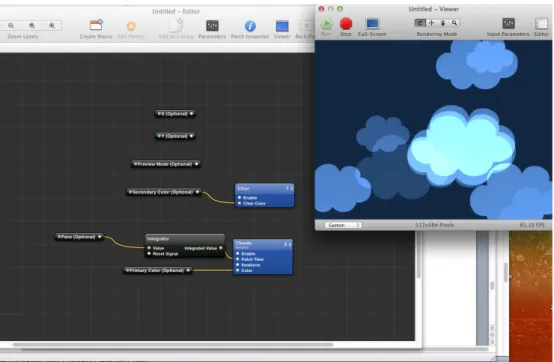
Figure 66 -‐ Quartz Composer file to setup the video mapping ... 59
Figure 67 -‐ Viewer window of the setting up the video mapping QC file ... 59
Figure 68 -‐ QC file which loads the corners coordinates saved for the video mapping ... 60
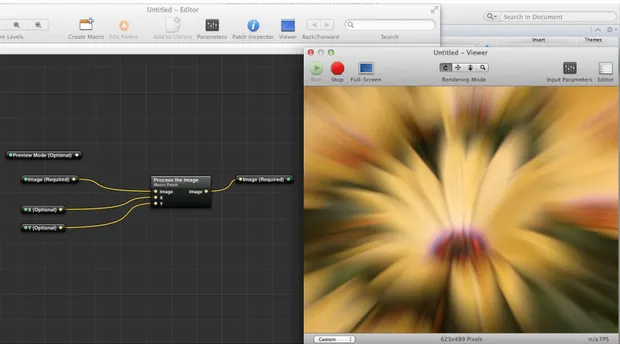
Figure 69 -‐ Perspectives Points Macro patch with the image parameter published as Animation ... 60
Figure 70 -‐ Visualization Example from the first live performance ... 61
Figure 71 -‐ Visualization Example from the first live performance ... 62
Figure 72 -‐ Visualization Example from the first live performance ... 62
Figure 73 -‐ Visualization Example from the second live performance ... 63
Figure 74 -‐ Visualization Example from the second live performance ... 63
Figure 75 -‐ Visualization Example from the second live performance ... 64
Figure 76 -‐ Visualization Example from the third live performance ... 65
Figure 77 -‐ Visualization Example from the third live performance ... 65
Figure 78 -‐ Visualization Example from the third live performance ... 66
Figure 79 -‐ Visualization Example from the third live performance ... 66
Figure 80 -‐ Visualization Example from the third live performance ... 67
Figure 81 -‐ Visualization Example from the third live performance ... 68
Figure 82 -‐ Visualization Example from the fourth live performance ... 68
Figure 83 -‐ Visualization Example from the fourth live performance ... 69
Figure 84 -‐ Visualization Example from the fourth live performance ... 69
Figure 85 -‐ Visualization Example from the fourth live performance ... 70
Figure 86 -‐ Live Music Concert with Music Visualization ... 72
Figure 87 -‐ Live Music Performance with Music Visualization ... 74
Figure 88 – Musical Drama with Music Visualization ... 75
Figure 89 -‐ Kettle file for the first goal ... 79
Figure 90 – Feelings of people with music background ... 81
Figure 91 – Feelings of people without music background ... 81
Figure 92 -‐ Chart, which represents the answer to question 5 for people with music background ... 83
Figure 94 -‐ Chart, which represents the answer for question 6 for people with music background ... 85
Figure 95 -‐ Chart, which represents the answer for question 6 for people without music background ... 85
Figure 96 -‐ Visuals Ratings of people with design experience (left) and without design experience (right) ... 87
Tables
Table 1 – Phase 1 of music mapping into visual ... 52
Table 2 -‐ Second phase of music mapping into visualization ... 52
1. Introduction
Music is a unique form of expression due to all its special characteristics. These characteristics are what make music so special, because they are constantly changing, growing with different levels of intensity as it develops over time. This artistic form of expression can also inspire emotions, in other words music composers/ musicians can express their feelings through music, which then becomes a source of inspiration for other musicians or even people who carefully listens to music. Additionally, those special characteristics mentioned before, are the several elements existent in the music structure itself, which is understood only by proficiency people in music (Klemenc, Ciuha, Subelj, 2011). The music structure elements is what makes it so intensive and emotional, this means that music artists use those elements in order to express their feelings through their music. Music is so interesting because is constantly changing and growing over time and has different levels of intensity as it develops due to the previous stated elements.
When people listen to music, they sometimes create a mental model of the specific music piece that they are listening to. That mental model represents the message and/or feelings of the person at that moment of listening the piece, which sometimes are highly related to their personal life experience. These mental models can be different for each person, because an individual has their way of seeing and feeling things. This is why a music piece sometimes has a vast number of unique interpretations for the same music piece. Everyone has their own life experiences and influences, as well as culture, therefore, everybody have different opinion when listening to a music piece.
A live performance exalts different characteristics of music, because they become so evident as the audience can experience different levels of emotional intensity existent in a live performance. In consequence the audience navigates through a parallel world produced by inherent emotions resulting of the different music pieces. Moreover, with a music live performance, there is the possibility of providing a series of stimulating reasons, which provokes significant moments intrinsic to the listener’s live experiences.
between live music and the mental world created by the audience. Visualizations in a live music concert should expand, enhance and re-‐represent music elements such as volume, pitch, timbre, etc. in real-‐time. These elements can be conveyed in visuals, creating a relationship between the live music and the visuals. The computer “listens” the music and then triggers different visuals reacting accordingly to what it is listening at the moment, thus people can “see” music (Hiraga, Watanabe, Fujishiro, 2002), which is good for those people who can’t hear. It helps them giving a perception and comprehension of what kind of music it is through the visualization.
These elements can illustrate how a composer developed his or her ideas in a piece of music, and how they are important elements that should be considered when listening to music. In a piece of music, the audience should be able to understand how integral thematic elements are to a music composition, but how they influence the visual design process of music visualization? Can themes in music successfully transfer to the visual animation? The work documented in this thesis explores some of the possibilities by combining computer animation as a visual extension to a live music performance.
Musical and visual explorations expand the boundaries of a computer as a content creation tool to elevate the computer as a visual instrument for the artist for the execution of the real live graphic animations. During the live performance, the system unites the computer and the artist. The computer becomes a visual instrument for the artist to play and its visualizations reacts to live music performance (Bain, 2008).
1.1. Goals and Motivation
The objective of this project is to find the best mapping between music and visualization. This connection between music and visuals is created by the union of technology and music. This is a very interesting merger which may improve the spectators live music performance experience. This It is believed, that if the audience of a live performance with music visualization can understand music elements through the visuals, then they can have a better understanding of the feelings of the music piece and enhance their live performance experience.
moment with music visualization because it helps them to create a mental model of the music, thus they understand it better and also make it more interesting. This is the main goal for this project, enhance the audience live performance experience using music visualization. They should become emotionally more involved with music. Music visualization is that complement for those people who struggle to understand a certain music piece or have difficulty to connect to a certain kind of music, making them feeling or imagining something when listening to it.
The basis for the achievement of this objective is having a good mapping between music elements (pitch, volume, tonality, etc.) and the visual. Moreover, the design of the visuals should be really good and consistent with the particular music piece.Throughout the development of this project, will be tested several mapping functions in order to know what are the best options and in the end, there will be a survey so we can know the feedback from the project and evaluate it.
1.2. Contribution
The main contribution of this project is the mapping function between music elements and visualizations. In this project, it will be tested several mappings such as: pitch – location, pitch – color, etc. According to all research, all mapping functions used were never evaluated and proved that they were really effective for music visualization. This is the reason why it is decided to try different approaches to depict music through visuals and then make an evaluation in order to know if the best way to convey music through visualizations.
This mapping function between music and visuals is important, because as it was explained before, musicians express their feelings through music. And using music elements they can express any kind of feeling they want to. These elements is what makes each music piece unique with their own feelings, so the visuals should be consistent and show these music elements in a way that people can feel the same when they listen the music without visuals. If there is no mapping between music and the graphic animations, then the graphic animation might not be coherent with music, resulting in a visual unfaithful to the message of certain music.
1.3. Synopsis
The thesis structure is organized in seven sections. In this section will be explained how each section is organized and what contains. The first one is the introduction of the theme music visualization, and what is envisioned to do in this project.
The second section is the literature review, where is explained and mentioned all related work. All bibliography used for this thesis is described in this section, besides that is also explained why they are important for this project, as well as their contribution for this thesis. The consulted references are divided in Music Visualization (section 2.1), Available Technologies (section 2.2), and Quartz Composer (2.3).
Then in section three, is defended the music elements decided to use for the mapping between music and visualization. It is explicated the music elements such as tonality, volume, so the reader without music feedback can understand everything that is described in this thesis.
In section four is explained the methodology for this project. As it was mentioned before, the methodology thought for this project is to find the best relationship between music and visuals therefore the audience in a live performance can evolve into a more intensive level of music perception highlighting its underlying feelings. So, in this section, it is developed the music mapping into visualization, and how it changed during this project. After that, the implementation is explicated in terms of software (section 4.2.1), hardware (section 4.2.2) and finally visualizations (section 4.2.3).
In section six is presented the results from the online survey about all these music visualizations live performances, where is also presented charts with the intention of proving the hypotheses formulated in this section for this thematic. The results of the survey are discussed, and conclusions are also presented.
2. Literature Review
2.1. Music Visualization
In the current days, music is intertwined in almost everyone’s life, mainly because it helps them to express themselves (mostly through the audible sense), but sometimes it is also possible to relate to music by visual means (Isaacson, 2005). Music visualization is a feature found in media player visualizers’ software such as Windows Media Player, or iTunes, etc. This feature exhibits animated imagery based on music. The imagery normally is rendered in real time and synchronized with the music, which is being played.
Music has been combined with visualizations for a long time, especially in artistic areas, such as: Operas, ballets, musical dramas and movies (e.g.: Fantasia by Walt Disney). There is a better comprehension of the performance expression when the audience of a musical performance can visualize it (Hiraga, Watanabe, Fujishiro, 2002). The reason why is necessary this correlation between the auditory and visual senses, is due to the complicated structure of music for those who aren’t specialist. Therefore, music visualization is a feature, which helps the audience understanding those complex music structures, such as the music feelings and purposes (Klemenc, Ciuha, Subelj, 2011). It’s necessary to find characteristics of music with some analysis methods in order to know which information should be shown on the visualized figures for expressive performance (Hiraga, Mizaki, Fujishiro, 2002).
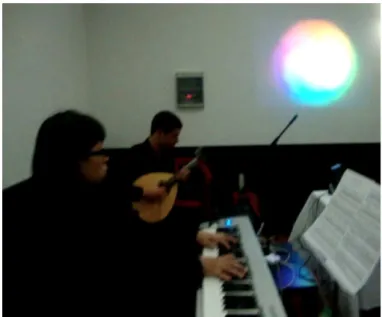
Figure 1 – First Live Performance with Music Visualization done by the author of this thesis
Music can be a “physical object”, which the audience can examine it and analyze it at any time, when the audience of a performance is able to "watch" music through pictures or images or some kind of visualizations (Isaacson, 2005), like in figure 1. In other words, when the audience can visualize, is easier to explore music than just listening. Then, the visualizations take people’s experience of viewing a performance to another dimension, where they have other idea and thought about the musical piece that they are listening. Those visualizations could be pictures, visual effects, it is something visual that is associated with the music and it responds accordingly to the music changes (mood, or exposed feelings). People should feel something when they listen to music, these visualizations, makes it simpler, and thus, people comprehend the implicit emotion of the music.
music is low, then the size of the objects in the visualization should be smaller, otherwise, should be bigger.
2.1.1. Objectives with performance visualization
With music visualization it is pretended to achieve several goals that are capable of enhancing the audience live performance experiences. Therefore, the main focus is the understanding of musical intention of performances (Hiraga, Mizaki, Fujishiro, 2002). The musical intention of performances can be understand by the mood of the music. Mood is an important characteristic to be presented in visual performances in order to give the desired atmosphere. The significance of these moods is how people can access and understand performance data that is considered as subjective (Hiraga, Mizaki, Fujishiro, 2002).
Moreover, people should be able to compare their thoughts of live music visualization performances against simple live music performances (without visualization) among them. Furthermore the sharing of the understanding of both kinds of performances should also involve the players (musicians) in order to have an opinion of a skilled person in music. In other words, sharing thoughts about this experience helps people to understand what they are feeling, and if these feelings are common to everybody or not. Thus, the process of understanding the music intentions might be easier and also helps improving the project in accordance with the audience criticism.
2.1.2. Related Work
There are a big number of projects about this theme. In this section, it is referred some of those projects. These existing projects helped making some decisions about this thesis, consequently the project is based on those previous works in order to take advantages of the work already done and studied, thus the goal of this thesis can be achieved with quality.
2.1.2.1. ANIMUS
This application enables the interaction between a live musician and a responsive virtual character, and it responds according to the music it “hears” (see figure 2). This character visualizes the perception and cognition of musical input by exhibiting responsive behavior expressed through animation.
Figure 2 -‐ User interacting with virtual character (Taylor, Boulanger, Torres, 2005)
This application is influenced by Cooke’s work (Cooke, 1963), which talks about the feelings that are embedded in music. Those feelings are inherent to music, it isn’t a technical part of music, but something more elusive. Cooke used western tonal music as reference for his work, and he makes hypotheses concerning the relationships between musical structures and composers’ emotional intent. Through Cooke’s work (Cooke, 1963), they decided to give a visual response according to the music emotions with a life-‐sized virtual character called ANIMUS. ANIMUS is capable of perceiving musical input and to encode it in a way consistent with previously defined organizational models for tonal music. Therefore, there is a cognition mechanism related to the musical-‐theoretical features to emotional states consistent with Cooke’s findings, simulating an emotional understanding of the music it “hears” (Taylor, Boulanger, Torres, 2005).
2.1.2.2. Interactive Music Visualization
This application consists of three parts: sound analyzer; visualization mode; scene editor. The sound analyzer consists in an evaluation of some characteristics of each audio file input for 1/25 sec. such as: volume, balance (stereo position), dominant (solo), instrument position (melody), tempo (music rate), and music mood. Currently just volume and balance are implemented (Kubelka, 2000).
The Visualization mode offers two modes of rendering the objects from the scene editor (real-‐time mode and full-‐rendering mode). Those modes are: Real-‐time mode (The scene is rendered simultaneously with the playback of the sound record from de audio file; and Full-‐rendering mode (All animation is rendered frame by frame and resulted images are saved on a disc).
Finally, the scene editor is defined before the visualization starts, composed by specific author requirements and is changed according to the data created by the sound analyzer. It was used basic geometric objects (sphere, cube), which reacted with the music and their size, position, orientation and color would change. It was also used a particle system, and colored background (suitable for expressing lightning, dawn or dusk). The particle system (see figure 3) is good for the music visualization, because it is possible to express the dynamics (motion of particles) and the mood (through color) of the music (Kubelka, 2000).
Figure 3 -‐ System Particle with different parameters (Kubelka, 2000)
2.1.2.3. Comp-‐i
One of the first things to do in music visualization is to visualize the items of musical sense along music perception, for e.g., articulation, tempo, and dynamic change. They designed and implemented an application named “comp-‐i” to provide a 3D virtual space where users can perform visual information (Hiraga, Mizaki, Fujishiro, 2002). This application has three parameters, which are pitch, volume and tempo that are encoded as color saturation, diameter, and height of each cylinder (corresponds to a single note sound).
2.1.2.4. Visual and Aural-‐ Visualization of Harmony in Music with Colour
In this project, they try to associate colors to musical tones instead of associating to individual pitches. Musical tones are comprised of three pitches with a certain interval between them. That different interval between pitches is what defines the music tonality. In figure 4, we can see the C Major tone, which is comprised by the three pitches C, E and G. Every tone is comprised by its specific three pitches (Klemenc, Ciuha, Subelj, 2011).
Figure 4 -‐ C Major Tone
These tones can be major or minor, and normally, the major tones are associated to a more happy or moved musical piece (see figure 5), otherwise, it's related to a sad piece, which transmits sad or tragic feelings (see figure 6). So, for the major tones, they have saturated colors, in the other hand, for the minor tones, they have colors with low saturation (Klemenc, Ciuha, Subelj, 2011).
Figure 5 -‐ Visualization Tchaikovsky's Walts of Flowers (Klemenc, Ciuha, Subelj, 2011)
Figure 6 -‐ Visualization of Prokofiev's Toccata in D minor (Klemenc, Ciuha, Subelj, 2011)
2.1.2.5. Emotion-‐based music visualization using photos
The goal of this project is to provide an emotion-‐based music player. This music player synchronizes photos with music based on its emotions. Several kinds of media (e.g.: music, photos) make people have different feelings, from sadness to happiness. The integration of these several media type can make a more touching presentation, as long as they are synchronized in emotions. By coordinating emotions in both auditory and visual contents, emotional expression in enhanced and user's listening experience is enriched (Chen, Weng, Jeng, Chuang, 2008). Based on theses facts, they decided to build a system to combine these two senses (visual and auditory). The inputs of their system are a song and a set of photos. The first step is extracting the emotion category from the music input and photos. They have eight categories: sublime, sad, touching, easy, light, happy, exciting and grand (see figure 7).
Figure 7 -‐ Sample images of the different existing categories (Chen, Weng, Jeng, Chuang, 2008)
2.1.2.6. MuSA.RT
MuSA.RT (Music on the Spiral Array Real-‐Time) is a system, which analyses music, and it’s used for interactive music visualization through a real-‐time MIDI input, the live performance is processed, analyzed and mapped to a 3D model, revealing musical tonal structures such as pitches, chords, and keys (Chew, Franc, 2003). It is an interactive system for music analysis and visualization using the Spiral Array model (see figure 8). An expert listener is able to ascertain the keys and harmonic patterns when they listen to music. This process is difficult for novices, and the solution is providing visual cues such as geometric model (Chew, Franc, 2003).
This system provides a generic platform for testing and validating algorithms for real-‐time music tracking. A few actions permit the user to control better the system so he can have a better perception about the tonal structures. The user can zoom in and out, tilt the viewing angle and circle around the spiral to get a better view of the tonal structures and there is also an automatic pilot option, which is great to get the best view angle and center the camera at the heart of the action (Chew, Franc, 2003).
Figure 8 -‐ MuSA.RT (Music on the Spiral Array Real-‐Time) system (Chew, Franc, 2003)
2.1.2.7. Visualizing Music
This project goal is to observe the audio structure of music. Lillie used a tool named
“The Echo Nest” (The Echo Nest Corporation, 2012), which takes as input mp3 files and break it up into little segments, and saves the pitch, loudness (or volume) and high-‐level timbral information of those segments. Their program maps the audio data onto a visual scale and creates a video playback of the song (Lillie, 2008).
Figure 9 -‐ Lillie's music visualization program (Lillie, 2008)
As we can see in the figure above, time is mapped onto the horizontal axis and the music is chopped into a series of segments (about 0.1 to 0.3 seconds long), which corresponds to the vertical slices that we see scrolling in the video playback. Each of those chopped segments is broken up into twelve pitches along the vertical axis (they are labeled with the corresponding note on a scale). The vertical slice is colored with an RGB value corresponding to the timbre of the sound in that particular segment. Timbre is the different sound of instruments (for instance, is what makes the mandolin sound different than a violin sound). Therefore, similar sound appears with similar color, otherwise the color is different (Lillie, 2008).
2.1.2.8. Visualization of Concurrent Tones in Music with Colours
Their aim is to visualize music by interconnecting similar aspects in music and in visual perception. Ciuha, et. al focused on visualizing harmonic relationships between tones and colors. In other words, instead of attributing a color to each pitch, they attribute color to tones. Those similar tones, chords and keys will be represented by a color with similar color hue, dissonance is represented by low color saturation (Ciuha, Klemenc, Solina, 2010).
In the following figure, it is possible to see the attribution of colors to the tones. As it was said before, musical tones are comprised of a sequence of three pitches (Ciuha, Klemenc, Solina, 2010).
The following figures (figure 11 and figure 12) illustrates the result of this system, where it is possible to observe the colors association to the musical tones.
Figure 11 -‐ Excerpt from Pachelbel's Canon in D Major (Ciuha, Klemenc, Solina, 2010)
Figure 12 -‐ Excerpt from Debussy's Clair de Lune (Ciuha, Klemenc, Solina, 2010)
2.1.2.9. Movie from Music: Visualizing musical compositions
In this project, they based on the association about colors and pitches. Therefore, they used a color raster graphics display to generate images based on their theory. The colors are blue, blue-‐violet, violet, red-‐violet, red, red-‐orange, orange, yellow-‐orange, yellow, yellow-‐green, green, and blue-‐green. Moreover, they used the raster display to create the "musical paintings". They use rectangular, square and circular format for the graphic implementation (Herman, Badler, 1979).
For this, their program requires the following information: 1. Number of chords or notes
2. Number of note for each chord 3. Notes in the chord
4. Number of lines in each color sector 5. Angle of separation between adjacent lines
Here are some figures of the visualizations of this project:
Figure 13 -‐ Scale of blue violet (Herman, Badler, 1979)
Figure 14 -‐ Visualization for a two voices chant (Herman, Badler, 1979)
Figure 15 -‐ Rectangular format (Herman, Badler, 1979)
2.1.2.10. Visualization of Music Performance as an Aid to Listener’s Comprehension
Figure 16 -‐ Explanatory figure of music visualization (Hiraga, Matsuda, 2004)
As we can see in the figure above, when the tempo gets faster, the interval between the vertical lines along the horizontal axis is shorter, so when people see that, can associate the shortest intervals to a fast tempo (music rate). For the articulation, when is legato (the musical notes are played or sung smoothly and connected) the bars are close together. Giving the perception that, the sound is supposed to be connected. In the other hand, when the sound is suppose to be disconnected and short, we can observe that the bars are separated, this musical articulation is defined by staccato. Additionally, is possible to observe that this example represents a crescendo and the diminuendo, because dynamics are depicted by the height of the bars. In figure 16, the height of the bars is smaller at the beginning, and then is higher, this means that the volume is gradually higher (crescendo) and then the height of the bars is shorter again, in other words, the volume is lower (diminuendo).
2.1.2.11. Towards Building an Experiential Music Visualizer
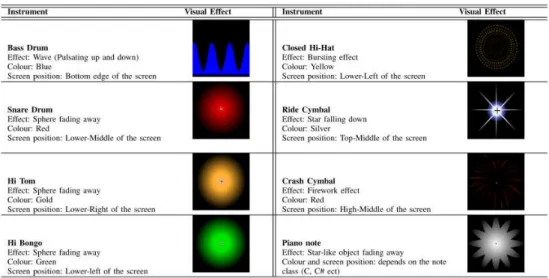
In (Nanayakkara, Taylor, Wyse, Ong, 2007) is proposed a system that is capable of building real-‐time music visualizations rapidly using Max/MSP with Flash. They based on some music characteristics (pitch and note duration) to develop the music visualization scheme. In their system, they use a MIDI keyboard so they can have the knowledge of the music characteristics. The following figure (figure 17) shows the different audio-‐visual mapping for each instrument.
Figure 17 -‐ Audio-‐visual mapping of different instruments (Nanayakkara, Taylor, Wyse, Ong,
2007)
The reason they used MIDI is because it is a lot easier to manipulate music information and it is a compact form data, which means that the MIDI files are smaller. The next figure (figure 18) illustrates the result of their work.
Figure 18 -‐ Sample output of the experiential music visualizer (Nanayakkara, Taylor, Wyse, Ong,
2007)
2.1.2.12. A Visualization of Music
They use MIDI because it contains the music information. Thus, the program parse input MIDI data files and generate graphical representations based on the music information. Their mapping function has two steps: mapping tone data, and mapping instrument data. The mapping tone data consists of representing the generated tones by the instruments, which are characterized by colored spheres. The spheres have special characteristics that can change according to their musical tone properties (pitch, volume, timbre). Firstly, the pitch is represented by the position along the vertical y-‐ axis, secondly, the volume is represented by the size of each sphere and lastly, the timbre is represented by the color to show the distinctions between each instrument group (Smith, 1997).
An individual instrument plays a sequence of tone with specified rhythms throughout a musical piece. For the mapping instrument data, these tones produced by an instrument are represented by as a sequence of spheres of various shapes and sizes. The individual instruments are mapped to particular values along the horizontal x-‐axis.
2.2. Available Technologies
In order to search for available technologies in music visualization, it was decided to look for previous work about this thematic, and YouTube1 website turn out to be a great
source to watch videos about music visualization. People use this website in order to publish their works, and it was decided to explore about how those persons did those works, and what technologies they used. Researching background works about this theme is a plus, in order to know if any of those technologies are suitable for this thesis. So it was decided to make a list of those technologies and search what can be done, therefore it can be concluded if they are important for this thesis (why should they be used, or what for should they be used). The next list shows the technologies found:
Non-‐interactive technologies:
• Media Players supporting visualizations
• Adobe After Effects
Interactive technologies:
• VDMX
• Resolume Avenue
• Max/MSP
• Pure Data
• Quartz Composer
2.2.1. Non-‐interactive Technologies
Media Players supporting visualizations:
There is some media player’s software that supports music visualization. These media software plays audio files, and shows different visualizers for the current audio file that is being played. For instance, on iTunes, the user can enable the visualizer window on the tools bar, selecting the view option and then show visualizer (see figure 19).
Figure 19 -‐ iTunes visualizer
Other software that permits music visualization is “Windows Media Player” (Windows, 2012), “Winamp” (Nullsoft, 2012), and “VLC media player” (VideoLan Organization, 2012). All the visualizers have the same purpose, they react according to the music which is playing at the moment enhancing the listening experience of the listener. The visualizer generates animated imaginary, which is usually generated and rendered in real time and synchronized with the music file as it is played.
Adobe After Effects:
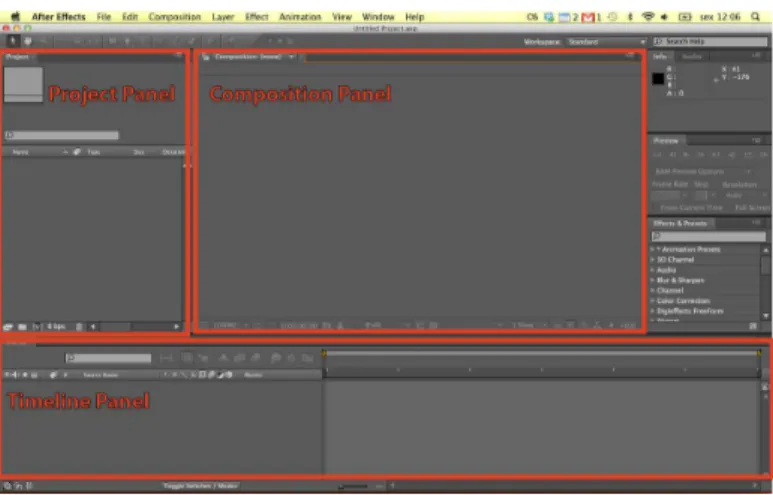
This software was designed for digital motion graphics, it is used in the post-‐ production process of filmmaking and television production. With Adobe After Effects is possible to do 2D or 2.5D animations, visual effects (Adobe Systems Incorporated, 2012).The main interface consists of some panels (Project Panel, Timeline Panel, Composition Panel, etc.). The project panel is where is possible to import videos, audio footage items (media files). The timeline panel is where the time and the order of the layers can be adjusted. Lastly, the composition panel is where the items are visible at the current time maker (see figure 20) (Adobe Systems Incorporated, 2012).
Figure 20 -‐ Adobe After Effects Software with the main panels
2.2.2. Interactive Technologies
VDMX:
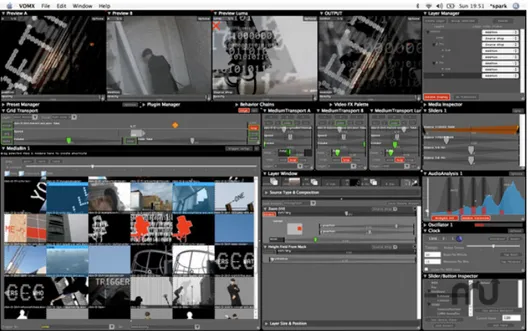
VDMX is Macintosh software that allows users to achieve good visual effects in real time (see figure 21). This software is appropriate for a musician who wants to add video to his sets, or a VJ working with a different DJ every night. With VDMX is easier to use audio and video together. Another advantage is the quality of the visual effects and real-‐ time broadcast because this software uses the processing power of the computer’s CPU. Finally, VDMX is compatible with Quartz Composer, which can be used for motion graphics visual development. In (Vimeo, 2012) we can see a video with one of the several examples of using a Quartz Composer patch in VDMX. This example is a bouncing ball
that bounces with the music beat, with VDMX is possible to use the inputs of the Quartz
Composer composition, and in this case, we are using the y position of the ball input to
vary with the beat of the music that is being played. The disadvantage of this software is
the price, it costs 300$! It’s very expensive, so for this project it might not be used in
consequence of the price (VIDVOX LLC, 2012).
Figure 21 -‐ VDMX software (DownloadAtoZ, 2011)
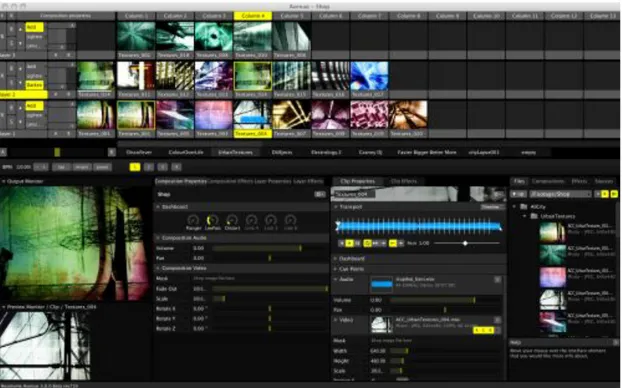
Resolume Avenue:
This software is very similar to VDMX, i.e., it is like an instrument for live performances with audio and also visual effects (see figure 22). It is a very powerful tool, which allows users (normally VJs) to do a very large number of stunning effects (Resolume, 2012). Therefore, it has the same advantages that VDMX has, and it is also compatible with Quartz Composer.
In (Wonder How To, Inc, 2011) we can see a video, that shows how we can integrate
a Quartz Composer patch in Resolume, and we can see that it is quite simple. Avenue
offers support for four different input parameters also referred to as published inputs in
Quartz Composer (Number, String, Index and Boolean). The disadvantage of this
software is the interface, because in my opinion it is a bit confusing for users who are
not used to this kinds of technologies, and also it is expensive (but it has 50% discount
for students). There is one version, which can be downloaded (version 3.3.2), but until
the serial is not entered, it will show the Resolume logo and a robot voice in the audio.