Diameter Quantitation of Preclinical Specimen
Vasculature with Radiopaque Polymer Injection Medium
Sergio X. Vasquez1*, Feng Gao2, Feng Su2, Victor Grijalva3, John Pope4, Bill Martin1, Jeroen Stinstra1, Matthew Masner1, Neha Shah1, David M. Weinstein1, Robin Farias-Eisner2, Srinivasa T. Reddy2,3,5
1Numira Biosciences, Salt Lake City, Utah, United States of America,2Department of Obstetrics and Gynecology, David Geffen School of Medicine, University of California Los Angeles, Los Angeles, California, United States of America,3Department of Medicine, David Geffen School of Medicine, University of California Los Angeles, Los Angeles, California, United States of America,4Integrated Laboratory Systems, Durham, North Carolina, United States of America,5Department of Molecular and Medical Pharmacology, David Geffen School of Medicine, University of California Los Angeles, Los Angeles, California, United States of America
Abstract
Vascular networks within a living organism are complex, multi-dimensional, and challenging to image capture. Radio-angiographic studies in live animals require a high level of infrastructure and technical investment in order to administer costly perfusion mediums whose signals metabolize and degrade relatively rapidly, diminishing within a few hours or days. Additionally, live animal specimens must not be subject to long duration scans, which can cause high levels of radiation exposure to the specimen, limiting the quality of images that can be captured. Lastly, despite technological advances in live-animal specimen imaging, it is quite difficult to minimize or prevent movement of a live animal, which can cause motion artifacts in the final data output. It is demonstrated here that through the use of postmortem perfusion protocols of radiopaque silicone polymer mediums andex-vivoorgan harvest, it is possible to acquire a high level of vascular signal in
preclinical specimens through the use of micro-computed tomographic (microCT) imaging. Additionally, utilizing high-order rendering algorithms, it is possible to further derive vessel morphometrics for qualitative and quantitative analysis.
Citation:Vasquez SX, Gao F, Su F, Grijalva V, Pope J, et al. (2011) Optimization of MicroCT Imaging and Blood Vessel Diameter Quantitation of Preclinical Specimen Vasculature with Radiopaque Polymer Injection Medium. PLoS ONE 6(4): e19099. doi:10.1371/journal.pone.0019099
Editor:Marcello Rota, Brigham & Women’s Hospital - Harvard Medical School, United States of America ReceivedDecember 1, 2010;AcceptedMarch 16, 2011;PublishedApril 18, 2011
Copyright:ß2011 Vasquez et al. This is an open-access article distributed under the terms of the Creative Commons Attribution License, which permits unrestricted use, distribution, and reproduction in any medium, provided the original author and source are credited.
Funding:This work was supported by funds from the Women’s Endowment, Carl and Roberta Deutsch Family Foundation, the Joan English Fund for Women’s Cancer Research, the Ovarian Cancer Coalition, the Helen Beller Foundation, and USPHS grant HL-082823 (STR). The funders had no role in study design, data collection and analysis, decision to publish, or preparation of the manuscript.
Competing Interests:The authors have read the journal’s policy and have the following conflicts: SXV, BM, JS, MM, NS, and DMW are employees of Numira Biosciences and JP is an employee of Integrated Laboratory Systems. This does not alter the authors’ adherence to all the PLoS ONE policies on sharing data and materials.
* E-mail: [email protected]
Introduction
Silicone polymer injection mediums have been used to visualize vascular networks by tissue clearance and light microscopy for over 40 years [1]. Recently, due to the further development of microCT technology, radiopaque perfusion compounds have become of high interest to researchers hoping to qualify regional therapeutic effect in diseased blood vasculature [2]. The advantages of using microCT to image vasculature include three dimensional imaging and non-destructiveness. Due to proven use in field and low cost, methods were optimized using Microfil (Flow Tech, Carver, MA) compound as the perfusion medium. Owing to the presence of lead chromate in formulation and retention of flexible casting properties when catalyzed and set [3], Microfil provides a number of characteristics amenable to microCT imaging of vascular networks in prepared specimens.
Materials and Methods
Small animal preparation and perfusion
All procedures were conducted in accordance with institutional, US and international regulations and standards on animal welfare.
Ethical approval was granted by the UCLA animal research committee (animal protocol number 2004-161-13). Five female C57BL/6J mice were isolated from colony prior to perfusion procedure. Specimens were individually heparinized (Sigma Aldrich, H4784) by intraperitoneal injection (50ml/specimen, 1000 U/ml)
and anesthetized by isoflurane inhalation (Attane, 83642) according to approved institutional protocols. Surgical procedures were enacted to prepare the specimen for a postmortem intracardial perfusion. Briefly, a midline incision was made from pubic symphysis to xiphoid process. The diaphragm was severed peripherally to expose the thoracic cavity. The heart was cannulated distally, at the apex of the left ventricle, and the right atrium was severed to provide outflow. To facilitate blood clearance, several volumes of heated saline (37uC) were administered via perfusion pump (LS Economy pump, Cole-Parmer, USA) at a flow rate of 5 ml/min. As the peripheral organs became visibly blanched, the flow rate was lowered to 2 ml/min and the perfusion medium was changed to MicroFil catalyzed at a viscosity appropriate for small vessel filling (2 ml:5 ml:225mL; pigmented compound:diluent:curing agent,
neutral buffered formalin and whole specimens were placed in several volumes of 10% neutral buffered formalin.
MicroCT scanning and parameters
The individual organ specimens were staged in a high-resolution mCT scanner (Scanco mCT40, SCANCO USA, Southeastern, PA) and scanned at 10mm resolution, 2000 views,
5 frames per view, 300 ms exposure time, 55 kVp, 144mA. Scan
time ranged from 7.4 hours to 17.7 hours. File sizes ranged from 1.5 GB to 6.8 GB. Whole body specimens were staged in a large field of view scanner (Varian Medical Systems, BIR/150/130, Lincolnshire, IL) and scanned at 58mm resolution, 2880 views, 2
averaged views, 67 ms integration time, 130 kVP, 120mA. Scan
time was 4 hours. File size was 3.5 GB.
Figure 1.mCT data allows for unrestricted viewing of vascular networks and can be used to perform linear vessel measurements.
Manipulations ofmCT data sets allow viewing of differing levels of vascular detail as well as unrestricted orientations. (A) Adult mouse kidney with
digital threshold set to highlight only major vessels, sagittal view. (B) Adult mouse kidney with digital threshold levels set to highlight fine vessels, sagittal view. (C–D) Adult mouse kidney vasculature viewed in coronal (C) and sagittal (D) orientation. (E–H) Linear length measurements performed on Microfil perfused vessels in the cortical region of the mouse kidney. Vessel diameters of 140mm (E) are shown progressively, down to 50mm (H).
Post-processing and rendering
The microCT generated DICOM files were converted into a file format compatible with GE MicroView (version 2.1.2, GE Healthcare) or AltaViewer (Numira Biosciences Inc., Salt Lake City, UT), which provide both planar views and volume renderings of the samples. A modified version of SCIRun (Scientific Computing Institute, University of Utah, Salt Lake City, UT) was used to generate pseudo-colored volume renderings.
Results
Microfil imaged by microCT showsin-situfilling of
vasculature of preclinical specimen organs in three spatial dimensions
After curing, MicroFil perfused organs were scanned at parameters appropriate for deriving fine vascular detail. As shown in Figure 1, the filled lumen of the kidney vasculature is made visible in volume renderings (A–D). At 10mm spatial resolution,
large vessel diameters in excess of 1 mm are captured (data not shown) and fine vasculature (4th order branching in the region of the cortex) can be observed and measured down to 50mm (E–H).
Because region of interest data is of most concern to individual researchers, it is possible to digitally isolate focal areas for
preferred observation. Panel A of Figure 1 shows large vessel signal for an adult mouse kidney in a sagittal orientation. Panels B–D show perfused mouse kidneys rendered in various orienta-tions, detailing finer vasculature features, including those of the mouse adrenal gland. Panels E–H show 2-D slice projections of vessels and their measured diameters.
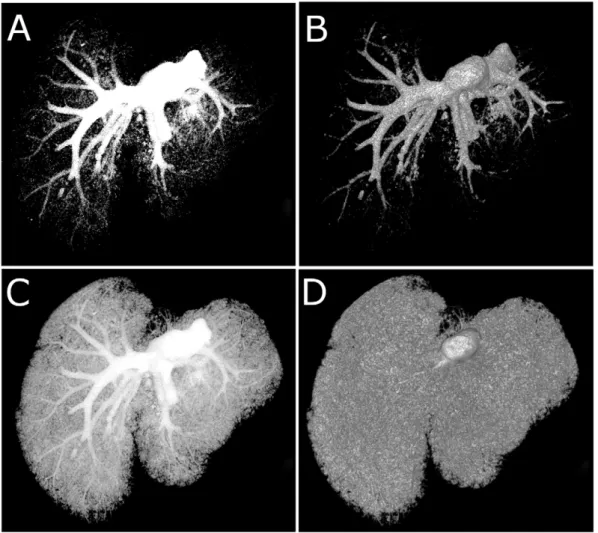
Microfil image data can be rendered to perform qualitative analysis on specific regions of interest
MicroFil perfusion methods along with microCT imaging circumvent the need to physically remove anatomical regions of interest and allow non-destructive whole mount imaging of the organ vasculature of interest. In Figure 2, we show that it is possible to isolate hepatic vasculature through digital thresh-olding while retaining peripheral tissue information. Panel A of Figure 2 depicts a maximum intensity projection (MIP) of the liver vasculature. The highest voxel intensities are depicted in the region of interest, but no depth of field is possible due to signal masking in the hyperattenuating vasculature. An automated volume rendering adjusted to the previous MIP threshold (Panel B, Figure 2) reveals the true vascular orientation. Subtle threshold variations in the MIP rendering derive the image shown in Panel C of Figure 2, depicting
the fine peripheral vasculature in relation to the larger dia-meter vasculature. Volume renderings at the same threshold value depict the whole mount volume of liver vasculature (Panel D).
Whole mount imaging of specimen vasculature can be achieved through the use of MicroFil perfusion methods
With postmortem MicroFil perfusion andex-vivo analysis, the
entire blood volume can be imaged in-place. In Figure 3, we
highlight whole mount specimen perfusion and show how associated grayscale values of the perfusion medium can be used to create high-impact rendered images. In Panels A and B, grayscale MIP images were rendered to highlight perfused thoracic and abdominal vasculature of an entire adult mouse specimen. Panels C and D include pseudocolored regions of vasculature based on grayscale threshold values. The red coloration allows for more subtle areas of vasculature to stand out against background.
Figure 3. Intact whole-mount specimen vasculature imaging is possible bymCT using radiopaque silicon polymer medium perfused animals.All panel images derived from the same Microfil perfused adult mouse data set. (A–B) Volume rendered grayscale images of skeleton and perfused vasculature. (C–D) Volume rendered pseudocolored images of perfused vasculature (red) and bone (white).
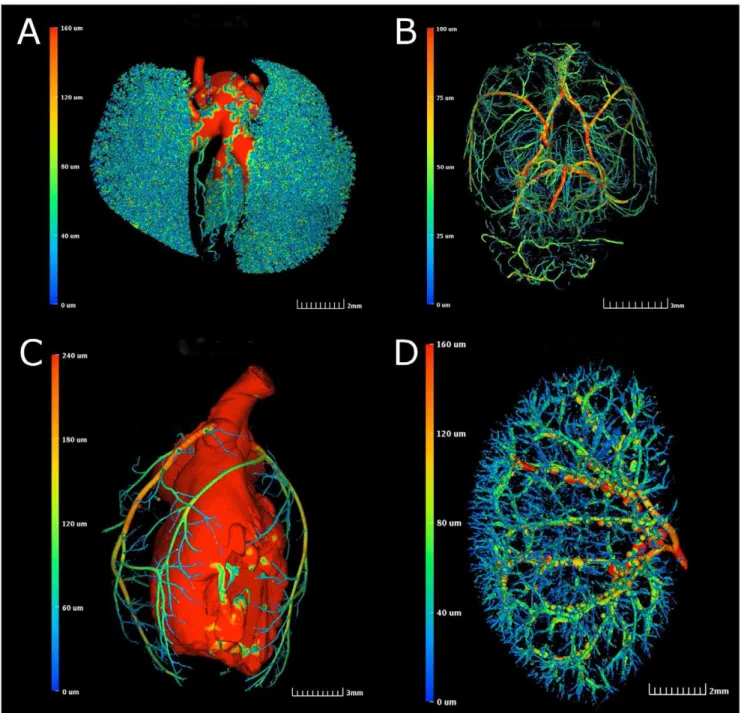
MicroFil image data can be rendered to display quantitative vessel morphometrics in a variety of perfused organ vascular regions
In order to gain insight into the vessel morphometry associated with perfused organ vasculature, we computed a 3D skeleton for the segmented tissue using the technique of Lee,et al. [4]. For each
point on the skeleton, we use simple ray casting to compute the average diameter of the vessel in the direction of the normal plane (Figure 4). The generated color scale on the left-hand side of each panel is associated with the colors observed in the volume-rendered organs. A given color represents a numerical value indicative of the cross-sectional vessel diameter through each
region of vasculature. In this way, it is possible for an observer to quantify regional vessel diameter changes at a glance and throughout the entire organ volume.
Discussion
In this paper, it is shown that microCT imaging of Microfil perfused vasculature is sufficient to visualize and quantify systemic vasculature in preclinical mouse specimens. In addition to the three spatial dimensions afforded the observer, volume data can be rendered to derive further qualitative analysis. It is also shown that perfused specimen vasculature can be imaged
Figure 4. Vessel morphometrics can be derived from perfused mouse organ vasculature. Color bar on left of each panel indicates associated vessel diameters. (A) Pseudocolored image of adult mouse lung vasculature. (B) Pseudocolored image of volume rendered coronary vasculature of an adult mouse brain. (C) Pseudocolored image of volume rendered vasculature of an adult mouse heart. (D) Pseudocolored image of volume rendered vasculature of an adult mouse kidney.
whole-mount and digitally disambiguated from skeletal back-ground. Lastly, it was demonstrated that isolated mouse specimen organs could be rendered to derive quantitative metrics and pseudocolored to highlight the main vascular regions of interest. Observed drawbacks to the method include incomplete vessel filling or vessel rupture, but can be minimized by amending the perfusion mass volume according to the average physiological blood volume of the laboratory mouse [5]. By moderating perfusion pressure and perfusion mass volume, individual investigators may find that further optimization is needed to amend the protocols depicted here for their particular preclinical model specimen. Additionally, the Microfil perfusion mass can be modified to increase or decrease the working time (i.e. time before hardening), and viscosity, as per the manufacturer’s instructions.
Systemic blood visualization is generally performed in-vivo
within focal acquisition parameters restricted to a limited field of view for therapeutic diagnosis [6],[7] although advances in angiography using synchrotron radiation have shown promise in increasing field of view while simultaneously increasing spatial resolution [8]. Further, the rhythmic movements of the heart and
lungs can act as artifact inducers in tomographic reconstruction, limiting effective resolution and negatively impacting analysis, although efforts to correct these artifacts is actively being investigated [9],[10]. Additionally, the metabolic half-life of vascular perfusion reagents is short, limited to several hours or days for both magnetic resonance [11] andmCT studies [12].
Indeed, several experiments have been conducted using cast perfusion mediums to identify gross regional vascular anatomy ex-vivo[13],[14]. Additionally, tomographic studies utilizing microCT
and Microfil perfusion mediums were able to derive volumetric [15] and pathological data [16]. By the methods detailed in this study, additional complement is provided to the analytical repertoire available to microCT technologists studying preclinical rodent vasculature.
Author Contributions
Conceived and designed the experiments: SXV FG. Performed the experiments: SXV FG FS JP MM. Analyzed the data: SXV FG FS RF-E SR DW. Contributed reagents/materials/analysis tools: NS BM JS VG. Wrote the paper: SXV.
References
1. Barger AC (1966) Renal hemodynamic factors in congestive heart failure. Ann N Y Acad Sci 139: 276–284.
2. Savai R, Langheinrich AC, Schermuly RT, Pullamsetti SS, Dumitrascu R, et al. (2009) Evaluation of angiogenesis using micro-computed tomography in a xenograft mouse model of lung cancer. Neoplasia 11: 48–56.
3. Malyar NM, Gossl M, Beighley PE, Ritman EL (2004) Relationship between arterial diameter and perfused tissue volume in myocardial microcirculation: a micro-CT-based analysis. Am J Physiol Heart Circ Physiol 286: H2386–2392. 4. Lee T-C, Kashyap R, Chu C-N (1994) Building skeleton models via 3-D medial surface/axis thinning algorithms. CVGIP: Graphical Models in Image Processing 56: 462–478.
5. Hoff J (2000) Methods of Blood Collection in the Mouse. Lab Animal 29: 47–53. 6. Jia Y, Wang RK (2010) Label-free in vivo optical imaging of functional
microcirculations within meninges and cortex in mice. J Neurosci Methods. 7. Rao B, Li L, Maslov K, Wang L (2010) Hybrid-scanning optical-resolution
photoacoustic microscopy for in vivo vasculature imaging. Opt Lett 35: 1521–1523.
8. Liu P, Sun J, Zhao J, Liu X, Gu X, et al. (2010) Microvascular imaging using synchrotron radiation. J Synchrotron Radiat 17: 517–521.
9. Ragan DK, Lai SY, Bankson JA (2010) Fast, reproducible measurement of the vascular input function in mice using constrained reconstruction and cardiac sampling. NMR Biomed.
10. Namati E, Thiesse J, Sieren JC, Ross A, Hoffman EA, et al. (2010) Longitudinal assessment of lung cancer progression in the mouse using in vivo micro-CT imaging. Med Phys 37: 4793–4805.
11. Bui T, Stevenson J, Hoekman J, Zhang S, Maravilla K, et al. (2010) Novel Gd nanoparticles enhance vascular contrast for high-resolution magnetic resonance imaging. PLoS One 5.
12. Schambach SJ, Bag S, Groden C, Schilling L, Brockmann MA (2010) Vascular imaging in small rodents using micro-CT. Methods 50: 26–35.
13. Ciszek B, Skubiszewska D, Ratajska A (2007) The anatomy of the cardiac veins in mice. J Anat 211: 53–63.
14. Enis DR, Shepherd BR, Wang Y, Qasim A, Shanahan CM, et al. (2005) Induction, differentiation, and remodeling of blood vessels after transplantation of Bcl-2-transduced endothelial cells. Proc Natl Acad Sci U S A 102: 425–430. 15. Butcher JT, Sedmera D, Guldberg RE, Markwald RR (2007) Quantitative volumetric analysis of cardiac morphogenesis assessed through micro-computed tomography. Dev Dyn 236: 802–809.