30
A review of RSU Scheduling Methods in VANET
M.Kaboli, M.R.Noorimehr, M.Abbasi Dezfuli
Department of Computer, Khouzestan Science and Research Branch, Islamic Azad University, Ahvaz, Iran [email protected]
Department of Computer, Khouzestan Science and Research Branch, Islamic Azad University, Ahvaz, Iran [email protected]
Department of Computer, Khouzestan Science and Research Branch, Islamic Azad University, Ahvaz, Iran [email protected]
Abstract
Scheduling discussion in roadside antenna of VANET is the most challenging in them. In this research, among the most widely used algorithms that are provided for scheduling, select them and describe their performance. In this study, two groups of algorithms are studied, the first group of algorithms is described and their imperfections have been expressed. The second group of algorithms is known as improved algorithms, they have not the imperfections of the previous algorithms. Finally, the performance of these algorithms has been evaluated and reported.
Keywords: Scheduling Algorithm, VANET, RSU.
I. Introduction
The response times, were the primary component of scheduling algorithm standards. (Aksoy ,1999).In the most of these works, there is not any dead line for the requests , the data is not updated on server or just can be updated by the server. However, in data access scenario inter vehicle and RSU, requests will be deleted if they are not response in specific time, since it`s assumed the vehicle is out of antenna range. (Acharya, ,1998). Hence, the update requests are competing for bandwidth with download requests. if the update request gets lost, Some of data's may be get old and the service quality will decrease. Therefore, providing fresh data for more vehicles is more important issue in comparison with the responsiveness and fairness (Wu ,2001). Recently, the following parameters are used for data access scheduling between the vehicle and the antenna (Gandhi ,2004).
1) Service ratio: it is The number of answered requests before the request expiration to the total number of received requests. A Good scheduling should respond most of requests.
2) Data quality: The data will senesce If a vehicle has the updated version of data but cannot upload the data before leaving the antenna range. The old data reduces the data quality for download service. In this research, the percentage of fresh data is used to show the quality of system data. So a good scheduling have to update data's on the proper time and tries to prevent of data senescing.
31
quality service. In continue of this scheduling, the service rate and optimization has been worked on at first, then an scheduling algorithm is presented which provided both service rate and data quality factors.(Tassiulas ,1997).
II. Primary scheduling scheme
The primary purpose of this research is to answer the request as many as possible. In this primary scheme, two parameters which can be used for data access scheduling between vehicle and antenna is introduced (Zhang ,2007).
1. Data size: if the vehicles can communicate with the RSU at the same data transmission rate, the remained service time could be calculated according to data size.
2. Deadline: a request with an earlier deadline is more urgent than a request with a later deadline.
A. Simple scheduling schemes
Here, three simple scheduling are introduced and compared.
First Come First Serve (FCFS) : the request with earlier arrival time will be served first. First Deadline First (FDF): the request with the most urgency must be served first. Smallest Data size First (SDF): the data with a smaller size must be served first.
The Figure 1 shows and compares the service rate for the named scheduling scheme above. The entrance time of requests are determined by the vehicles percentages that emit service requests, which are shown on x-axis by p.
Figure. 1. service rate for FCFS,FDF and SDF algorithms.
32
scheduling, does not consider the deadline and data size factors in the calculations, so this scheduling has the worst efficiency. (Figure 1).
It is clear that SDF and FDF can be good only in specific pregnancy. It is combined deadline and data size to improve scheduling efficiency.
III. Improved Scheduling
Due to defects of discussed scheduling which will be explained more, other scheduling have been presented that we have introduced them as improved schedules that the most widely used and most effective ones are as follows.
A. D*S scheduling
FCFS does not consider data size and request deadline. FDF gives the higher priority to the requests with more urgency. SDF considers data size in calculation but it ignores the request urgency. As a result, none of them can provide a comprehensive scheduling. In continue, this research provides a new scheduling scheme, named D*S (Zhang ,2007) which considered data size and deadline in vehicle Scheduling and roadside antennas. Thus, it can be said that:
When there is two requests with a same deadline, the request with smaller size, should be served first. When there is two requests with a same size, the request with earlier deadline, should be served first. According to said above, every request will served based on data size and deadline of a value, which it is named DS-value which it has been considered as a weight priority (Zhang ,2007).
DS_ value = (Deadline - CurrentClock) * DataSize (1)
Here, the multiplying factor is used to connect deadline and data size, since these two factors have different measurement scale or units. Different scales have no negative impact on second compare DS_value by multiplying.
A simple implementation of D*S scheme is that, DS_value is calculated for all request and then, the smallest one will be chosen. This implementation has O(m) computational complexity that
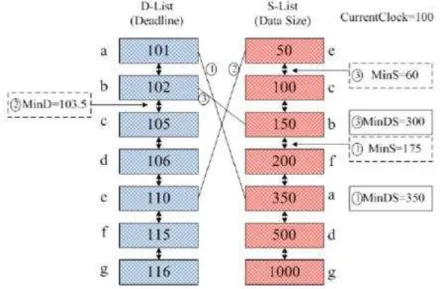
m is the unanswered requests number. In continue, a different data structure will be explained which reduces the computational complexity (35). The data structure uses two settled lists to save the requests. A list called deadline list (D_list) is used to save deadline (D value) of each message. Other list is called data size, is used to save size (S-value)of each massage. D_list is sorted by increasing the deadline of requests and S-list is sorted on ascending size of requests. Figure 2 shows the search procedure by giving an example which begins with D_list. By using an indicator, corresponding entry size can be found easily in the S-list and calculate DS-value. MinDS to DS- value has been set the first request in D-list. At the same time, Mins has been calculate the next entry deadline in D-list by using D . According to the ascending shape of D_list, we know, we have one DS-value fewer than minDS ,that S applies in the following equation :
(2)
33
updated to the current DS_value amount. Similarly, since the S-list is sorted ascending, if the deadline applies in the following equation, A test request with a DS value, is less than MinDs :
(3) That is the next entry data size in S_list. The Search operations are carried out between D_list and s_list constantly. when an input confronted with a DS-value less than Minds, the MinD'S amount will be updated . when entries are passed from MinD or Minds or When search passes half way through both lists the Operation will stops . At this point, the figured out MinDS, is the lowest DS_value For all requests. Thus, the found data would be service. By this technique, the search is reduced and computational complexity will also decrease.
Figure. 2. Search structure in two queue
Figure 2 shows a simple example of these two lists. Imagine the current time is 100. This example has been done to understand the operation of this technique and above subject. First, The above input (request a) is tested in D_LiST and MinDs are obtained of these equation. 350*(101-100)=350 with the MinDs can be calculated Mins ; MINS=350 / (102- 100)=175 ,in continue, The E request is studied which states on the top of S-list. DS-value is calculated for the e request as this:
DS_value =(110-100)*50=500 (4)
That is bigger than the MinDS in previous step. Thus, MinDS does not need to be updated. Therefore MinDs = 350/100 + 100 can be calculated. Then the next entry of the D-list will be studied which is calculated as fallow:
DS_value=(102-100)*150=300 (5)
34
In continue of the second entrance, request C is studied from the S-list. The research will be stopped, as its size is larger than the recent Mins. Since here, that the requests are investigated ( it means size≥100 and deadlines>103. 5) have no DS-value less than MinDs=300. In this example, to find a special request for receiving service, only three entries are checked. The maintenance burden of data structure is low. When a request is added to list, until the recent request is serviced, it does not move.D*S scheduling has considered both, data size and deadline. In this method, at one time a request is answered. It is obvious some vehicles may ask similar data's. Wireless communications have broadcasting feature. So we can make delay for some of the data requests and then, play it before deadline. Several requests can be answered by a public broadcasting. For example, several vehicles may want to consider the same traffic information at an intersection. A broadcast can answer all requests. The scheduling can be improved to optimize the efficiency. To improve the effect of broadcast, more snooze time data must be answered first. Parameters are added to D*S scheme that is the number of pending requests for the same data (N) which leads to a new D*S/N schedule. In this project, DNS-value is calculated by the following equation.
DSN_value = ( deadline – CurrentClock ) * Datasize / number (6)
B. D*S/N scheduling
D*S/N scheme can be implemented by using two data lists structures, similar to what was observed in the D * S scheme to reduce the time complexity. The difference is that each input, stores same data's for each data request group for the same.
In this project, three parameters must be considered (deadline, size and pending requests (N) ). It is necessary that the variables N and S combine to create a list S / N. Since the amount of S, N is depend on the data that can be updated when a request is coming. This change does not have heavy burden.In every deciding for scheduling, a process is done in D, S / N list to find a request with less DNS- value.By optimizing the broadcast, several requests can be answered in a broadcast simultaneously, which leads to use bandwidth more efficient and increase service rate . However, when the DSN_value is calculating, it is neseccury to choose a representative deadline for similar requests groups that have been pending that is representative of the whole group deadline. If more than one request is waiting for service, the lowest, average and median deadline can be used. The minimum deadline reflects the urgency of all groups, and mean or median deadline reflects the average urgency of a group requests.
35
Figure. 3. D*S/N service rate by mean, lower or middle deadlines
D*S/N improves the service rate, but it sacrifices the opportunity to upload the requested service. There is no need to store many upload requests for a data for an upload request that multiple upload requests stored for data because only the final update is useful. As a result, the amount of N is always one for upload request in D*S/N scheme .Thus, the upload request is unfair to compete in the business broadband service. Most update requests must be eliminated and the data quality is reduced for download, because most of the download requests are received old data. A possible optimization is the combination of a weight value to update requests, to help these requests to achieve a higher priority in scheduling. Of course, it is difficult to say what amount of weight should be given to the update requests because in a dynamic system, the rate of obsolescence and quality service is incomparable. So it is impossible to use one queue to download and upload (Qu ,2007). Therefore, a method is presented with two separated queue and two stage scheduling.
Here, the two priority queues are used: one for update requests and the other one for download requests. RSU server has two queues with different bandwidth. The benefits of using two different priority queues is that only download and upload queue needs to be compared, instead of comparing download and upload requests.
Two- stage schedules include: the first stage is service queue selection and the second one is to select the most appropriate service. Download and upload queue have their own priority scheduling scheme, which leads to a flexible scheduling.
The update or download queue, is defined a service profit, as the sum of the profits made of download or upload request. Imagine download requests are shared bandwidth ρ (0 ≤ρ≤ 1) and update requests of the remaining bandwidth (1- ρ). Here ρ must be set to the best value, to obtain the highest service profit. For having this, the relationship between bandwidth and service profit should be found.
Download requests can be serviced by new or old data, so the profit that they make to the system is different. Generally, the service profit can be provided by the following formula :{35}
36
By the way, it is assumed that one update request can be had as the same profit as download request with new data. If an update request is destroyed, all the download requests of that data will receive old data's, and the service quality which is shown by α will decreases. Service will
reduce to update data by the next update request. is used to show the service rate of update
requests. So the interest rate of updating depends on the service rate ( ) and bandwidth allocation (1-ρ). After a period of time t, updated interest is calculated by the following equation:
Update_profit = * ( 1- ρ ) * t (8)
Similarly, is used to show the service rate of download requests. The download interest depends on service rate(r) , dedicated bandwidth and the download quality . Data quality depends on updating. More requests will be served with fresh data's by allocating a greater bandwidth to update queue. So download interest is expressed by the following formula:
Fresh download_profit = * ρ * ( 1 - ρ ) * t (9)
Service_profit = * (1- ρ ) * t + * ρ (1- ρ) * t * ρ * α * t (10)
= *(α-1)*t ρ +( - )*t* ρ + * t (0 ≤ρ≤ 1)
The optimized ρ can obtained to maximize the service interests by solving a quadratic equation with linear constraints on ρ:
(11)
When the α = 1, It means that old data's have no negative effect on service quality. Dedicated bandwidth depends on the service rate of download requests and upgrading. Also, download or update requests that have higher service rate can all take bandwidth.
When the amount of ρ depends on the updating service rate and download requests associated with the workload, so it should be able to coordinate workload. When an accident occurs, the number of update requests increases. Also, the request workload should be different at day and night.
C. D*S/R scheduling
37
rate of a download request a data for a data in the download queue. The original D * S / R plan is that the service rate of download requests are used for download queue to optimize deadline in update queue***.For example, when two update requests has been given with the same DS-value, A request that will update fresh data's has the higher service priority, because when data is updated, more download requests can receive fresh data's. Therefore, the system interest improves. Thus the service rate (R) is added as a weight factor in priority calculating:
DSR_Value = ( deadline – currentclok ) * Datasize / R (12)
Processing D*S/R can be optimized by the two queue as in a D* S/N. According to previous sections, the scheduling is based on two separate priority queue. Bandwidth is alternatively calculated based on the amount of ρ that will be awarded to the download queue or update queue. In each decision, the scheduler decides which queue (download or update) can receive service. After this, a request is serviced in a specific queue. If the update queue is selected, D*S/R scheme is used to select the next request that must be serviced. If the bandwidth is allocated to the download queue, D*S/N scheme is used. If a queue is empty, service will be given to another queue immediately. Figure 4 shows two-stage decision-making flowchart this deadline.
Figure. 4. Flow Chart of the Two-Step Scheduling
IV. Evaluate the efficiency of surveyed Scheduler
38
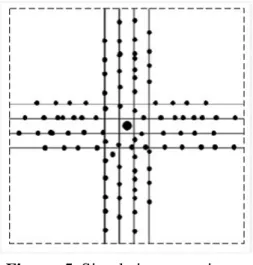
Figure. 5. Simulation scenario
When a vehicle reaches the end of the road means that it is out of antenna range and service will be deleted. Each vehicle is released a service request with a probability (0≤P≤1). Larger P is used to simulate high workload and small P is used to simulate low workload. When a vehicle is serviced and reaches the end of the road, it waits to release a new request.
Figure 6-a indicates the effect of arrival rate of requests on the Scheduler efficiency for the six said projects. As can be seen in the figure when arrival rate of requests increases, more requests will be removed.
Figure. 6. The effect of workload
39 V. Conclusion
In previous scheduling scheme and implemented scenario, there is only one intersection for simulation. Therefore, a vehicle that is out of the antenna range (out of the simulation environment) will not receive any service and this has a bad impression on service interest. In the [39] article (Shahverdy et )it has been suggested a good solution for this problem that if the vehicle was out of antenna range and its download remained unfinished , it can receive the rest of download from the next crossroad antenna.
Articles ((Zhang ,2007) and (Shahverdy,2010)) provided good improvement in data download scheduling from the roadside antenna . exiting the vehicle from the effective range of the antenna problem which is not considered in the paper (Zhang ,2007), is solved in (Shahverdy,2010) and by providing a two-stage scheduling algorithm made a good improvement in scheduling and service rate of data from the roadside antenna.
But in none of the researches on scheduling of the RSUs, the data type, like video and audio has not been considered. This means that video data's must be waiting for a long time at queue such as typical data for receive service, which led to delay or jitter in a video player. This problem is more important when critical data is in the queue; because this critical or urgent data must be received to vehicles in the shortest time otherwise have no value. Therefore, we decided to give a scheduling algorithm that not only increases the service rate more than the old method, but also considers the service quality.
Reference:
• Acharya. S and Muthukrishnan.S, Scheduling on-demand broadcasts: New metrics and
algorithms. In Proceeding of MobiCom 98', 1998.
• Aksoy. D, and M. Franklin. R*W: A scheduling approach for large-scale on-demand data broadcast. IEEE/ACM Transactions on Networking, volume 7, 1999.
• Gandhi. R, S. Khuller, Y. Kim, and Y. Wan. Algorithms for minimizing response time in broadcast scheduling. Algorithmica, 38(4):597-608, 2004.
• Qu.H and Labrinidis.A. Preference-aware query and update scheduling in web-databases. In Proceedings of the 23rd International Conference on Data Engineering(ICDE07), 2007.
• Shahverdy.M, Fathy and M. Yousefi ,S, “Scheduling Algorithm for Vehicle to Road-Side Data Distribution”, ICHCC-ICTMF 2009, Berlin Heidelberg, CCIS 66, pp. 22–30, 2010.
• Tassiulas.L and Su,C. Broadcast scheduling for information distribution. In Proceeding of Infocom 97', 1997.
• Wu.Y and Cao.G, Stretch-optimal scheduling for on-demand data broadcasts. In Proceeding of the 10th International Conference on Computer Communications and Networks(ICCCN 01'), pages 500-504, 2001.
• Zhang. Ya Zhao.J and Cao.G, On Scheduling Vehicle-Roadside Data Access. ACM