www.clim-past.net/2/21/2006/
© Author(s) 2006. This work is licensed under a Creative Commons License.
of the Past
Glacier mass balance reconstruction by sublimation induced
enrichment of chemical species on Cerro Tapado (Chilean Andes)
P. Ginot1,2,*, C. Kull3, U. Schotterer1,4, M. Schwikowski2, and H. W. G¨aggeler1,2
1Department of Chemistry and Biochemistry, University of Bern, Freiestrasse 3, CH-3012 Bern, Switzerland 2Paul Scherrer Institute, CH-5232 Villigen PSI, Switzerland
3PAGES International Project Office, Sulgeneckstrasse 38, CH-3007 Bern, Switzerland 4Physics Institute, University of Bern, Sidlerstrasse 5, CH-3012 Bern, Switzerland *now at: IRD Great Ice/LGGE 54, rue Moli`ere, 38402 St Martin d’H`eres Cedex, France Received: 8 September 2005 – Published in Clim. Past Discuss.: 22 September 2005 Revised: 5 December 2005 – Accepted: 3 April 2006 – Published: 23 May 2006
Abstract. A 36 m long ice core down to bedrock from the Cerro Tapado glacier (5536 m a.s.l, 30◦08′S, 69◦55′W) was analyzed to reconstruct past climatic conditions for North-ern Chile. Because of the marked seasonality in the pre-cipitation (short wet winter and extended dry summer pe-riods) in this region, major snow ablation and related post-depositional processes occur on the glacier surface during summer periods. They include predominantly sublimation and dry deposition. Assuming that, like measured during the field campaign, the enrichment of chloride was always related to sublimation, the chemical record along the ice core may be applied to reconstruct the history of such sec-ondary processes linked to the past climatic conditions over northern Chile. For the time period 1962–1999, a mean an-nual net accumulation of 316 mm water equivalent (weq) and 327 mm weq loss by sublimation was deduced by this method. This corresponds to an initial total annual tion of 539 mm weq. The annual variability of the accumula-tion and sublimaaccumula-tion is related with the Southern Oscillaaccumula-tion Index (SOI): higher net-accumulation during El-Ni˜no years and more sublimation during La Ni˜na years. The deepest part of the ice record shows a time discontinuity; with an ice body deposited under different climatic conditions: 290 mm higher precipitation but with reduced seasonal distribution (+470 mm in winter and −180 mm in summer) and −3◦C lower mean annual temperature. Unfortunately, its age is un-known. The comparison with regional proxy data however let us conclude that the glacier buildup did most likely occur after the dry mid-Holocene.
Correspondence to:P. Ginot (ginot@lgge.obs.ujf-grenoble.fr)
1 Introduction
In order to determine the mass balance of a glacier, net accu-mulation consisting of accuaccu-mulation and ablation of a given hydrological year is usually measured using a network of stakes and/or snow pits. This method has been used e.g. in the Alps to reconstruct mass balance over several decades, but it requires regular field measurements. In the South American Andes, the mass balances of some glaciers such as the Zongo glacier (16◦15′S, 68◦10′W) and Echaurren Norte (33◦35′S, 70◦08′W) have been monitored since 1991 and 1975, respectively (see e.g. Francou et al., 2000, 2003; Esco-bar et al., 1995). Ice cores may be applied to reconstruct past mass balance. In addition, they provide information on past meteorological conditions, climate change and at-mospheric composition (e.g. Bradley, 1999). Over the last two decades, several South-American glaciers and associated ice cores have been investigated, including Quelccaya (Peru) (e.g. Thompson et al., 1985), Huascar´an (Peru) (e.g. Thomp-son et al., 1995), Sajama (Bolivia) (ThompThomp-son et al., 1998) and Illimani (Bolivia) (Kn¨usel et al., 2002; De Angelis et al., 2003; Correia et al., 2003).
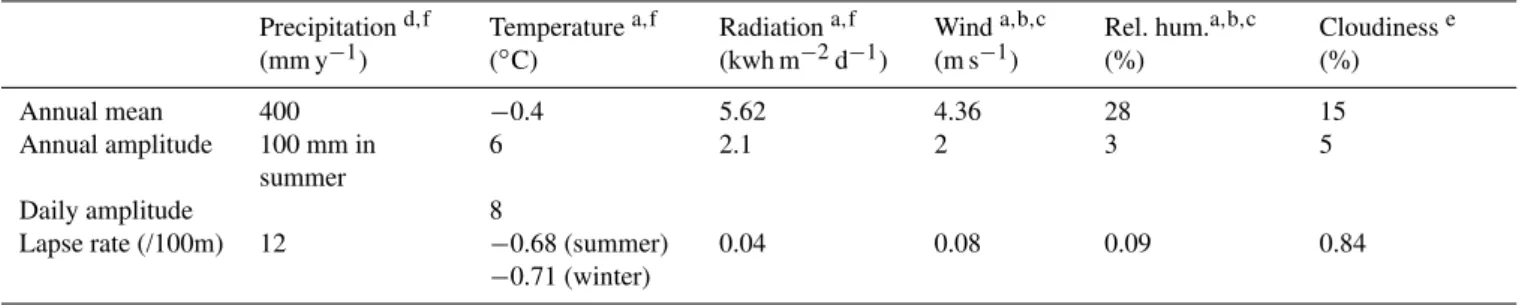
Table 1.Modern climate conditions on Cerro Tapado at 4000 m a.s.l. (Kull et al., 2002).
Precipitationd,f (mm y−1)
Temperaturea,f (◦C)
Radiationa,f (kwh m−2d−1)
Winda,b,c (m s−1)
Rel. hum.a,b,c (%)
Cloudinesse (%)
Annual mean 400 −0.4 5.62 4.36 28 15
Annual amplitude 100 mm in summer
6 2.1 2 3 5
Daily amplitude 8
Lapse rate (/100m) 12 −0.68 (summer)
−0.71 (winter)
0.04 0.08 0.09 0.84
aTapado 4215 m (30◦08′S/69◦55′W; 1998–1999) bEl Laco 4400 m (23◦50′S/67◦29′W; 1990–1994) cEl Laco 5000 m (23◦50′S/67◦29′W; 1990–1994) dMinetti et al. (1986)
eAmmann (1996) fVuille (1996)
Fig. 1. Location of Cerro Tapado in Northern Chile. The South American Arid Diagonal separates both principal precipitation regimes that influence this region (Westerlies and Tropics). On the top, a photo of the glacier on Cerro Tapado.
The climate of this part of the South American continent is primarily driven by the Pacific. On the western side of the Andes, south of 18◦S, the precipitation at 4000 m a.s.l increases from north to south, reaching values of about 400 mm y−1at 30◦S (Escobar and Aceituno, 1998). Table 1 presents the modern climatic conditions on Cerro Tapado. Winter precipitation (MJJA) related to Pacific cyclone ac-tivity is dominant. The summer months (SONDJFM) are relatively dry, although sporadically interrupted by convec-tive showers from the continental eastern side of the An-des (Begert, 1999; Escobar and Aceituno, 1998). The mod-ern climatic conditions and the strong N-S precipitation gra-dient allow the presence of isolated glaciers only south of 27◦S, where the Equilibrium Line Altitudes (ELA) decrease from 5900 m a.s.l. at 27◦S to 5300 m a.s.l. at 30◦S and to 4500 m a.s.l. at 32◦S (e.g. Amman et al., 2001. The Cerro Tapado glacier flows down from the summit (5536 m a.s.l.) to 4600 m a.s.l. and exists under limiting moisture con-ditions (see picture in Fig. 1). Higher peaks adjacent to Cerro Tapado, such as Cerro Olivares (6252 m a.s.l, 30◦17′S, 69◦54′W), are currently free of glaciers, suggesting that some of the existing glaciers are atypical in this area and that local conditions (e.g. excess precipitation, wind transport, to-pography) play an important role (Kull et al., 2002).
Chloride (µg L-1) 0 500 1000 1500
Nitrate (µg L-1) 0 1000 2000
Sulfate (µg L-1) 0 6000 12000
Calcium (µg L-1) 0 3000 6000
δ18O (‰)
-30 -25 -20 -15 -10
3H max.
Fall 1965 SURFACE
Dept
h (
m
weq
)
0
5
10
15
20
25
~ A.D.1940
~ A.D.1921
}
?BEDROCK
δ
Fig. 2.Cerro Tapado ice core: stratigraphy [firn (white), ice (grey), dust layer (hatched black), air bubble shape (white circles and ellipses)] and concentrations profiles of chloride, nitrate, sulfate, calcium andδ18O. A few time horizons are indicated. The age of the lowermost 4.5 m weq is unknown (see text).
a volatile form were partially released from the snow. This experiment also revealed that the concentration of certain chemical species in the surface snow layer is directly pro-portional to the amount of water lost by sublimation, without observed influence of dry deposition. In the case of Cerro Tapado, the best tracer for the reconstruction of sublimation turned out to be chloride.
This relation will be used to reconstruct the original mass balance from the trace species concentration recorded along the Cerro Tapado ice core. Further, the temporal variation of the deduced mass balance is compared to the El Ni˜no-Southern Oscillation Index (SOI).
2 Experimental
In February 1999, a 36 m long ice core (27.87 m weq) was recovered from the Cerro Tapado glacier with the FELICS solar-powered electromechanical ice drill (Ginot et al., 2002). The core reached bed rock. All ice core segments were kept frozen until they were analyzed. Englacial tem-peratures were measured in the borehole using a thermistor chain. Between February 1998 and February 2000, an auto-mated weather station installed near the Cerro Tapado base camp (4215 m a.s.l, 30◦08′S, 69◦55′W) measured incoming global radiation, wind speed, humidity and temperature. A second station was operated on the summit plateau of the glacier at 5500 m a.s.l. during the ice-coring campaign in February 1999 (Ginot et al., 2001a; Kull et al., 2002; Stich-ler et al., 2001).
The ice core was cut into 1901 samples (1.9±0.5 cm res-olution) in a cold room and analyzed for concentrations of major ions (Na+, K+, Mg2+, Ca2+, NH+4, SO24−, NO−3, Cl−, CH3SO−3, F−, HCO−
2, CH3CO − 2, C2O
2−
4 )(see e.g. Ginot et al., 2001a), pH, conductivity and stable isotopes (δ2H and
δ18O). Firn/ice density was measured for each 70 cm long core segment.
During the same period, a surface snow experiment was conducted on a flat snow area close to the drilling site. From a virgin snow surface not affected by previous sublimation and dry deposition effects, 1cm thick snow samples were col-lected twice a day during about 4 days in order to observe surface snow chemical concentration and isotopic composi-tion changes. For the same time period, sublimacomposi-tion was di-rectly measured by sublimation pans and appropriate meteo-rological data were collected. The complete experiment and their results are described in detail in Ginot et al. (2001a) and Stichler et al. (2001).
3 Results
The annual mean temperature recorded between 1998 and 2000 at 4215 m a.s.l was −0.4◦C. Table 1 presents an-nual means, anan-nual amplitude, daily amplitude and lapse rates of all measured meteorological parameters (tempera-ture, precipitation, radiation, wind speed, relative humidity, and cloudiness).
1st stage 2nd 3th
Densi
ty of
pure i
c
e
Firn/Ice density (g cm-3)
0,4 0,5 0,6 0,7 0,8 0,9 1,0
Depth
(m)
0
5
10
15
20
25
30
35
Borehole Temperature (°C)
-13 -12
-11 -10
-9 -8
Fig. 3. Borehole temperature in◦C (grey diamonds) and firn/ice density. The black circles represent the density of segments with ice lenses formed by refreezing meltwater, and white squares represent the density of segments without. The thick black line is the modeled density for the 1st and 2nd stages of densification, until a density of 0.8 g cm−3(Herron and Langway, 1980).
together with selected ion concentration profiles (Cl−, NO−3, SO24−, Ca2+) and the δ18O record. The borehole tem-peratures ranged from −8.6◦C (1 m depth) to −12.4◦C (bedrock), see Fig. 3. The low glacier temperature suggests a good preservation of the chemical and isotopic profiles with-out major disturbances due to meltwater percolation. The basal temperature indicates that the deepest ice is frozen to bedrock. The firn/ice density profile measured from 70 cm long core sections (Fig. 3) exhibits strong and unusual vari-ations. Only for some core segments consisting mainly of firn (white squares in Fig. 3) does the density profile agree well with the predicted values obtained from a firn densifica-tion model (Herron and Langway, 1980) (black line in Fig. 3, details in section “Melting”). The core segments containing ice lenses (black circles in Fig. 3) have significant positive density anomalies.
For the ice core dating, a combination of several conven-tional dating methods was used (identification of tritium
hori-zon, annual layer counting,210Pb decay) (e.g. Eichler et al., 2000). The peak of the tritium activity, which in the South-ern hemisphere occurred during the years 1965/66 (Schot-terer et al., 1998), was found between 10.68 and 10.77 m wa-ter equivalent (m weq) depth. This reference horizon yields a mean annual net-accumulation of 315 mm weq y−1. Be-tween 1963 and 1999, a seasonal (wet-dry seasons) dat-ing resolution is achieved, based on a selective combina-tion of annual variacombina-tions of the tritium activity (1963–1970), some chemical species (NO23−, Ca2+)andδ18O (Ginot et al., 2001b). The concentration peaks of ions were attributed to the dry season (September to March) when sublimation in-creases the concentration of some conservative ions in the surface snow layers (Ginot et al., 2001a). Sublimation also influences the stable isotope profiles (Stichler et al., 2001). The wet seasons (April to August) are identified by lower ion concentrations due to much less sublimation. With only two reference horizons (surface and tritium maximum), the precision of the dating decreases to±2 years for the period 1967–1977. For the deeper part of the record, we try to use the dating method based on210Pb activity decay but without success. 210Pb activity decreases from 71 mBq kg−1 at the surface to a mean background level of approx 3.4 mBq kg−1 at∼21 m weq, hence covering a time range of about one cen-tury due to the half-life of 22.3 y for210Pb. The background level reflects the blank value of the procedure, and was sub-tracted from the values for the determination of the depth-age relation. With these parameters, the age based on210Pb was 1927 for he well defined 1965 tritium level. Deeper than the tritium reference level, only annual layers counting method was used for dating but with some uncertainty.
3.1 Mass balance reconstruction 3.1.1 Net-accumulation
Annual net-accumulation is the quantity of snow preserved during the hydrological year, from beginning of the wet sea-son to the end of the following dry seasea-son (March to Febru-ary). It is determined by identifying annual layers, as ex-plained above for the period 1963 to 1999. For the lower part only multi annual means can be given, calculated for intervals, each 1 m weq long. Table 2 and Fig. 4a (top) sum-marize the results. For the period 1963–1999, the annual net-accumulation rate fluctuates between 102 (in 1980) and 1032 mm weq (in 1966) with a mean value of 316 mm weq. The same amplitude in the net-accumulation rates was ob-served previously in ice core records from Illimani, Chimbo-razo, Quelccaya and Huascar´an.
3.1.2 Sublimation
Table 2.Mass balance terms net accumulation, sublimation, melt, and total accumulation reconstructed from the ice core.
Period Value Net-accumulation Sublimation Melt Total-accumulation
Annual 1 meter Annual 1 meter 1 meter Annual 1 meter
1999–1962 Mean 316 347 327 283 40 539 553
Min 102 200 (−18) 1 24 (−5) 8 (−1) 160 335 (−37)
Max 1032 500 (+167) 1237 667 (+74) 122 (+40) 1985 851 (+284)
1962–23.5 m weq Mean 306 374 33 681
Min 167 (−13) 37 (−8) 4 (−1) 384 (−35)
Max 500 (+167) 880 (+294) 63 (+20) 1380 (+460)
23.5 m weq – Bedrock Mean 263 1374 1310
Min 218 (−24) 982 (−109) 586 (−53)
Max 333 (+67) 1807 (+360) 1960 (+178)
Ne
t-accu
mul
a
ti
on
(mm weq)
0 500 1000 1500
1965 1970 1975 1980 1985 1990 1995 2000
S
u
blim
ation
(mm weq)
0
500
1000
1500
Tota
l an
d
ne
t a
c
c
u
mu
la
tio
n
(mm weq)
0 500 1000 1500 2000 2500
E
x
trapolated Annua
l Precipitation
(mm)
0 500 1000 1500 2000 2500
SOI
M
e
an
-30
-20
-10
0
10
20
30
? ? ?
? ?
?
Year
1900 1920 1940 1960 1980 2000
S
u
blim
ation
(m
m weq
)
0
500
1000
1500
2000
?
A
B
An
nu
al
a
n
d
mea
n
-A
nn
ua
l
-WET
DRY
? ?
?
? ?
? ?
Concentration (µg L-1)
1 10 100 1000 10000
Frequency
0 50 100 150 200 250 300 350
Chloride Calcium Formate
Fig. 5.Absolute frequency distribution histograms of chloride, cal-cium and formate concentration (1901 samples divided in 25 bins).
(Ginot et al., 2001a). In the Cerro Tapado record, chloride seems to be the best tracer of sublimation since the increase of chloride concentration in the surface snow layer is pro-portional to the water loss by sublimation and is not affected by dry deposition of sea salt. The amount of water lost by sublimation may thus be quantified from the chloride enrich-ment in each annual surface layer formed during the dry sea-son. Assuming that only the upper snow layers are exposed to post-depositional processes, the deeper snow should keep its original composition. In order to obtain the mean concen-tration of chloride in fresh snow (not influenced by sublima-tion), we calculated the concentration frequency distribution of all ice core samples (1901 samples divided in 25 bins on a logarithmic scale).
Figure 5 illustrates the resulting frequency distributions of the three ions chloride, formate and calcium, which are influenced differently by sublimation (Ginot et al., 2001a). Formate forms volatile formic acid and is not enriched by sublimation. Consequently a mono-modal distribution is ob-served, representing the initial concentrations in fresh snow. Chloride is enriched in the surface layer by sublimation and shows a broader distribution with a bi-modal shape. The mode at 50 µg L−1 represents the concentrations in fresh snow, whereas the mode at 145 µg L−1 is due post-depositional enrichment. The distribution of calcium is even broader and has a third mode, which we attribute to dry de-position (Ginot et al., 2001a).
Accordingly, chloride concentrations higher than the fresh snow level of 50µg L−1were considered to result from en-richment by sublimation. With this assumption annual sub-limation rates could be calculated from the chloride concen-tration record.
Figure 4 depicts the obtained mass balance terms on a tem-poral scale: Fig. 4a, lower part, shows annual sublimation, which fluctuates between 1 and 1237 mm weq with a mean
annual value of 327 mm weq between 1962 and 1999. The upper part of Fig. 4b illustrates annual total accumulation, being the sum of net accumulation and sublimation, annual data for the period 1963–1999, and annual mean over 3– 6 years before. A mean annual total accumulation rate of 539 mm weq is obtained for 1999–1962. During some hy-drological years such as 1981, sublimation yields to a loss of 84% of the total accumulation. For other years, this abla-tion is a few percent only. The mean annual ablaabla-tion due to sublimation amounts to 46% for the period 1962–1999.
In order to validate this method of sublimation reconstruc-tion using the chloride concentrareconstruc-tion profile, we applied the sublimation rates to correct the measured210Pb activity pro-file. 210Pb in the atmosphere is usually attached to fine aerosol particles and is therefore deposited onto the glacier during snowfall, whereas the contribution of dry deposition is negligible. Since210Pb cannot be volatilized after deposi-tion, a similar enrichment due to sublimation as observed for chloride is expected. Strong fluctuations of the210Pb activity with enrichment located on the same depth levels as chloride indicate that this is indeed the case (Fig. 6a).
The effect of the sublimation on210Pb activity was cor-rected using the sublimation estimates deduced from the chloride record. For each210Pb sample, the corresponding sample width was “stretched” by addition of the associated sublimation value, and the210Pb activity was proportionally “dissolved”, resulting in a much longer corrected profile. The resulting raw profile is illustrated in Fig. 6b. The total depth increased from 27.8 m weq net-accumulation to 78 m weq total accumulation. Indeed, most of the pronounced peaks from the primary data (Fig. 6a) are now removed, which supports the assumption that they represent an artifact com-ing from the sublimation post deposition enrichment. At 41 m weq the corrected activity (dashed curve in Fig. 6b) drops from 3 mBq kg−1to a level of about 0.7 mBq kg−1. This value of 0.7 mBq kg−1 was assumed as background level and subtracted to give the blank-corrected profile (thick line in Fig. 6b). The linear regression of the logarithmic sub-limation and blank corrected210Pb activity yields a y-axis intercept ofA0corr=34 mBq kg−1and an annual total accu-mulation of 465 mm weq, in reasonable agreement with the values listed in Table 2. The drop at 41 m corresponds to a time lapse of at least 35 years.
3.1.3 Melting
b
Depth (m weq) = Σ Net-Accumulation
0 5 10 15 20 25 30
21
0 Pb Ac
tivity
(mBq.
k
g
-1 )
0,1 1 10 100
Corrected Depth (m weq) = Σ Total-Accumulation
0 10 20 30 40 50 60 70 80
Corre
cted
210
Pb Activit
y (mBq.kg
-1 )
0,1 1 10 100
A
B
Fig. 6. Measured(a)and sublimation corrected(b)210Pb activity profiles with linear regression lines. Dashed and thick lines rep-resent raw and blank corrected values respectively. The grey zone represents the ice core section with “unknown age”.
snow to ice up to a firn density of 0.8 g cm−3. As shown in Fig. 3, the measured density is often higher than mod-eled as a result of sub-surface re-crystallization layers. The differences observed between measured and modeled densi-ties for each 70 cm long core sections were used to calcu-late the proportion of ice lenses and recalcu-lated surface melting. A mean annual melt of 40 mm was deduced for the period 1962–1999 and 33 mm for the lower part. The large differ-ence between mean annual sublimation and melting is caused by short positive temperature periods responsible for melt-ing and extended time periods where climatic conditions fa-vor sublimation (vapor pressure deficit, global radiation and wind speeds) (Vuille, 1996; Kull and Grosjean, 2000). 3.2 Climate parameter reconstruction for the modern
pe-riod: 1920–1999
The resulting annual mass balance parameters were com-pared with the Southern Oscillation Index (SOI) and with extrapolated annual precipitation. The SOI characterizes
the cold (positive values, La Ni˜na) and warm phases (neg-ative values, El Ni˜no) of the El Ni˜no-Southern Oscillation (ENSO). In Fig. 4a, annual net-accumulation and sublima-tion are compared with the annual mean values (March to March) of the monthly SOI data (source: Commonwealth, Bureau of Meteorology). 70% of the above average annual net-accumulation values (average 316 mm weq from 1962– 1999) correspond to wet phases of ENSO (indicated by ar-rows in the WET window). On the opposite, only 50% of above average 327 mm sublimation events correspond to ENSO dry phases (indicated by arrows in the DRY window). In addition, high annual net-accumulation values are gener-ally associated with lower sublimation and vice versa. These results support the interpretation that the precipitation regime and climatic conditions in the region of Cerro Tapado are strongly influenced by the Westerlies circulation regime with higher total-accumulation during El Ni˜no years, but that dur-ing La Ni˜na dry phases, eastern moisture inputs and cloud cover may reduce the sublimation.
In order to compare the reconstructed total-accumulation rates with direct precipitation measurements, data from La Serena (29◦55′S, 71◦12′W, 146 m) for the time period 1920 to 2000 (A. Montecinos, personal communication) were ex-trapolated to the altitude of Cerro Tapado using a linear alti-tudinal gradient of 4.3 mm/100 m deduced from annual pre-cipitation means for 1977–1988 coming from 6 precipita-tion measurement staprecipita-tions along the Elqui valley: La Serena (146 m), Almendral, Rivadavia, Pisci Elqui (1250 m), La Or-tiga and La Laguna (3100 m) (Begert, 1999). The mean an-nual precipitation estimated in this way was 315 mm for the period 1962–1999 (Fig. 4b), which is somewhat lower than the 539 mm given in Table 2. One possible reason might be occasional convective precipitation events approaching from the east that are not taken into account in such an extrapolation but observed along the Elqui valley (Bergert, 1999). Furthermore, higher peaks in the region such as Cerro. Olivares (30◦17′S 69◦54′W, 6252 m) are currently free of glaciers. The presence of the Tapado glacier in a gen-erally glacier-free environment emphasizes the local atypical climatic-glaciological conditions with increased accumula-tion rates. We consider two processes to be relevant. First, re-deposition of snow and snow-cornices along the crest was observed and may account for the locally enhanced accumu-lation rates. Second, Co. Tapado is located directly in front of the Paso del Agua Negra. Ammann (1996) showed that moisture is preferentially transported along valleys, which results in locally enhanced cloud cover and precipitation.
Table 3.Climate reconstruction from the accumulation history in the core using the mass balance model from (Kull and Grosjean, 2000, and Kull et al., 2002).
Parameter 1998/1999 1920/1999 23.5 m – bottom Difference
Measured/modeled Modern average Paleo-conditions Paleo/Modern
Mean annul Temp. (◦C) −11.5 −12.4±0.2 −15±1.5 −3 (±1.5)
Total accumulation (mm/y) 750 540±45 830±50 +290±150
Winter accumulation (mm) 500 310±45 780±50 +470±100
Summer accumulation (mm) 250 230±45 50±50 −180±100
Sublimation (mm/y) 490 240 620 +380
Net accumulation (mm/y) 260 300 210 −80
3.3 Paleoclimate
Between 23.5 m weq depth and bedrock, direct dating of the ice core was not possible. Based on annual layers count-ing, this core section must be older than A.D. 1921. The presence of stretched gas bubbles (see Fig. 2) and low ice temperature near bedrock (−12.4◦C) yields evidence for a much older ice body frozen to bedrock. This hypothesis is supported by the high ice density of this layer correspond-ing to the third stage of densification with compression of the bubbles under past higher glacier thickness pressure (e.g. Herron and Langway, 1980). Furthermore, the reconstructed mass balance terms for this lowermost part of the core differ markedly from the 20th century conditions (Table 2), espe-cially for the reconstructed sublimation. Therefore, this ice must have been formed under very different climatic condi-tions in the more distant past. The mass balance model used to set up the relationship between climatic conditions and ac-cumulation/ablation parameters on Cerro Tapado (Kull and Grosjean, 2000; Kull et al., 2002) was used to model related climatic conditions recorded in this ice body (Table 3). To explain such anomalous annual mean values, major climatic changes in comparison to modern conditions are required. The reconstructed accumulation history in this part of the core must have been driven by massive sublimation losses during the buildup of the glacier (Table 3). The climatic interpretation, consistent with both, the ice core data and the climate-mass-balance model (Kull and Grosjean, 2000; Kull et al., 2002), points to lower temperatures (−3±1.5◦C), higher annual precipitation (290±150 mm) and increased seasonality in the moisture supply (Table 3). High precipi-tation in the humid winter season is responsible for the nec-essary accumulation while the extended dry season relates to the pronounced sublimation. Today the timing of this cli-matic regime remains unclear. However, the presence of a time and accumulation hiatus of unknown age and duration is clearly indicated and raises concerns and speculations.
The formation of the upper part of the Cerro Tapado glacier must therefore have occurred after previous cli-matic conditions have caused a complete ablation down to
23.5 m weq. To reach a negative net-accumulation, a re-duction of the current annual total-accumulation by more than 270 mm weq is necessary. Assuming extremely dry climatic conditions such as those occurring in the center of the “South American Arid Diagonal” (around 25◦S) at this altitude (summer precipitation=50 mm, winter precipi-tation=230 mm), a maximum annual negative mass balance of −515 mm is estimated after Kull and Grosjean (2000). This would require∼50 years of extremely dry conditions for a complete ablation of the actual ice mass on the sum-mit plateau. If ablation by sublimation alone would have caused this reduction of the ice mass, a significant concen-tration peak in conservative chemical species would be ex-pected which is not the case at 23.5 m weq. This implies that the hiatus at this depth must be explained by ice flow over the basal frozen ice body combined with ablation after the formation of the basal ice body.
When did the buildup of the lower part start? As shown by mass balance modeling, extremely dry periods could not have persisted over longer periods since the glacier forma-tion. They would have caused a complete ablation of the ice mass. Observations from the Agua Negra glacier (Bracke-busch, 1892) located a few kilometers east in Argentina (30◦15′S, 69◦50′W) report a markedly greater extension than actual of this glacier in A.D. 1890 and indicate there-fore a “glacier friendly” (cool/humid) climate during periods of the Little Ice age. This implies that also Cerro Tapado glacier existed in this time. On the other side, the dry mid Holocene with substantially reduced precipitation (e.g. Lamy et al., 1999; Maldonado and Villagran, 2002; Jenny et al., 2002a) would not have allowed any glacier growth in the re-gion.
climatic conditions for the bottom ice mass. The derived strong link of Cerro Tapado mass balance and ENSO for re-cent decades may imply a similar relationship for the past. The modeled increased hydrological seasonality with en-hanced winter precipitation and dry summers could therefore link to stronger ENSO activity during this glacier buildup pe-riod, as also suggested from sediment cores offshore Chile (Lamy et al., 1999), Lake sediment records in central Chile (Jenny et al., 2002a) and archaeologically based paleocli-matic data from the Peruvian coast (Sandweiss, 2003). On the other hand, it remains speculative if Cerro Tapado glacier would have survived e.g. long lasting dry periods with likely persistently weak El Ninos around BC 200 and AD 250 (Jenny at al., 2002b) and in medieval times during A.D. 800– 1250 as recorded in different ENSO sensitive archives (e.g. Rein et al., 2004).
4 Conclusions
Tropical glacier ice cores have often been used as paleocli-matic and environmental archives based on the interpreta-tion of chemical and stable isotope records. However, this study performed on a 36 m long ice core from subtropical Cerro Tapado glacier shows how drastically secondary ef-fects such as sublimation may perturb primary information. Fortunately, sublimation leaves a footprint in the chemical record which can be used to reconstruct the original situation. This study shows how, on the basis of chemical trace analysis and the measurement of tritium and210Pb, the mass-balance parameters sublimation, melting and total-accumulation as a function of time can be deduced. This reconstruction reveals that, for the period 1962–1999, mean water loss due to sub-limation amounted to 46% of total precipitation. Occasional melting and associated percolation was limited to the sur-face layer as a result of the low snow/firn temperature. The inferred annual total accumulation was compared with the SOI, which gives evidence that at Cerro Tapado the precipi-tation and ablation regimes are mainly influenced by ENSO conditions.
Based on ice core stratigraphy, mass balance reconstruc-tion and210Pb dating, a hiatus in the ice body was found at a depth of 23.5 m weq. Below 23.5 m weq., the reconstruc-tion suggests more humid and colder climate condireconstruc-tions with very pronounced precipitation seasonality, in marked con-trast to 20th century conditions. This part has been formed under different climate conditions. Unfortunately the basal body is not dated yet. Therefore, it remains speculative, when the reconstructed climate conditions allowed starting the glacier buildup. Based on regional paleoclimatic proxy data, we conclude that the bottom ice mass was formed after the dry mid-Holocene, under humid and cool climate condi-tions probably related to intensified ENSO activity.
Acknowledgements. We would like to thank J. Quinteros (Di-recci´on General de Aguas, Chile), A. Giannini (Universidad de Chile, Santiago), B. Zweifel (ETH Z¨urich) for their contribution to the fieldwork. The help of M. Grosjean and H. Veit (University of Bern) and A. Rivera (Universidad de Chile, Santiago) in organizing our expedition as well as the active support of H. P. Erismann, Swiss ambassador in Santiago de Chile, is highly acknowledged. Appreciation is expressed to the Chilean Army (Regimiento de Infanter´ıa No. 21 “Arica”) for the support of the fieldwork, to Swisscargo for transporting the ice samples and to the Aargauer Zentralmolkerei for storing the ice. This work was carried out in the framework of the Swiss National Science Foundation, Projects 21-50854.97 and 21-50854.99. I appreciate the constructive comments from both anonymous reviewers.
Edited by: V. Masson-Delmotte
References
Ammann, C.: Climate change in den trockenen Anden: Ak-tuelle Niederschlagsmuster, Geographica Bernensia, G46, 81– 127, 1996.
Ammann, C., Jenny, B., Kammer, K., and Messerli, B.: Late Qua-ternary Glacier response to humidity changes in the arid Andes of Chile (18–29◦S), Palaeogeogr., Palaeoclimatol., Palaeoecol., 172(3–4), 313–326, 2001.
Begert, M.: Klimatologische Untersuchungen in der weiteren Umgebung des Cerro Tapado, Norte Chico, Chile, Master degree Thesis, University of Berne, Switzerland, 1999.
Brackebusch, L.: Die Kordillerenp¨asse zwischen der argentinischen Republik und Chile, Zeitschr. Ges. Erdk, 27, 20–36, 1892. Bradley, R. S.: Paleoclimatology; reconstructing climates of the
Quaternary, International Geophysics Series, Vol. 64. Academic press, London, 1999.
Correia, A., Freydier, R., Delmas, R. J., Sim˜oes, J. C., Taupin, J.-D., Dupr´e, B., and Artaxo, P.: Trace elements in South Amer-ica aerosol during 20th century inferred from a Nevado Illimani ice core, Eastern Bolivian Andes (6350 m a.s.l.), Atmos. Chem. Phys., 3, 2143–2177, 2003,
http://www.atmos-chem-phys.net/3/2143/2003/.
De Angelis, M., Sim˜oes, J. C., Bonnaveira, H., Taupin, J. D., and Delmas, R. J.: Volcanic eruptions recorded in the Illimani ice core (Bolivia): 1918–1998 and Tambora periods, Atmos. Chem. Phys., 3, 1725–1741, 2003,
http://www.atmos-chem-phys.net/3/1725/2003/.
Eichler, A., Schwikowski, M., G¨aggeler, H. W., Furrer, V., Synal, H. A., Beer, J., Saurer, M., and Funk, M.: Glaciochemical dating of an ice core from upper Grenzgletscher (4200 m a.s.l.), J. Glaciol., 46(154), 507–515, 2000.
Escobar, F., Casassa, G., and Pozo, V.: Variaciones de un glaciar de monta˜na en los Andes de Chile central en las ´ultimas dos d´ecadas, Bull. Inst. Fr. Etudes Andines, 24(3), 683–695, 1995. Escobar, F. and Aceituno, P.: Influencia del fenomeno ENSO
so-bre la precipitacion nival en el sector andino de Chile Central, durante el invierno austral, Bull. Inst. Fr. Etudes Andines, 27(3), 753–759, 1998.
AM-BIO: A Journal of the Human Environment, 29(7), 416–422, 2000.
Francou, B., Vuille, M., Wagnon, P., Mendoza, J., and Sicart, J.-E.: Tropical climate change recorded by a glacier in the cen-tral Andes during the last decades of the twentieth century: Chacaltaya, Bolivia, 16◦S, J. Geophys. Res., 108(D5), 4154, doi:10.1029/2002JD002959, 2003.
Ginot, P., Kull, C., Schwikowski, M., Schotterer, U., and G¨aggeler, H. W.: Effects of post-depositional processes on snow composi-tion of a subtropical glacier (Cerro Tapado, Chilean Andes), J. Geophys. Res., 106(D23), 32 375–32 386, 2001a.
Ginot, P., Schwikowski, M., Schotterer, U., G¨aggeler, H. W., Fran-cou, B., Gallaire, R., and Pouyaud, B.: Potential for climate vari-ability reconstruction from Andean glaciochemical records, Ann. Glaciol., 35, 443–450, 2001b.
Ginot, P., Stampfli, F., Stampfli, D., Schwikowski, M., and G¨aggeler, H. W.: FELICS, a new ice core drilling system for high-altitude glaciers, Memoirs of National Institute of Polar Re-search, 56 (Special Issue), 38–48, 2002.
Grosjean, M., Geyh, M. A., Messerli, B., Schreier, H., and Veit, H.: A late Holocene (<2600 BP) glacial advance in the south-central Andes (29◦S), northern Chile, The Holocene, 8(4), 473– 479, 1998
Hardy, D., Williams, M. W., and Escobar, C.: Near-surface faceted crystals, avalanches and climate in high-elevation, tropi-cal mountains of Bolivia, Cold Regions Science and Technology, 33(2–3), 291–302, 2001.
Herron, M. M. and Langway, C.C.: Firn densification: an empirical model, J. Glaciol., 25, 373–385, 1980.
Hou, S. and Qin, D.: The effect of postdepositional process on the chemical profiles of snow pits in the percolation zone, Cold Re-gions Science and Technology, 34(2), 111–116, 2002.
Jenny, B., Valero-Garc´es, B. L., Villa, R., Urrutia, R., Geyh, M., and Veit, H.: Early to mid-Holocene aridity in Central Chile and the Southern Westerlies: The Laguna Aculeo record (33◦50′S), Quater. Res., 58, 160–170, 2002a.
Jenny, B., Valero-Garc´es, B., Urrutia, R., Kelts, K., Veit, H., Ap-pleby, P. G., and Geyh, M.: Moisture changes and fluctuations of the Westerlies in Mediterranean Central Chile during the last 2000 years: The Laguna Aculeo record (33◦50′S), Quater. Int., 87, 3–18, 2002b.
Kn¨usel, S., Ginot, P., Schotterer, U., Schwikowski, M., Gaeggeler, H. W., Francou, B., Sim˜oes, J. C., Petit, J. R., and Taupin, J. D.: Dating of two nearby ice cores from the Illimani, Bolivia, J. Geophys. Res., 108(D6), 4181, doi:10.1029/2001JD002028, 2002.
Kull, C. and Grosjean, M.: Late Pleistocene climate conditions in the north Chilean Andes drawn from a climate-glacier model, J. Glaciol., 46, 622–632, 2000.
Kull, C., Grosjean, M., and Veit, H.: Modeling Modern and Late Pleistocene glacio-climatological conditions in the North Chilean Andes (29◦S–30◦S), Climate Change, 52(3), 359–381, 2002.
Lamy, F., Hebbeln, D., and Wefer, G.: High resolution marine record of climatic change in mid-latitude Chile during the last 28 000 years based on terrigenous sediment parameters, Quater. Res., 51, 83–93, 1999.
Maldonado, A. and Villagran, C.: Paleoenvironmental changes in the semiarid coast of Chile (32◦S) during the last 6200 cal years inferred from a swamp-forest pollen record, Quater. Res., 58, 130–138, 2002.
Minetti, J. L., Barbieri, P. M., Carletto, M. C., Poblete, A. G., and Sierra, E. M.: El regimen de precipitati`on de la provincia de San Juan, Informe t´ecnico, 8, CIRSAJ-CONICET, San Juan, 1986. Rein, B., L¨uckge, A., and Siroco, F.: A major Holocene ENSO
anomaly during the Medieval period, Geophys. Res. Lett., 31, L17211, doi:10.1029/2004GL020161, 2004.
Sandweiss, D. H.: Terminal Pleistocene through mid-Holocene archaeological sites as paleoclimatic archives for the Peruvian coast, Palaeogeography, Palaeoclimatology, Palaeoecology, 194, 23–40, 2003.
Schotterer, U., Schwarz, P., and Rajner, V.: From pre-bomb levels to industrial times. A complete tritium record from an ice core and its relevance for environmental studies, International Sym-posium on Isotope Technique in the Study of Past and Current Environmental Changes in the Hydrosphere and the Atmosphere, Vienna, 14–18 April 1997, 1998.
Schotterer, U., Stichler, W., and Ginot, P.: The influence of post-depositional effects on ice core studies: examples from the Alps, Andes, and Altai, in: Earth Paleoenvironments: Records pre-served in Mid and Low Latitude Glaciers, edited by: Cecil, L. D., Thompson, L. G., Steig, E. J., and Green, J. R., Kluwer Aca-demic/Plenum Publishers, 2005.
Stichler, W., Schotterer, U., Fr¨ohlich, K., Ginot, P., Kull, C., G¨aggeler, H. W., and Pouyaud, B.: The influence of sublimation on stable isotopes records from high altitude glaciers in the trop-ical Andes, J. Geophys. Res., 106(D19), 22 613–22 621, 2001. Thompson, L. G., Mosley-Thompson, E., Bolzan, J. F., and Koci,
B.: A 1500-Year Record of tropical precipitation in ice core from the Quelccaya ice cap, Peru, Science, 229, 971–973, 1985. Thompson, L. G., Mosley-Thompson, E., Davis, M. E., Lin, P.-N.,
Henderson, K. A., Cole-Dai, J., Bolsan, J. F., and Lui, K.-B.: Late glacial stage and Holocene tropical ice core records from Huascaran, Peru, Science, 269, 46–50, 1995.
Thompson, L. G., Davis, M., Mosley-Thompson, E., Sowers, T. A., Henderson, K. A., Zagorodnov, V. S., Lin, P. N., Mikhalenko, V. N., Campen, R. K., Bolzan, J. F., Cole-Dai, J., and Francou, B.: A 25 000-year tropical climate history from Bolivian ice cores, Science, 282, 1858–1864, 1998.
![Fig. 2. Cerro Tapado ice core: stratigraphy [firn (white), ice (grey), dust layer (hatched black), air bubble shape (white circles and ellipses)]](https://thumb-eu.123doks.com/thumbv2/123dok_br/18200109.333371/3.892.198.699.99.437/cerro-tapado-stratigraphy-hatched-black-bubble-circles-ellipses.webp)


