Microsatellites in Natural Populations of the Malagasy
Plague Reservoir
Charlotte Tollenaere1, Svilena Ivanova1, Jean-Marc Duplantier1, Anne Loiseau2, Lila Rahalison3, Soanandrasana Rahelinirina3, Carine Brouat1*
1Institut de Recherche pour le De´veloppement, UMR CBGP (INRA/IRD/Cirad/Montpellier SupAgro), Montferrier sur Lez, France,2Institut National de la Recherche Agronomique, UMR CBGP (INRA/IRD/Cirad/Montpellier SupAgro), Montferrier sur Lez, France,3Institut Pasteur de Madagascar, Unite´ Peste, Antananarivo, Madagascar
Abstract
Plague (Yersinia pestisinfection) is a highly virulent rodent disease that persists in many natural ecosystems. The black rat (Rattus rattus) is the main host involved in the plague focus of the central highlands of Madagascar. Black rat populations from this area are highly resistant to plague, whereas those from areas in which the disease is absent (low altitude zones of Madagascar) are susceptible. Various lines of evidence suggest a role for the Major Histocompatibility Complex (MHC) in plague resistance. We therefore used the MHC region as a candidate for detecting signatures of plague-mediated selection in Malagasy black rats, by comparing population genetic structures for five MHC-linked microsatellites and neutral markers in two sampling designs. We first compared four pairs of populations, each pair including one population from the plague focus and one from the disease-free zone. Plague-mediated selection was expected to result in greater genetic differentiation between the two zones than expected under neutrality and this was observed for one MHC-class I-linked locus (D20Img2). For this marker as well as for four other MHC-linked loci, a geographic pattern of genetic structure was found at local scale within the plague focus. This pattern would be expected if plague selection pressures were spatially variable. Finally, another MHC-class I-linked locus (D20Rat21) showed evidences of balancing selection, but it seems more likely that this selection would be related to unknown pathogens more widely distributed in Madagascar than plague.
Citation:Tollenaere C, Ivanova S, Duplantier J-M, Loiseau A, Rahalison L, et al. (2012) Contrasted Patterns of Selection on MHC-Linked Microsatellites in Natural Populations of the Malagasy Plague Reservoir. PLoS ONE 7(3): e32814. doi:10.1371/journal.pone.0032814
Editor:Nicolas Salamin, University of Lausanne, Switzerland
ReceivedApril 30, 2011;AcceptedFebruary 6, 2012;PublishedMarch 5, 2012
Copyright:ß2012 Tollenaere et al. This is an open-access article distributed under the terms of the Creative Commons Attribution License, which permits unrestricted use, distribution, and reproduction in any medium, provided the original author and source are credited.
Funding:This work was funded by the Institut de Recherche pour le De´veloppement, the Institut Pasteur de Madagascar and an Agence Nationale pour la Recherche, Sante´-Environnement et Sante´-Travail program on plague diffusion. The funders had no role in study design, data collection and analysis, decision to publish, or preparation of the manuscript.
Competing Interests:The authors have declared that no competing interests exist.
* E-mail: [email protected]
Introduction
Immune genes have been shown to be strongly affected by natural selection [1,2]. In particular, the genes of the Major Histocompat-ibility Complex (MHC) have attracted the attention of evolutionary biologists, because of their extraordinary polymorphism and fundamental role in vertebrate immunity [3]. This genetic complex contains three gene subfamilies [4]. Class I genes are expressed by nucleated somatic cells and play an essential role in defense against intracellular pathogens, as their products present antigens derived from infected cells to cytolytic T-cells. Class II genes are expressed by antigen-presenting cells of the immune system and encode receptors presenting peptides mostly derived from extracellular pathogens to T helper cells. However, the functional difference between these two classes is not clear-cut, as both MHC class I and II may be involved in recognizing endogenous and exogenous antigens [5]. Finally, MHC class III includes a diverse array of structurally unrelated genes, including several involved in innate immunity (e.g., proin-flammatory cytokines, complement components).
Pathogens are thought to be one of the main selective forces acting on the MHC genes of their hosts [3,6]. Pathogen-mediated balancing selection is generally thought to account for the
tremendous diversity observed at MHC loci, but the underlying mechanisms remain debated [6,7]. Three main hypotheses have been proposed: heterozygote advantage, rare-allele advantage and spatio-temporal variation of selective pressures [7]. Pathogen selection pressure may also drive a decrease in genetic diversity at MHC markers through directional selection, with the spread of an advantageous allele (positive selection), or selection against disadvantageous alleles (negative or purifying selection) [8]. Directional selection may occur if a single pathogen strain or species is thought to exert a major selective pressure on the host species considered (see for example [8]). Various studies have shown that natural selection acts on MHC genes and have investigated its underlying mechanisms by comparing the population genetic structure of MHC genes with that of neutral loci (see for example [9,10]; reviewed in [6]). Some of these studies have suggested that variability in pathogen exposure acts as a selective pressure on MHC loci [11,12], but most did not include descriptions of the geographic distribution of pathogen prevalence (but see [13]).
Polymorphism_ [16]). Second, MHC-linked microsatellites may be used, as linkage disequilibrium may stamp loci close to MHC genes with similar signatures of selection [17]. This latter approach has the advantages of allowing the analysis of several MHC loci at a moderate cost. It also allows the use of comparable markers (e.g., microsatellites) for the inference of population genetic structure and detection of signatures of selection [7]. Gene-linked microsatellites have already been shown to be useful for detecting natural selection acting on MHC genes (see for example [17–19]) or other candidate genes [20,21]. The reliability of this indirect approach has been assessed by the observed correlation between the allelic variation of microsatellites and neighboring genes [22] and by the reported association between candidate gene-linked microsatellite diversity and parasite load [23].
Plague (Yersinia pestis infection) is among the most virulent of known pathogens for humans and susceptible rodents, resulting in high mortality rates in natural populations [24,25]. Plague epidemics may therefore exert strong selective pressure on host immune genes. Resistance phenotypes may evolve rapidly in reservoir populations, as suggested by the association between the occurrence of plague and plague resistance reported forOnychomys leucogasterin North America [26] andMastomys natalensisin South Africa [27]. This would also be the case for the black rat (Rattus rattus), the main reservoir of plague in Madagascar [28].
Plague was first reported in Madagascar in 1898. Areas of the central highlands of this country, at elevations above 800 meters have represented a plague focus since the 1920s, with hundreds of human cases reported each year and circulation within rodent populations. By contrast, there is no evidence of plague circulation in rural areas of the lowland zone of Madagascar [28,29]. The black rat is usually considered to be highly susceptible to plague [24]. However, theR. rattuspopulations from the Malagasy plague
focus (central highlands) are much more resistant (LD50 1000
times higher) than black rat populations from plague-free zones (low altitude regions) [30,31]. This resistance is transmitted to laboratory-born descendants [30], suggesting a genetic basis.
MHC genes may be involved in the genetics of plague resistance. Indeed, a recent quantitative genetics study showed the presence of a resistance locus (which remains to be precisely identified) within the MHC region in the laboratory mouse [32]. In addition, various laboratory studies have demonstrated the potential importance of MHC products for the immune response
to plague. Indeed, Y. pestis epitopes have been shown to be
recognized by MHC class II receptors of the laboratory mouse [33], as expected for this mostly extracellular pathogen [34]. However, MHC class I molecules may also be involved, as human cytolytic T cells are stimulated during Y. pestis infection [35]. Finally, the Tnf-a (Tumor necrosis factor) gene, an MHC class III gene, encodes the proinflammatory cytokine TNF-a, which has been shown to protect against Y. pestis experimental infection in laboratory mice ([36,37], see also [38]).
This study uses the MHC gene family as candidate for plague resistance in wild populations of MalagasyR. rattus. In addition to shedding light on the theoretical question of the way in which selection shapes MHC variation in wild rodents, this research is a step towards a better understanding of plague circulation in the central highlands of Madagascar, which remains one of the most important plague foci in the world [24,39]. To this purpose, we used a population genetics approach based on the comparison of MHC-linked and neutral microsatellites in two contrasting population designs. The first dataset focuses on four pairs of populations, each consisting of one population from within and another from outside the plague focus of Madagascar (Figure 1 and Table 1). In this so-called ‘‘Madagascar’’ dataset,
plague-driven divergent selection within these pairs of populations may imply higher levels of genetic differentiation at MHC markers than at neutral markers [3]. However, the presence of plague is not the only selective environmental factor characterizing the Malagasy plague focus. Elevation and the ecological conditions typical of regions more than 800 m above sea level may also have an effect. We thus also used a metapopulation sampling within a restricted area of the plague focus in which human cases of plague are reported annually (Figure 1 and Table 1). As plague is likely to exert a uniform selection pressure on theR. rattuspopulations of this area, the level of genetic differentiation at MHC markers found to be under divergent selection in the Madagascar dataset would be expected to be lower than that for neutral markers in the so-called ‘‘Betafo’’ dataset [40]. Alternatively, spatial variation in plague selection pressure may result in more marked geographic patterns of genetic differentiation at these markers than at neutral markers [3].
Results
Studied loci and within-population analyses
Five MHC-linked microsatellite markers designed on the basis
of genome sequence of R. norvegicus were analyzed, each
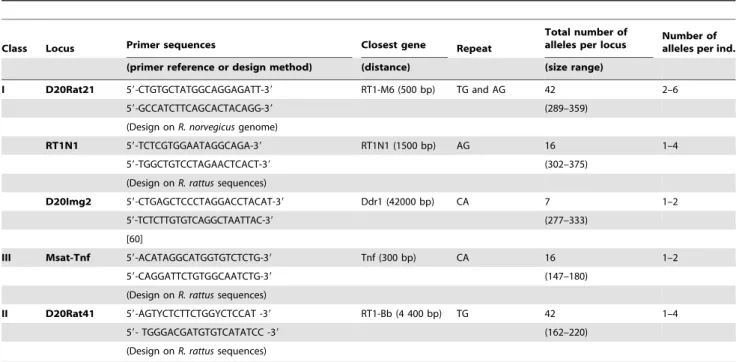
corresponding to one of the three MHC classes [4] (Table 2). These five MHC-linked loci comprised two (Msat-Tnf and D20Img2) present as single copies (maximum of two alleles per individual), and three duplicated loci: RT1N1 and D20Rat41 were present as two copies and D20Rat21 was present as three copies at least (the locus D20Rat21 was also found to be duplicated inR. norvegicus[41], but no such information was found for RT1N1 and D20Rat41). A set of 13 previously described microsatellites (see methods) was used as a control for non-selective factors and is referred to as ‘‘presumed neutral microsatellites’’.
Linkage disequilibrium (LD) and Hardy-Weinberg (HW) tests were performed on non duplicated MHC-linked and presumed neutral microsatellites, for the both datasets. LD tests gave significant results after correction for multiple testing in 15 of 2087 cases. These significant tests accounted for only 0.7% of the tests carried out and concerned various locus pairs and populations. The 15 non duplicated loci were thus considered independent. HW tests indicated significant heterozygote defi-ciencies for some loci (Rr67, D11R56, D11M5, Msat-Tnf) that can be explained by null alleles following Micro-checker. Mean null alleles frequencies estimated using FreeNA over the 20 populations were however lower than 0.05 for these loci (table S1), having therefore little chance to bias genetic differentiation estimates [42], and thus outlier detection. None of the HW tests for heterozygote excess were significant for the two non duplicated MHC-linked loci: Msat-Tnf and D20Img2.
Detecting signatures of selection for the Madagascar dataset
For the Madagascar dataset, two model-based approaches were used to search for selection signatures (Fdist2 [43] and DetSel [44,45]) in the two non duplicated MHC-linked and the 13 presumed neutral microsatellites. For MHC-linked loci, D20Img2
alone had a higherFSTthan expected under neutrality in some
population pairs, in both Fdist2 (AIT/TSO:p= 0.003; marginally significant probability for FIR/MAE:p= 0.052) and DetSel (AIT/
TSO:p= 0.018; AAM/ALA:p= 0.02) (Table 3 and figures S1 and
S3). Msat-Tnf was not detected as outlier in any comparison (Table 3 and figures S1 and S2). However, a few presumed neutral loci were found to have significantly higherFSTin some population
The pairwise FST comparisons carried out between
MHC-linked microsatellites (either duplicated or not) and neutral loci (globalFST) within each population pair of the Madagascar dataset
are presented in Figure 2. HigherFSTwas obtained for and the
locus D20Img2 in the population pair AIT-TSO (p-value obtained through bootstrapping over individuals:p= 0.007), in accordance with the results obtained with the simulation-based programs (see above). The duplicated loci D20Rat21 had significantly lowerFST
values than neutral markers in the four population pairs (p= 0.001
for AAM-ALA,p= 0 for AIT-TSO,p= 0.001 for FIR-MAE and
p= 0.005 for MATo-VEL). Finally, the duplicated locus RT1N1
had low genetic differentiation estimate only in the population pair FIR-MAE (p= 0.033).
Detecting signatures of selection for the Betafo dataset For the Betafo dataset, the two non-duplicated MHC-linked microsatellites had overallFSTvalues within the envelope expected
under neutrality, by Beaumont’s method [43] (Fdist2 program, data not shown) and were therefore not identified as being subject to natural selection (p= 0.260 for Msat-Tnf and p= 0.338 for
D20Img2). However, two presumed neutral microsatellite loci were found to be subject to purifying selection: Rr017 (p= 0.037)
and Rr054 (p= 0.040). Significant isolation by distance was
observed for neutral markers (p= 0.005). Partial Mantel tests with neutral microsatellite variation kept constant showed a positive effect of geographic distance on D20Rat41 (r2= 12.9;p= 0.003), RT1N1 (r2= 16.8;p= 0.001), D20Img2 (r2= 10.4;p= 0.006) and
Msat-Tnf (r2= 11.4; p= 0.005) (Table 4). By contrast, the
duplicated locus D20Rat21 presented no significant evidence of
isolation by distance (Table 4) and its mean FST value
(0.01460.008) indicated weaker genetic differentiation than for neutral loci (95% CI = (0.05; 0.07)).
Discussion
In this study, we developed five MHC-linked microsatellites from the three classes of the MHC gene family in R. rattus. No linkage disequilibrium was found between the two non duplicated MHC-linked loci, Msat-Tnf and D20Img2 (this analysis was not possible for the duplicated loci), which are about 500 kb apart Figure 1. Location of the sampled sites.For the Madagascar dataset, each population pair, consisting of one population from the plague focus and one from the plague-free zone, is identified by a different symbol. The principal Malagasy plague focus is outlined by a black dotted line and the region of Betafo is outlined in grey.
Table 1.List of the populations analyzed in this study.
MADAGASCAR DATASET
Population name
Distance
(km) Zone Sampling year Sample size HE(13 presumed neutral markers)±S.E.
AAM 140 C.H. 2000 28 0.71460.138
ALA L.A. 1999 27 0.75060.125
AIT 139 C.H. 2006 22 0.71760.118
TSO L.A. 2007 22 0.72360.144
FIR 128 C.H. 1999 28 0.69560.165
MAE L.A. 1999 21 0.70660.185
MAto 103 C.H. 1996 28 0.68160.170
VEL L.A. 2000 22 0.69760.128
BETAFO DATASET
Population name Village Sample size HE(13 presumed neutral markers)
ApgE Amparihimboahangy 15 0.66360.182
ApgM 20 0.68760.142
AlnE Ambatomilona 15 0.66760.213
AlnM 20 0.67060.189
AtnE Antanetikely 14 0.72760.165
AhyM Ambatolahy 20 0.69360.171
VniE Vinanisoa 20 0.67160.137
VniM 20 0.70560.171
MkfE Miraikofeno 14 0.71760.163
MkfM 20 0.70460.206
AklE Ankelaka 20 0.66060.158
AklM 16 0.71560.137
Sample sizes and genetic diversity (expected heterozygosity: HE) are shown. C.H.: central highlands; L.A.: lowland areas. doi:10.1371/journal.pone.0032814.t001
Table 2.Characteristics of the five MHC-linked microsatellites loci analyzed in this study.
Class Locus Primer sequences Closest gene Repeat
Total number of
alleles per locus Number ofalleles per ind.
(primer reference or design method) (distance) (size range)
I D20Rat21 59-CTGTGCTATGGCAGGAGATT-39 RT1-M6 (500 bp) TG and AG 42 2–6
59-GCCATCTTCAGCACTACAGG-39 (289–359)
(Design onR. norvegicusgenome)
RT1N1 59-TCTCGTGGAATAGGCAGA-39 RT1N1 (1500 bp) AG 16 1–4
59-TGGCTGTCCTAGAACTCACT-39 (302–375)
(Design onR. rattussequences)
D20Img2 59-CTGAGCTCCCTAGGACCTACAT-39 Ddr1 (42000 bp) CA 7 1–2
59-TCTCTTGTGTCAGGCTAATTAC-39 (277–333)
[60]
III Msat-Tnf 59-ACATAGGCATGGTGTCTCTG-39 Tnf (300 bp) CA 16 1–2
59-CAGGATTCTGTGGCAATCTG-39 (147–180)
(Design onR. rattussequences)
II D20Rat41 59-AGTYCTCTTCTGGYCTCCAT -39 RT1-Bb (4 400 bp) TG 42 1–4
59- TGGGACGATGTGTCATATCC -39 (162–220)
(Design onR. rattussequences)
within the R. norvegicus genome. The MHC is characterized by islands of strong linkage disequilibrium, interspersed with recombination hotspots. Many factors, such as the selective and demographic history of the populations, may have a major effect on recombination patterns [46]. The absence of significant linkage disequilibrium between MHC loci was not surprising, as the islands of strong linkage disequilibrium have been estimated to cover about 50 kb in the human MHC class II region [47], and recombination hotspots appear to be largely conserved between mammalian species [48]. Our results show that different selective pressures affected the MHC-linked microsatellites studied, as frequently reported in previous studies, even for markers from the same MHC class (see for example [10,11,49,50]).
As parasite-mediated selection is thought to be the driving force behind MHC evolution, pathogens (rather than other non pathogenic selective pressures) may account for the selection signatures of MHC-linked markers [6]. In Madagascar, plague is the only known highly virulent pathogen capable of differentiating
between the R. rattuspopulations of the highlands and lowland
areas [51]. We therefore have good reason to think that the selection signatures detected for the MHC-linked markers in this study will enable us to identify valuable candidate genes for plague resistance.
Firm evidence was obtained for natural selection acting on the D20Img2 locus, which presented levels of differentiation higher than expected under neutrality in some population pairs of the Madagascar dataset, whether in analyses based on two simulation-based programs (Fdist2 or DetSel) or using an empirical test. A few presumed neutral loci also displayed significant levels of differen-tiation (Table 3), but D20Img2 was more frequently detected as an outlier. This pattern may be interpreted as a signal of directional selection between the plague focus and the plague-free zone, as expected in conditions of plague-mediated selective pressure. We therefore expected D20Img2 to display a lower level of differentiation than neutral markers within the Betafo dataset, in which every population was assumed to be subject to plague selection. Instead, we showed an effect of geographic location on both loci, after controlling for demographic and stochastic factors. This geographic pattern within the plague focus may reflect spatial
heterogeneity in plague selective pressures between R. rattus
populations and the occurrence of spatially localized epizootics and epidemics. This would be consistent with the spatial clustering of human plague cases reported in the Betafo region, and the high variability of plague seroprevalence (between 0% and 44% [52]) in
the rat populations studied. Spatial heterogeneity in plague selection pressure may also account for the detection of selection signatures in only some of the population pairs of the Madagascar dataset: those at sites within the plague focus at which human plague cases had been recorded in the last ten years (AIT in 2003 and AAM in 1998; database of the Malagasy Health Ministry). Alternatively, the genetic diversity of plague bacteria may imply geographic variation in the type of selective pressure. Indeed, a recent study was able to detect genetic diversity in plague bacterial strains isolated from patients in Madagascar [53]. Our four central highlands populations in the Madagascar dataset are located in regions where isolated strains were different; and even at the small spatial scale of the region investigated for the Betafo dataset, at least two plague genotypes were found. These different strains would however consist in different selective pressure only if they not only vary for neutral loci but also in their infection phenotype, but the latter was not investigated to date.
For the other four MHC-linked markers, the evidence for a selection signature were either weak or selection was less clearly related to plague. Indeed, an effect of geographic location, after controlling for demographic and stochastic factors, was also found for D20Rat41, Msat-Tnf and RT1N1. However, as no selection signature was obtained for these markers in the Madagascar dataset, the geographic pattern observed may not be specifically plague-mediated. Instead, it may be accounted for by the spatial variation of other selective pressures within the studied area of the plague focus, probably mediated by unidentified pathogens. The lack of a clear selective signal on these MHC markers does not however imply that there is no plague-mediated selection acting on the related MHC regions. Indeed, the main drawback of the MHC-linked microsatellite approach lies in the low reliability of negative results as an absence of selection signal may only be due to a low linkage disequilibrium between the gene under selection and the studied microsatellite. Finally, the lowFSTestimates found
in the duplicated locus D20Rat21 for both the Madagascar and Betafo datasets probably result from balancing selection [40]. The low genetic differentiation between plague focus and plague-free zone suggests similar selective pressures in these two regions. Consequently, balancing selection acting on D20Rat21 could most likely be exerted by undetermined pathogens homogeneously distributed in Madagascar.
The intensity of plague-mediated natural selection observed in this study did not depend on the distance between microsatellite
markers and identified MHC candidate genes. The besta priori
Table 3.Results of population differentiation tests for the Madagascar dataset analyses.
Population pair
AAM-ALA AIT-TSO FIR-MAE MATo-VEL
Fdist2 analysis Msat-Tnf 0.441 0.226 0.272 0.457
D20Img2 0.167 0.003 0.052 0.207
Supposed neutral loci revealing significant (p-value)
Rr067 (0.017) D11R56 (0.006)
D10R20 (0.045)
Rr067 (0.026) D7R13 (0.023)
Rr014 (0.005) Rr054 (0.011)
DetSel analysis Msat-Tnf 0.61 0.41 0.84 0.49
D20Img2 0.024 0.018 0.102 0.159
Supposed neutral loci revealing significant (p-value)
D11R56 (0.003) Rr093 (0.003) D10R20 (0.049) Rr114 (0.039)
D7R13 (0.001)
Thep-values associated with each of the two tests (Fdist2 [43] and DetSel [44,45] analyses) for each of the four population pairs are reported for the two MHC-linked loci: Msat-Tnf and D20Img2. The supposedly neutral microsatellites for which a significant result was obtained in the analyses are also indicated, together with theirp -values (in the case of Fdist2 analysis, all the presumed neutral loci revealing significant had FSThigher than expected).
candidate among the five markers investigated was Msat-Tnf, because this marker was the closest to an identified gene (230 bp
from Tnf in the R. norvegicus genome) and various studies have
shown that the cytokine TNF-a plays an important role in host
defense against plague (see introduction). However, this marker showed no clear evidence of plague-mediated selection. By contrast, the D20Img2 locus, for which stronger evidence of plague-mediated selection was obtained with both datasets, was
located further from any known MHC gene in the R. norvegicus
genome. The closest MHC gene to D20Img2 was Ddr1 (epithelial Discoidin domain receptor 1, 42 kb from D20Img2), which has no known function in defense against pathogens. The Ier3 (Immedi-ate early response 3, loc(Immedi-ated about 77 kb from D20Img2) gene,
which encodes a protein involved in T-cell proliferation (according to the Ensembl database) and apoptosis [54], is the most probable best candidate for pathogen-mediated natural selection in the vicinity of D20Img2.
In terms of the selection mechanisms acting on MHC-linked loci, we found no evidence of heterozygote advantage, as non duplicated loci (D20Img2 and Msat-Tnf) were at Hardy-Weinberg equilibrium. As in other studies (reviewed in [6]), it remains possible that the selection of heterozygotes is not strong enough to be detected within a single generation [3]. Spatial variation in selective pressure was observed for all MHC-linked loci except D20Rat21, through geographic effects in the Betafo dataset and the highFSTfor D20Img2 found within the population pairs in the
Figure 2. Comparison of pairwise population differentiation levels (FST) between the five MHC-linked microsatellites and the
neutral loci for the Madagascar’s dataset.The points correspond to the meanFSTobtained over 1000 bootstrap and the error bars to the 95% confidence intervals (determined .from the 25thand 975thvalue in the ranked list of 1000 bootstrapF
STvalues). The neutral values are estimates from the global dataset of 13 presumed-neutral microsatellites. * indicate the MHC-linked markers significantly differing from neutral microsatellites forFST estimates.
Madagascar dataset. Plague-specific seroprevalence levels differed markedly within the plague focus region studied (see above), and a fortiori between the plague focus and the plague-free zone. Unfortunately, comparing allelic frequencies between seropreva-lence categories within each population was not possible here because the sample size was too small given the number of alleles. However, this type of analysis would improve characterization of the spatial variability of plague-mediated selective pressure. Consequently, as in other studies reporting an effect of geographic location on the spatial genetic structure of MHC genes [11,12,55] or higher differentiation than for neutral loci [9,11], our study highlights the need to characterize the variability of pathogen exposure more accurately, for evaluation of the contribution of pathogen-mediated fluctuating selection to these patterns.
Materials and Methods
Rat sampling
Field sampling was carried out systematically by joint teams comprising staff from the IRD (Institut de Recherche pour le De´veloppement), from the IPM (Institut Pasteur de Madagascar) and from the Malagasy Ministry of Health (Communicable Disease Control Department). Each trapping campaign was validated by the national, regional and local health authorities. Rats were caught alive in wire-mesh and Sherman traps placed within houses and outdoors, according to a previously described protocol [56]. Outside houses, traps were set with the agreement of the village head, and always on the edge of cultivated fields, so as not to cause any damage in crops. Within houses, traps were set after the approval of the owner or tenant of the house. The only sampled rodents were introduced rodents (house mouse, black rat
and Norway rat), which are classified as harmful and with no protected status in Madagascar. No permission was therefore required for their capture.
Animals were euthanized by cervical dislocation once trapped (as previously recommended [57]). Madagascar has no ethics committee that oversees animal experimentation, and the IRD has no ethics board to review animal experimentation protocols. However, the ANR-SEST (Agence Nationale pour la Recherche, Sante´-Environnement et Sante´-Travail) program on plague diffusion, which partially funded this project, has been approved by the managing director of the IRD. Additionally, regional approval was obtained from the regional head of veterinary service (He´rault, France), for the rodent sampling, euthanasia and tissue harvesting (approval no. B 34-169-1) carried out during this study. An autopsy was carried out and a piece of ear or tail was stored in 95% ethanol for genetic analyses.
The Madagascar dataset consisted of four pairs of populations, each consisting of one population from the plague focus and one from the plague-free zone, separated by a distance of 103 to 140 km (Figure 1, Table 1). These populations were sampled between 1996 and 2007, but each population pair was sampled in less time (maximum 4 years, Table 1) so that temporal variation is unlikely to drastically affect our results. The Betafo dataset consisted of 12 populations from seven villages sampled between
2006 and 2007 within an area of 150 km2close to the town of
Betafo, within the plague focus. In this area, the most recent human plague cases were reported in 2004. At least 14 rats were trapped at each study site (see Table 1 for sample sizes).
MHC-linked microsatellite loci
The MHC-linked microsatellites used in this study onR. rattus
were inferred fromR. norvegicusgenome. Indeed, the two species only diverged 2.9My ago [58], and the gene syntheny was shown to be extremely high between both species [59]. Consequently, it appears safe to assume that locations of the studied microsatellites are the same inR. rattusas in R. norvegicus. We obtained specific primers for five MHC-linked microsatellites (Table 2). Previously published primers, designed for use inR. norvegicus, were used for
the D20Img2 locus [60]. We used the R. norvegicus genome
sequence to design primers for the D20Rat21 locus. Finally, the primers used for the three other loci (D20Rat41, RT1.N1 and Msat-Tnf) were designed into two steps: amplification of the R. rattussequences withR. norvegicusprimers, followed by sequencing and the design of primers more specific toR. rattus, based on the sequences obtained. The distance between each MHC-linked microsatellite and the closest known MHC gene was between 300 and 42,000 bp inR. norvegicus(Table 2).
Molecular biology methods
Genomic DNA was extracted from rat tissues with the DNeasyH
Tissue Kit (Qiagen), according to the manufacturer’s instructions. Two final elutions, each in 50ml of AE buffer were carried out.
We genotyped 13 presumed neutral microsatellites as previously described [56,61]. All these loci are polymorphic (5–20 alleles per population) dinucleotide microsatellites.
The MHC-linked microsatellites were amplified in two multiplex PCRs: one for Msat-Tnf and RT1N1 (PCR1) and the other for D20Rat41, D20Rat21 and D20Img2 (PCR2). Both PCRs were performed in a final volume of 10ml, containing 0.2ml
of each primer, 5ml of multiplex premix (Qiagen) and DNA (2ml
for PCR1, and 1ml for PCR2). The two PCRs were performed
according to the same program: initial denaturation (15 min at 95uC), followed by 35 cycles of denaturation (30 s at 94uC), hybridization (90 s at 60uC) and elongation (60 s at 72uC), and a Table 4.Partial Mantel tests carried out on the Betafo dataset
for each of the five MHC-linked microsatellites.
Locus Model Partial Mantel
R2(%) P
D20Rat21 Global model 5.13 0.1906
Geography 0 0.3978
Neutral 2.43 0.155
Geography*Neutral 0.93
RT1N1 Global model 17.05 0.0029
Geography 16.77 0.001
Neutral 0 0.8457
Geography*Neutral 0.25
D20Img2 Global model 12.18 0.0162
Geography 10.38 0.0063
Neutral 3.78 0.1134
Geography*Neutral 21.99
Msat-Tnf Global model 14.14 0.008
Geography 11.45 0.0049
Neutral 0.91 0.4627
Geography*Neutral 1.76
D20Rat41 Global model 22.12 0.0008
Geography 12.87 0.0034
Neutral 5.15 0.0674
Geography*Neutral 4.06
final extension (30 min at 72uC). All PCR products for MHC-linked microsatellites were pooled together in a single run, and were detected with an automated ABI Prism 3130XL sequencer (Applied Biosystems). Electrophoretic gels were read with GeneMapper 3.7 (Applied Biosystems). Stuttering was relatively low in duplicated loci, and profiles were mostly clear. Each individual with an ambiguous profile was however re-amplified once by simple PCR (to avoid primer competition), and considered as a null genotype when ambiguity remains (less than 4% of the genotyped individuals).
Data analysis
For non-duplicated MHC-linked and presumed neutral loci, we checked for Hardy-Weinberg equilibrium and genotypic linkage disequilibrum between pairs of loci with Genepop v. 4 [62]. In both cases, we corrected for multiple testing by the false discovery rate (FDR) approach, with Q-value software (available from
http://genomics.princeton.edu/storeylab/qvalue/); the tuning
parameter l was fixed at 0 [63]. As some loci exhibited
heterozygote deficiencies, we used MICRO-CHECKER2.2.3 [64] to evaluate whether it could be explained by the occurrence of null
alleles. We then used the software FREENA (INRA Montpellier
website, available www.montpellier.inra.fr/URLB, accessed 2012 February 7) [42] to verify that mean null allele frequencies were low at these loci, as high null alleles frequencies can impact genetic differentiation estimations [42].
Under the hypothesis of overdominance (or heterozygote advantage, see introduction), an excess of heterozygotes would be expected at MHC loci. We thus tested for Hardy-Weinberg disequilibrium (H1: heterozygote excess) within each studied population for the two non duplicated MHC-linked loci using Genepop program. The FDR approach was also used to correct for multiple testing.
For the ‘‘Madagascar’’ dataset, we expected the level of genetic differentiation to be higher for MHC-linked microsatellites than for neutral loci within population pairs. We evaluated the deviation from neutrality for all non-duplicated MHC-linked and presumed neutral microsatellites, using two approaches for the detection of selection, based on theFSTvalues for each of the four
population pairs. We first used the method of Beaumont & Nichols [43], as implemented in Fdist2 (available at http://www.rubic.rdg. ac.uk/,mab/software.html). This approach uses an island model
and simulates the distribution ofFSTconditioned on
heterozygos-ity, under the null hypothesis of drift and migration only. We carried out 50,000 simulations of two demes, assuming a stepwise mutation model. We then used the Vitalis et al. [44] method, implemented in DetSel software [45]. This method performs coalescent simulations under a divergence model in which an ancestral population splits into two isolated populations. The simulations were performed with a stepwise mutation model and a mean mutation ratem= 0.0005. We used several different values for ancestral population size (Ne= 1,000, 10,000, 100,000), and the
time since divergence was set at 1,200 generations (because R.
rattusprobably colonized the central highlands about 700 years ago [65]). For each pairwise analysis, we performed a total of 1,000,000 simulations, with each set of nuisance parameter values representing a third of the total simulations. We applied a minimum allele frequency of 0.01 to the observed and simulated data.
We then used a method similar to the one described in Neff & Fraser [66] to empirically compare the pairwiseFSTvalue for each
MHC-linked (duplicated and non-duplicated) locus with the global
FSTfor the neutral loci within the four population pairs. For each of the five MHC-linked markers, as well as for the global neutral
dataset (13 loci), 1000 datasets were obtained by bootstrapping over individuals. For all the datasets, pairwiseFSTwere computed within each population pair from allelic frequencies (see also [12,55]) using the package Arlecore from Arlequin v 3.5 software [67]. Note that allelic frequencies cannot be directly estimated for the duplicated microsatellites (data available only consist in allele presence/absence, genotypes may be unknown). Allelic frequen-cies were thus inferred from the number of individuals carrying a given allele divided by the total number of alleles observed in a population (see also [12,55]). The proportion of bootstrap
replicates in which theFST of MHC-linked markers were higher
or lower than neutral FST was used as p-value for the null
hypothesis that one of MHC-linked markers had higher or lower
FSTthan the neutral markers (see also [66]).
For the ‘‘Betafo’’ dataset, we expected the level of genetic differentiation to be lower for MHC-linked microsatellites than for presumed neutral loci, provided that the selection pressure exerted by plague was uniform over the whole area [40]. We tested this hypothesis for non duplicated microsatellites, with Fdist2 (with the same parameters as for the analysis of the Madagascar dataset, see above). We did not use DetSel on the ‘‘Betafo’’ dataset: it does not conform to the model of a single ancestral population diverging into two isolated populations with no migration between them, as it corresponds to a small scale metapopulation sampling design.
A significant isolation by distance (IBD) pattern was found for presumed neutral microsatellites within the ‘‘Betafo’’ dataset (as already reported [52]). For each MHC-linked locus, we performed partial Mantel tests [68], which evaluated the correlative link
between the pairwise FST at the MHC locus and geographic
distance while keeping constant differentiation at neutral micro-satellites (excluding those identified by FDist2 as corresponding to selection signature in the ‘‘Betafo’’ dataset). Under the hypothesis of strong selection pressures acting on MHC loci, we would expect a lower isolation by distance pattern than under neutrality for these loci. PairwiseFSTvalues were estimated for each locus with
Genepop v. 4 for non duplicated loci, or from allelic frequencies for duplicated loci. Partial Mantel tests were performed with Fstat v. 2.9.3.2 [69], with 20,000 permutations.
Supporting Information
Figure S1 Selection signatures detected with Beaumont & Nichols’s approach (Fdist2 program[43]) applied to the Madagascar dataset and the 15 loci: Msat-Tnf, D20Img2 and the 13 apparently neutral microsatellites.The analysis was performed for the four population pairs, each consisting of one population from the plague focus and one population form the plague-free zone. Genetic differentiation between the two popula-tions (FST) is plotted against heterozygosity. Median and 95%
confidence interval are indicated with solid lines, whereas the 99% confidence interval is indicated with a dotted line.
(PDF)
Figure S2 Results of the test of natural selection for Msat-Tnf, carried out with the method of Vitalis et al.(DetSel program [44,45]) for the four population pairs studied for the Madagascar dataset. Genetic differentiation for the first population (F1) is plotted against genetic differentiation for the second population
(F2).
(PDF)
Figure S3 Results of the test of natural selection for D20Img2, carried out with the method of Vitalis et al.
population (F1) is plotted against genetic differentiation for the
second population (F2).
(PDF)
Table S1 Null allele frequencies estimates obtained
using FreeNA software [42] for each of the 15 non duplicated microsatellite loci in the 20 populations.
(PDF)
Acknowledgments
We are grateful to the staff of the Plague Laboratory of theInstitut Pasteur de Madagascarfor their excellent assistance during the fieldwork, to Sylvain Piry for creating the datasets and formatting the results of the boostrap
analysis and to Renaud Vitalis for assistance with statistical analyses carried out with DetSel. We warmly thank Nathalie Charbonnel as well as anonymous reviewers for helpful comments that significantly improved the manuscript. The data used in this work were generated through use of the molecular genetic analysis technical facilities of IFR119 ‘‘Montpellier Environnement Biodiversite´’’.
Author Contributions
Conceived and designed the experiments: CT JMD LR CB. Performed the experiments: SI AL CT. Analyzed the data: CT SI CB. Contributed reagents/materials/analysis tools: CT JMD SR LR CB. Wrote the paper: CT CB.
References
1. Jiggins FM, Kim KW (2007) A screen for immunity genes evolving under positive selection in Drosophila. Journal of Evolutionary Biology 20: 965–970. 2. Vallender EJ, Lahn BT (2004) Positive selection on the human genome. Human
Molecular Genetics 13: R245–R254.
3. Bernatchez L, Landry C (2003) MHC studies in nonmodel vertebrates: what have we learned about natural selection in 15 years?. Journal of Evolutionary Biology 16: 363–377.
4. Hurt P, Walter L, Sudbrak R, Klages S, Muller I, et al. (2004) The genomic sequence and comparative analysis of the rat major histocompatibility complex. Genome Research 14: 631–639.
5. Vyas JM, Van der Veen AG, Ploegh HL (2008) The known unknowns of antigen processing and presentation. Nature Reviews Immunology 8: 607–618. 6. Piertney SB, Oliver MK (2006) The evolutionary ecology of the Major
Histocompatibility Complex. Heredity 96: 7–21.
7. Spurgin LG, Richardson DS (2010) How pathogens drive genetic diversity: MHC, mechanisms and misunderstandings. Proceedings of the Royal Society of London B 277: 979–988.
8. Teacher AGF, Garner TWJ, Nichols RA (2009) Evidence for directional selection at a novel major Histocompatibilty Class I marker in wild common frogs (Rana temporaria) exposed to a viral pathogen (Ranavirus). PLoS One 4(2): e4616.
9. Aguilar A, Garza A (2006) A comparison of variability and population structure for major histocompatibility complex and microsatellite loci in California coastal steelhead (Oncorhynchus mykissWalbaum). Molecular Ecology 15: 923–937. 10. Evans ML, Neff BD, Heath DD (2010) MHC genetic structure and divergence
across populations of Chinook salmon (Oncorhynchus tshawytscha). Heredity 104: 449–459.
11. Bryja J, Charbonnel N, Berthier K, Galan M, Cosson JF (2007) Density-related changes in selection pattern for major histocompatibility complex genes in fluctuating populations of voles. Molecular Ecology 16: 5084–5097. 12. Loiseau C, Richard M, Garnier S, Chastel O, Julliard R, et al. (2009)
Diversifying selection on MHC class I in the house sparrow (Passer domesticus). Molecular Ecology 18: 1331–1340.
13. Dionne M, Miller KM, Dodson JJ, Caron F, Bernatchez L (2007) Clinal variation in MHC diversity with temperature: Evidence for the role of host-pathogen interaction on local adaptation in Atlantic salmon. Evolution 61: 2154–2164.
14. Babik W, Taberlet P, Jan Ejsmond M, Radwan J (2009) New generation sequencers as a tool for genotyping of highly polymorphic multilocus MHC system. Molecular Ecology Research 9: 713–719.
15. Galan M, Guivier E, Caraux G, Charbonnel N, Cosson J-F (2010) A 454 multiplex sequencing method for rapid and reliable genotyping of highly polymorphic genes in large-scale studies. BMC Genomics 11: 296.
16. Bryja J, Galan M, Charbonnel N, Cosson J-F (2005) Analysis of major histocompatibility complex class II gene in water voles using capillary electrophoresis-single stranded conformation polymorphism. Molecular Ecology Notes 5: 173–176.
17. Santucci F, Ibrahim KM, Bruzzone A, Hewit GM (2007) Selection on MHC-linked microsatellite loci in sheep populations. Heredity 99: 340–348. 18. Charbonnel N, Pemberton J (2005) A long-term genetic survey of an ungulate
population reveals balancing selection acting on MHC through spatial and temporal fluctuations in selection. Heredity 95: 377–388.
19. Hansen MM, Skaala O, Jensen LF, Bekkevold D, Mensberg KLD (2007) Gene flow, effective population size and selection at major histocompatibility complex genes: brown trout in the Hardanger Fjord, Norway. Molecular Ecology 16: 1413–1425.
20. Jensen LF, Hansen MM, Mensberg KL, Loeschcke V (2008) Spatially and temporally fluctuating selection at non-MHC immune genes: evidence from TAP polymorphism in populations of brown trout (Salmo trutta, L.). Heredity 100: 79–91. 21. Oetjen K, Ferber S, Dankert I, Reusch TBH (2010) New evidence for habitat-specific selection in Wadden SeaZostera marinapopulations revealed by genome scanning using SNP and microsatellite markers. Marine Biology 157: 81–89. 22. Doxiadis GGM, de Groot N, Claas FHJ, Doxiadis IIN, van Rood JJ, et al. (2007)
A highly divergent microsatellite facilitating fast and accurate DRB haplotyping
in humans and rhesus macaques. Proceedings National Academy of Science USA 104: 8907–8912.
23. Luikart G, Pilgrim K, Visty J, Ezenwa VO, Schwartz MK (2008) Candidate gene microsatellite variation is associated with parasitism in wild bighorn sheep. Biology Letter 4: 228–231.
24. Dennis DT, Gage KL, Gratz N, Poland J, Tikhomirov E Plague manual: epidemiology, distribution, surveillance and control: Geneva.
25. Stenseth NC, Atshabar BB, Begon M, Belmain SR, Bertherat E, et al. (2008) Plague: past, present and future. PLoS Medicine 5(1): e3. doi:10.1371/ journal.pmed.0050003.
26. Thomas RE, Barnes AM, Quan TJ, Beard ML, Carter LG, et al. (1988) Susceptibility toYersinia pestisin the northern grasshopper mouse (Onychomys leucogaster). Journal of Wildlife Disease 24: 327–333.
27. Shepherd AJ, Leman PA, Hummitzsch DE (1986) Experimental plague infection in South-African wild rodents. Journal of Hygiene 96: 171–183. 28. Brygoo ER (1966) Epide´miologie de la peste a` Madagascar. Archives de l’Institut
Pasteur de Madagascar 35: 9–147.
29. Migliani R, Chanteau S, Rahalison L, Ratsitorahina M, Boutin JP, et al. (2006) Epidemiological trends for human plague in Madagascar during the second half of the 20th century: a survey of 20 900 notified cases. Tropical Medicine and International Health 11: 1228–1237.
30. Rahalison L, Ranjalahy M, Duplantier J-M, Duchemin J-B, Ravelosaona J, et al. (2003) Susceptibility to plague of the rodents in Antananarivo, Madagascar
The genus Yersinia. Kluwer Academic/Plenum Publishers: New York. 31. Tollenaere C, Rahalison L, Ranjalahy M, Duplantier JM, Rahelinirina S, et al.
(2010) Susceptibility toYersinia pestisinfection in wildRattus rattus, reservoir of plague in Madagascar. EcoHealth 7: 242–247.
32. Turner JK, McAllister MM, Xu JL, Tapping RI (2008) The resistance of BALB/cJ mice to yersinia pestis maps to the Major Histocompatibility Complex of chromosome 17. Infection and Immunity 76: 4092–4099.
33. Shim HK, Musson JA, Harper HM, McNeill HV, Walker N, et al. (2006) Mechanisms of major histocompatibility complex class II-restricted processing and presentation of the V antigen ofYersinia pestis. Immunology 119: 385–392. 34. Pujol C, Bliska JB (2005) Turning Yersinia pathogenesis outside in: subversion of macrophage function by intracellular yersiniae. Clinical Immunology 114: 216–226.
35. Saikh KU, Kissner TL, Dyas B, Tropea JE, Waugh DS, et al. (2006) Human cytolytic T cell recognition ofYersinia pestisvirulence proteins that target innate immune responses. Journal of Infectious Diseases 194: 1753–1760.
36. Nakajima R, Brubaker RR (1993) Association between virulence ofYersinia pestis
and suppression of gamma interferon and tumor necrosis factor. Infection and Immunity 61: 23–31.
37. Parent MA, Wilhelm LB, Kummer LW, Szaba FM, Mullarky IK, et al. (2006) Gamma interferon, tumor necrosis factor alpha, and nitric oxide synthase 2, key elements of cellular immunity, perform critical protective functions during humoral defense against lethal pulmonaryYersinia pestisinfection. Infection and Immunity 74: 3381–3386.
38. Lambert ND, Nilles ML, Bradley DS (2009) Characterization of immune responses toYersinia pestisinfection: resistant versus susceptible mice. Journal of Immunology 182: 129.29.
39. World Health Organization (2010) Human plague: review of regional morbidity and mortality, 2004–2009. Weekly Epidemiological Record 85: 40–45. 40. Schierup MH, Vekemans X, Charlesworth D (2000) The effect of subdivision on
variation at multi-allelic loci under balancing selection. Genetical Research 76: 51–62.
41. Lambracht-Washington D, Moore YF, Wonigeit K, Fisher Lindahl K (2008) Structure and expression of MHC class Ib genes of the central M region in rat and mouse: M4, M5 and M6. Immunogenetics 60: 131–145.
42. Chapuis MP, Estoup A (2007) Microsatellite null alleles and estimation of population differentiation. Molecular Biology and Evolution 24(3): 621–631. 43. Beaumont MA, Nichols RA (1996) Evaluating loci for use in the genetic analysis
44. Vitalis R, Dawson K, Boursot P (2001) Interpretation of variation across marker loci as evidence of selection. Genetics 158: 1811–1823.
45. Vitalis R (2011) DETSEL: a R-package to detect marker loci responding to selection. In: Pompanon F, Bonin A, eds. Population Genomics: Methods and Protocols, Molecular Biology series, Humana Press, USA.
46. Ardlie KG, Kruglyak L, Seielstad M (2002) Patterns of linkage disequilibrium in the human genome. Nature Review Genetics 3: 299–309.
47. Jeffreys AJ, Kauppi L, Neumann R (2001) Intensely punctate meiotic recombination in the class II region of the major histocompatibility complex. Nature Genetics 29: 217–222.
48. Guryev V, Smits BMG, van de Belt J, Verheul M, Hubner N, et al. (2006) Haplotype block structure is conserved across mammals. PLoS Genetics 2: 1111–1118.
49. Cizkova D, de Bellocq J, Baird SJE, Pialek J, Bryja J (2011) Genetic structure and contrasting selection pattern at two major histocompatibility complex genes in wild house mouse populations. Heredity 106(5): 727–740.
50. Babik W, Pabijan M, Radwan J (2008) Contrasting patterns of variation in MHC loci in the Alpine newt. Molecular Ecology 17(10): 2339–2355. 51. Duplantier JM, Duchemin JB (2003) Human diseases and introduced small
mammals. In:The natural history of Madagascar, (Goodman SM & Benstead JP, eds.). pp 158–161. University of Chicago Press, Chicago.
52. Rahelinirina S (2009) Le risque pesteux dans les foyers ruraux du Moyen-Ouest malgache: de´placements et structuration des populations de rats noirs de l’e´chelle de l’habitat a` celle du paysage. PhD Thesis, Antananarivo, Antananarivo.
53. Vogler AJ, Chan F, Wagner DM, Roumagnac P, Lee J, et al. (2011) Phylogeography and molecular epidemiology ofYersinia pestisin Madagascar. Plos Neglected Tropical Diseases, 5(9): e1319. doi:10.1371/journal.pntd. 0001319.
54. Ao L, Liu JY, Gao LH, Liu SX, Yang MS, et al. (2008) Differential expression of genes associated with cell proliferation and apoptosis induced by okadaic acid during the transformation process of BALB/c 3T3 cells. Toxicology in Vitro 22: 116–127.
55. Ekblom R, Saether SA, Jacobsson P, Fiske P, Sahlman T, et al. (2007) Spatial pattern of MHC class II variation in the great snipe (Gallinago media). Molecular Ecology 16: 1439–1451.
56. Gilabert A, Loiseau A, Duplantier JM, Rahelinirina S, Rahalison L, et al. (2007) Genetic structure of black rat populations in a rural plague focus in Madagascar. Canadian Journal of Zoology 85: 965–972.
57. Mills JN, Yates TL, Childs JE, Parmenter RR, Ksiazek TG, et al. (1995) Guidelines for working with rodents potentially infected with hantavirus. Journal of Mammalogy 76: 716–722.
58. Robins JH, McLenachan PA, Philips MJ, Craig L, Ross HA, et al. (2008) Dating of divergences within the Rattus genus phylogeny using whole mitochondrial genomes. Molecular Phylogenetics and Evolution 49(2): 460–466.
59. Cavagna P, Stone G, Stanyon R (2002) Black rat (Rattus rattus) genomic variability characterized by chromosome painting. Mammalian Genome 13(3): 157–163.
60. Ioannidu S, Walter L, Dressel R, Gunther E (2001) Physical map and expression profile of genes of the telomeric class I gene region of the rat MHC. Journal of Immunology 166: 3957–3965.
61. Loiseau A, Rahelinirina S, Rahalison L, Konecny A, Duplantier JM, et al. (2008) Isolation and characterization of microsatellites inRattus rattus. Molecular Ecology Resources 8: 916–918.
62. Rousset F (2008) GENEPOP9 007: a complete re-implementation of the GENEPOP software for Windows and Linux. Molecular Ecology Ressources 8: 103–106.
63. Benjamini Y, Hochberg Y (1995) Controlling the False Discovery Rate - a practical and powerful approach to multiple testing. Journal of the Royal Statistical Society Series B 57: 289–300.
64. Van Oosterhout C, Hutchinson WF, Wills DP, Shipley P (2004) MICRO-CHECKER: software for identifying and correcting genotyping errors in microsatellite data. Molecular Ecology Notes 4: 535–538.
65. Tollenaere C, Brouat C, Duplantier JM, Rahalison L, Rahelinirina S, et al. (2010) Phylogeography of the introduced speciesRattus rattusin the western Indian Ocean, with special emphasis on the colonization history of Madagascar. Journal of Biogeography 37: 398–410.
66. Neff BD, Fraser BA (2010) A program to compare genetic differentiation statistics across loci using resampling of individuals and loci. Molecular Ecology Resources 10: 546–550.
67. Excoffier L, Lischer HLE (2010) Arlequin suite ver 3.5:a new series of programs to perform population genetics analyses under Linux and Windows. Molecular Ecology Resources 10: 564–567.
68. Smouse PE, Long JC, Sokal RR (1986) Multiple regression and correlation extensions of the Mantel test of matrix correspondence. Systematics and Zoology 35: 627–632.