Identification of Variants in Primary and
Recurrent Glioblastoma Using a
Cancer-Specific Gene Panel and Whole Exome
Sequencing
Selene M. Virk1, Richard M. Gibson2, Miguel E. Quinones-Mateu2,3,4*, Jill S. Barnholtz-Sloan3*
1Department of Epidemiology and Biostatistics, Case Western Reserve University, Cleveland, Ohio, USA,
2University Hospital Translational Laboratory, University Hospitals Case Medical Center, Cleveland, Ohio, USA,3Case Comprehensive Cancer Center, Case Western Reserve University, Cleveland, Ohio, USA,
4Department of Pathology, Case Western Reserve University, Cleveland, Ohio, USA
*[email protected](JSB);[email protected](MEQ)
Abstract
Glioblastoma (GBM) is an aggressive, malignant brain tumor typically resulting in death of the patient within one year following diagnosis; and those who survive beyond this point usually present with tumor recurrence within two years (5-year survival is 5%). The genetic heterogeneity of GBM has made the molecular characterization of these tumors an area of great interest and has led to identification of molecular subtypes in GBM. The availability of sequencing platforms that are both fast and economical can further the adoption of tumor sequencing in the clinical environment, potentially leading to identification of clinically ac-tionable genetic targets. In this pilot study, comprised of triplet samples of normal blood, pri-mary tumor, and recurrent tumor samples from three patients; we compared the ability of Illumina whole exome sequencing (ExomeSeq) and the Ion AmpliSeq Comprehensive Can-cer Panel (CCP) to identify somatic variants in patient-paired primary and recurrent tumor samples. Thirteen genes were found to harbor variants, the majority of which were exclusive to the ExomeSeq data. Surprisingly, only two variants were identified by both platforms and they were located within thePTCH1andNF1genes. Although preliminary in nature, this work highlights major differences in variant identification in data generated from the two plat-forms. Additional studies with larger samples sizes are needed to further explore the differ-ences between these technologies and to enhance our understanding of the clinical utility of panel based platforms in genomic profiling of brain tumors.
Introduction
Glioblastoma (GBM) is the most frequently occurring primary brain tumor in adults [1]. Al-though considered a rare cancer, with an incidence rate of 2 to 3 cases per 100,000 people in
a11111
OPEN ACCESS
Citation:Virk SM, Gibson RM, Quinones-Mateu ME, Barnholtz-Sloan JS (2015) Identification of Variants in Primary and Recurrent Glioblastoma Using a Cancer-Specific Gene Panel and Whole Exome Sequencing. PLoS ONE 10(5): e0124178. doi:10.1371/journal. pone.0124178
Academic Editor:Javier S Castresana, University of Navarra, SPAIN
Received:February 7, 2015
Accepted:February 19, 2015
Published:May 7, 2015
Copyright:© 2015 Virk et al. This is an open access article distributed under the terms of theCreative Commons Attribution License, which permits unrestricted use, distribution, and reproduction in any medium, provided the original author and source are credited.
Data Availability Statement:Illumina whole exome sequencing data is available from The Cancer Genome Atlas:https://tcga-data.nci.nih.gov/tcga. TCGA IDs used in this analysis were: TCGA-0957 (UH1), TCGA-1389 (UH2), TCGA-4065 (UH3). To ensure adherence to guidelines for the protection of data derived from human subjects, the Ion AmpliSeq data is available from the authors on request and from The Ohio Brain Tumor Neuro-oncology Disease team leader Dr. Andrew Sloan: andrew.
the United States, this tumor contributes disproportionately to cancer morbidity and mortality [1,2]. Current standard therapy for GBM patients is surgical resection of the primary tumor followed by adjuvant radiotherapy and chemotherapy (i.e.“Stupp”protocol) [3]; however, in spite of aggressive treatment, GBM recurs in many patients within two years [4]. Because of this high likelihood of recurrence, it is imperative that we obtain a better understanding of the genetic and molecular changes that occur after primary tumor resection and treatment. This information could be vital to the development of new treatments with the potential to increase survival of GBM patients.
The genetic differences between primary and recurrent tumors have yet to be fully charac-terized, which have limited the development of effective targeted therapies to combat recurrent GBM [5]. Mutations in specific genes have been shown to be prevalent in GBM cases [6,7]. Due to known inter- and intra- individual heterogeneity in GBM [8,9], considerable effort has been made to not only identify individually mutated genes but to develop classification schemes to characterize the tumors by molecular subtype [10,11]. The end goal is to use tumor classification as a molecular diagnostic tool or a prognostic indicator of overall survival, ulti-mately leading to discovery of new treatment strategies.
Deep (next generation) sequencing is revolutionizing our understanding of somatic changes occurring in the cancer genome. Studies comparing multiple tumor types are shedding light on both the relationship between genetic mutations and cancer type, as well as dysregulated path-ways that are common across cancers or specific to subset of cancer types [12–14]. Although the Illumina (Illumina, San Diego, CA) deep sequencing platform is the current leader in clini-cal cancer research [15], other technologies such as Ion Torrent (Life Technologies, Carlsbad, CA) [16] are suitable for broader screening methods based on reduced sequencing time and cost per sample [17]. In this study we evaluated the ability of the Ion AmpliSeq Comprehensive Cancer Panel (Life Technologies, Carlsbad, CA) to identify variants in triplicate samples (matched blood, primary and recurrent tumors) from three GBM patients and compared the results to whole exome sequencing data obtained using the Illumina platform from the Cancer Genome Atlas (TCGA) project [18].
Materials and Methods
Study Patients and Sample Processing
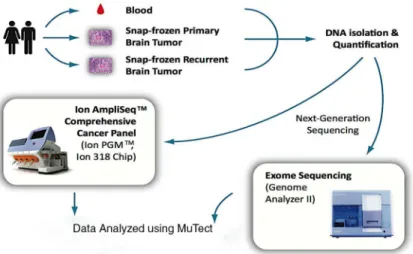
GBM patients were prospectively recruited as part of the ongoing Ohio Brain Tumor Study (OBTS), a prospective study of primary benign and malignant brain tumor patients from the four major academic centers in the state of Ohio. Written consent was received from all pa-tients during their enrollment into OBTS, which occurred prior to specimen collection. All human subjects protocols and procedures were approved by the Institutional Review Board at University Hospitals Case Medical Center, Cleveland, Ohio. Pre-treatment blood samples along with primary and recurrent snap-frozen tumor tissues (triplet samples) were collected from three adult patients.Fig 1provides an overview of procedures used in this study. Tissues were frozen within 15 to 30 minutes following resection. Samples and clinical information were collected and archived in accordance with guidelines established by The Cancer Genome Atlas [18] and tumor purity was accessed by histological review by board certified neuropathol-ogist. Two sections were taken from each patient sample (3 samples/patient X 2) and one col-lection of triplet samples from all three patients were sequenced on each of the two
sequencing platforms.
Blood was drawn into PAXgene DNA tubes and DNA extracted using PAXgene Blood DNA kit (Qiagen, Valencia, CA). Total DNA was isolated from the snap-frozen brain tumor samples using the Maxwell 16 DNA Purification kit (Promega, Madison, WI). DNA was
Variants in Primary and Recurrent Glioblastoma
Funding:This work was supported by National Institutes of Health (www.nih.gov) 5R25CA094186 SMV, National Institutes of Health
HHSN261201000057C, and NIH/NCI 2P30 CA043703-23 JSB.
quantified using Nanodrop ND-100 (Thermo Scientific, Waltham, MA) and Qubit 2.0 Fluo-rometer (Life Technologies, Carlsbad, CA). Patient-paired triplet DNA samples from three pa-tients were sequenced using (i) whole exome sequencing on the Illumina GA-IIX or HiSeq 2000 [ExomeSeq] (Fig 1) as part of The Cancer Genome Atlas project as detailed in [18] and (ii) the Ion AmpliSeq Comprehensive Cancer Panel (Ion AmpliSeq CCP, Life Technologies). For this, four amplicon pools per sample covering 409 genes implicated in cancer were quanti-fied (2100 Bioanalyzer DNA 7500, Agilent Technologies), prepared and enriched for sequenc-ing on the Ion Sphere Particles (ISPs) ussequenc-ing the Ion OneTouch 200 Template Kit v2 (Life Technologies) in the Ion OneTouch™2 System (Life Technologies). Templated ISPs were quan-tified (Qubit 2.0, Life Technologies) and loaded into an Ion 318 Chip (Life Technologies) to be sequenced on the Ion PGM using the Ion PGM Sequencing 200 Kit v2 (Life Technologies). The average loading efficiency in the Ion Torrent PGM was 88% in all nine Ion 318 chips with an average of 5.9 million reads per sample. Individual samples averaged over 5.8 million mapped sequence reads, with a mean read length of 109 base pairs. The average target coverage in the Ion Torrent PGM was 315x and 377x for blood and tumor samples, respectively. In the case of the TCGA Illumina whole exome sequencing, the average target coverage was 121x and 138x for blood and tumor samples, respectively. Signal processing and base calling of sequence data generated from the Ion Torrent PGM was performed with Torrent Analysis Suite version 3.4.2. High quality reads (a quality score>20) from the FASTQ files generated from the Ion Torrent PGM Server were trimmed of adapter, barcode, and primer sequences prior alignment to the human genome assembly 19 (Hg19) sequence.
Data Processing and Variant Identification
Prior to variant analysis, FASTQ files generated from both platforms were subjected to several preprocessing steps. FASTQ files were aligned to the Human Genome Reference Consortium build 37 (Hg19) using the Burroughs-Wheeler Alignment algorithm as implemented in the BWA software package v.0.7.2, resulting in the production of BAM files of the aligned reads. Following genome alignment, the Genome Analysis Toolkit v.3.2.2 was used to realign reads
Fig 1. Overview of patient samples and sequencing methods.Sequencing for the AmpliSeq CCP samples was done using the Ion 318 Chip and whole exome sequencing was preformed using the Genome Analyzer II or HiSeq 2000, both from Illumina.
around insertion/deletions and recalibrate base quality scores for both ExomeSeq and Ampli-Seq data. The ExomeAmpli-Seq reads were subjected to duplicate marking and removal prior to the realignment and base recalibration steps. BAM files were sorted in coordinate order and BAM index files were generated using Picard v.1.119. Variant calling was performed in aligned reads paired by patient samples, i.e., blood (normal) versus primary or recurrent tumor tissue, using MuTect v.1.1.4 [19] along with DbSNP 138. Variants were annotated with ANNOVAR v.111214 (http://www.openbioinformatics.org/annovar/) and read alignments were visualized using IGV v2.3.2 (http://www.broadinstitute.org/igv/). Variant analysis was restricted to vari-ants occurring in exome regions.
Results
Patient demographics and treatment
Among the three patients included this study, the average age was 45 years and the mean over-all survival was 441 days (Table 1). All but one patient was male and all were white (one patient also self-identified as Hispanic). Each patient received the same treatment, which consisted of total resection followed by adjuvant temozolomide and external beam radiation. In addition, all patients underwent a second surgery upon recurrence. Purity of primary tumor samples was greater than in recurrent tumor samples, ranging from 80–90% to 65–75%, respectively (Table 1).
Variants identified by both ExomeSeq and AmpliSeq CCP
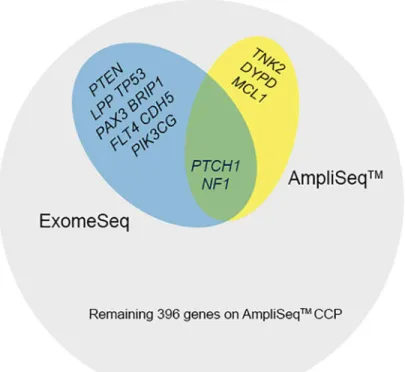
Since whole exome sequencing technologies have the capacity to cover all coding genes within the genome, whereas any panel based approach will be limited to a subset of the coding ge-nome, to make the most appropriate comparison between the two technologies we restricted our analysis to the 409 genes included in the AmpliSeq panel. In addition, since we were most interested in variants within coding regions, we also focused on analysis of variants within exons only. Variants were identified in 13 (3%) of the 409 genes analyzed in this study. The ma-jority of variants were found in the ExomeSeq data and only two gene variants were shared be-tween the two platforms (Fig 2).
Table 1. Patient demographics and clinical information.
Patient Number UH1 UH2 UH3
Gender Female Male Male
Age at Diagnosis 48 51 36
Race/Ethnicitya W/NH W/NH W/H
Year Diagnosis 2007 2008 2009
Overall Survival (Days) 665 141 430
Progression Time (Days) 50 81 70
Days to Second Surgery 413 81 70
Tumor Sample Purity (Primary/Recurrent)b 90%/65% 80%/65% 80%/75%
All patients received total resection, followed by temozolomide and external beam radiation of 6,000 Gray in 30 fractions.
aW/NH, white not Hispanic or Latino; W/H, white Hispanic or Latino. bSample purity determined by histological review.
doi:10.1371/journal.pone.0124178.t001
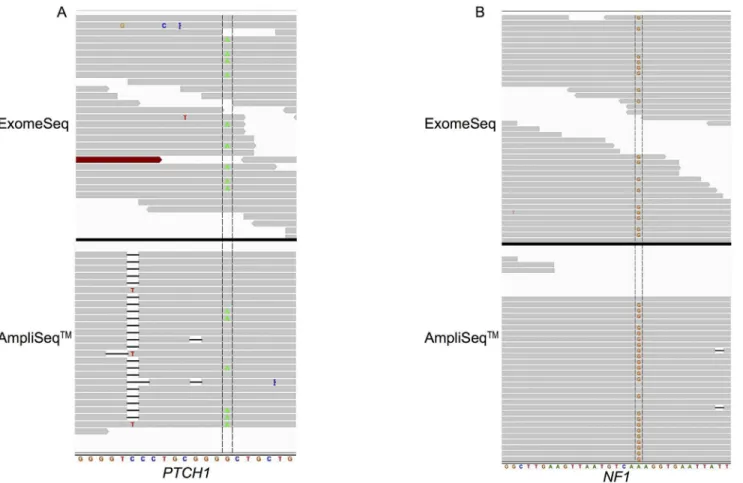
The variants found by both platforms were in the genesPTCH1(patched 1) andNF1 (neu-rofibromin 1). Detailed analysis of thePTCH1variant revealed similar coverage of the mutated base (Fig 3A) in both the AmpliSeq and ExomeSeq data at 26 and 24 reads, respectively; and the AmpliSeq panel had a lower percentage (23% compared to 38%) of reads containing the al-ternate base. The other shared variant was found in theNF1gene (Fig 3B) and in this case the two platforms differed greatly in terms of read coverage of the mutated base. In the ExomeSeq data, there were 38 reads covering the variant base and 18 (47%) contained the variant; whereas 360 reads in the AmpliSeq data covered the base and 20% (71 reads) contained the variant. NF1was also one of the four variants identified in a recurrent tumor sample.
Variants identified by ExomeSeq but not by AmpliSeq CCP
There were a total of 10 variants in eight genes supposedly included in the AmpliSeq CCP that were only identified by the ExomeSeq approach. Two of these genes werePTEN(phosphatase and tensin homolog) andTP53(tumor protein p53), both of which were found in the primary and recurrent tumors of patient UH3. Both of these genes are frequently mutated in GBM and many other cancers. In the primary tumor, the exon containing the mutated base inPTENwas widely covered by the ExomeSeq reads and the mutated base was covered by 26 reads, 65% of which contained the variant; however, the same exon was only partially covered by reads from the AmpliSeq CCP (Fig 4A) none of which covered the mutated base. Similarly, a mutation in theTP53gene was covered by 98 ExomeSeq reads, 53% contained the variant base, while no
Fig 2. Summary of mutated AmpliSeq CCP genes.Genes containing variants and the associated sequencing platforms are shown. Most variants were associated with ExomeSeq data and there were a total of 409 genes on the AmpliSeq CCP.
AmpliSeq CCP reads covered this region of the exon (Fig 4B). Analysis of read coverage of PTENandTP53in the recurrent tumor of patient UH3 found an increase in the number of reads covering the variant base in comparison to the primary tumor for both genes at 68 and 121, respectively. In terms of the proportion of the reads covering the base that were also mu-tated, there was a reduction forPTENto 40% and forTP53, the proportion was practically the same as in the primary tumor at 54%. In addition, the AmpliSeq data for the recurrent tumor produced a single read covering the mutated base inTP53, this read also contained the variant.
ThePIK3CG(phosphatidylinositol-4,5-bisphosphate 3-kinase, catalytic subunit gamma)
gene was the only gene found to be mutated in more than one patient, specifically this gene contained two different variants and one of each was present in the primary tumors of both UH1 and UH3 individuals (Table 2). Interestingly, two variants were identified in theLLP (LIM domain containing preferred translocation partner in lipoma) gene, both in the primary tumor of patient UH2 (Table 2). These two variants were located in adjacent bases. Examina-tion of all AmpliSeq CCP genes that contained variants only in ExomeSeq data revealed the LLPgene to have the greatest coverage with 1388 and 1403 reads covering the first and second variant, respectively. In both cases, 80% of the reads were mutated.
Fig 3. Read alignment view ofPTCH1(A) andNF1(B) genes zoomed in to individual base level.(A) View displayed spans chr9: 98,209,620– 98,209,640 ofPTCH1; variant base is G to A mutation located at base 98,209,634 in primary tumor of patient UH1. (B) View displayed spans chr17:
29,585,500–29,585,530 ofNF1; variant is G to A mutation located at base 29,585,518 in recurrent tumor of patient UH3. The variant base is located between
the two vertical lines crossing the reads.
doi:10.1371/journal.pone.0124178.g003
Fig 4. Read alignment view ofPTEN(A) andTP53(B) genes zoomed out to exon level.The AmpliSeq data did not produce any reads covering the variant base inPTEN; however, a single read not shown in the graphic did cover the variant base inTP53in the recurrent tumor. Data from primary tumors are shown. (A) View displayed spans chr10: 89,653,700–89,653,900 ofPTEN; variant is T to G mutation located at base 89,653,783. (B) View ofTP53displays region of chr17: 7,578,400–7,578,600; variant is G to A mutation located at base 7,578,475. The location of the variant base is indicated by the vertical line crossing the reads.
doi:10.1371/journal.pone.0124178.g004
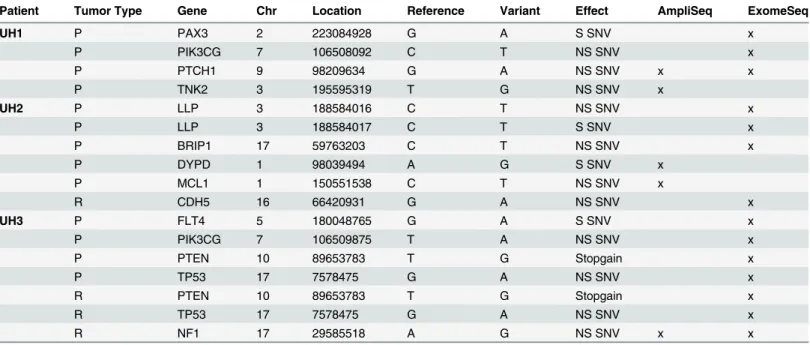
Table 2. Variants identified in Ion AmpliSeq Comprehensive Cancer Panel Genes.
Patient Tumor Type Gene Chr Location Reference Variant Effect AmpliSeq ExomeSeq
UH1 P PAX3 2 223084928 G A S SNV x
P PIK3CG 7 106508092 C T NS SNV x
P PTCH1 9 98209634 G A NS SNV x x
P TNK2 3 195595319 T G NS SNV x
UH2 P LLP 3 188584016 C T NS SNV x
P LLP 3 188584017 C T S SNV x
P BRIP1 17 59763203 C T NS SNV x
P DYPD 1 98039494 A G S SNV x
P MCL1 1 150551538 C T NS SNV x
R CDH5 16 66420931 G A NS SNV x
UH3 P FLT4 5 180048765 G A S SNV x
P PIK3CG 7 106509875 T A NS SNV x
P PTEN 10 89653783 T G Stopgain x
P TP53 17 7578475 G A NS SNV x
R PTEN 10 89653783 T G Stopgain x
R TP53 17 7578475 G A NS SNV x
R NF1 17 29585518 A G NS SNV x x
Summary of all variants identified in this study, the majority of which were found in primary tumors. R, recurrent; Chr, chromosome; NS, nonsynonymous; P, primary; SNV, single nucleotide variant.
Variants identified exclusively by AmpliSeq CCP
In contrast to the variants unique to the ExomeSeq data, three variants in three different genes were identified by the AmpliSeq CCP but not by whole exome sequencing (Fig 2andTable 2). All three variants were detected in primary tumors of two patients (UH1 & UH2), specifically in theDPYD(dihydropyrimidine dehydrogenase),MCL1(v-myc myelocytomatosis viral onco-gene homolog 1, lung carcinoma derived [avian]), andTNK2(tyrosine kinase, non-receptor, 2) genes. None of the three variants unique to AmpliSeq CCP were designated as“covered”by the MuTect software, indicating less than 80% power to detect these variants at 0.3 allelic fraction.
Discussion
Deep sequencing methodologies have revolutionized many biological and biomedical fields with cancer, particularly diagnostics and treatment strategies, being one of the most impacted [20,21]. Great effort has been placed on sequencing entire genomes or whole exomes to identi-fy critical cancer-associated mutations that could drive personalized and targeted therapies [22]. Unfortunately, although access to deep sequencing technologies has increased consider-ably during the last few years, the continued relatively high cost of sequencing and complexity of the analysis has prompted the development of more affordable instruments and methodolo-gies, together with the simplification of the number of genes to be analyzed. The Ion AmpliSeq CCP was developed to sequence all-exon coverage of 409 genes implicated in cancer, that is, over 50% of the Wellcome Trust Sanger Institute Cancer Gene Census (http://cancer.sanger.ac. uk/cosmic/census). In this pilot study we used the AmpliSeq CCP to sequence matched blood, primary and recurrent tumors from three GBM patients and compared the results to whole exome sequencing data obtained using the Illumina platform from The Cancer Genome Atlas (TCGA) project.
Overall, few genes were found to contain variants in this study (13 genes) and among those, only two variants were jointly identified by the two sequencing approaches (ExomeSeq and AmpliSeq CCP). A variant in thePTCH1gene was identified in the primary tumor from pa-tient UH1. This tumor suppressor gene functions in the Hedgehog signaling pathway and has been show to be mutated in pediatric medulloblastoma [23]. The second variant was within the geneNF1(also a tumor suppressor), which encodes the neurofibromin 1 protein and is a fre-quently mutated gene in GBM [18]. These two variants were the only two covered by the MuTect software, which effectively makesPTCH1andNF1the most reliably identified variants in the AmpliSeq CCP data.
There was also little overlap of variants between individual patient and tumor types. The only gene identified as variant in more than one patient wasPIK3CG, which was mutated in primary tumors from patients UH1 & UH3. This gene contained different variants in the two tumors and was only present in the ExomeSeq data. The genesPTENandTP53contained the only gene variants identified in both the primary and recurrent tumors of the same patient, UH3. Although both genes are among those frequently mutated in GBM, these variants were also exclusive to the ExomeSeq data. Further inspection of the alignments at the variant bases revealed only partial coverage of the variant containing exons by the AmpliSeq reads, which is a likely contributor to the variant not being detected by this panel.
It was anticipated that there would be differences in the variants identified from the Exome-Seq and AmpliExome-Seq CCP data. In an effort to limit these differences, we restricted the analysis to only include genes that were on the gene list of the AmpliSeq CCP. The different technological approaches of sequencing an entire exome versus sequencing a focused subset of cancer-related genes, could likely result in finding fewer mutated genes using the more focused approach, as observed in this study. Another point to be mindful of is that intra-tumoral heterogeneity is a
characteristic of many cancers, including GBM. The analysis reported here was done using two different cuts from each patient tumor and our observed discrepancies in variant identification could stem from the inherent intra-tumoral heterogeneity in GBM.
This analysis provides evidence that the genesPTCH1andNF1can be reliably detected in patient samples and that the lack of broad exon coverage can impact variant detection in those regions. The genes included in the AmpliSeq CCP were selected to be representative of a wide selection of cancer types and gene panels more specific for brain and brain tumors may im-prove variant detection in GBM. Although a few studies have evaluated the use deep sequenc-ing-based panels for rapid cancer genotyping [23,24], our pilot study demonstrates the potential for the Ion AmpliSeq CCP to contribute to detection of mutations in both basic and clinical cancer research. Further studies, with a larger number of samples will help us stand the differences observed between the two methodologies and add to our current under-standing of mutations that drive progression and recurrence in GBM.
Acknowledgments
The authors would like to acknowledge the patients who participated in The Cancer Genome Atlas (TCGA) project and Andrew E. Sloan, MD, for his support of the University Hospitals brain tumor biobank. The results published here are in whole or part based upon The Cancer Genome Atlas project established by the NCI and NHGRI. Further information about TCGA can be found here:http://cancergenome.nih.gov/.
Author Contributions
Conceived and designed the experiments: JSB MEQ. Performed the experiments: SMV RMG. Analyzed the data: SMV. Contributed reagents/materials/analysis tools: JSB MEQ. Wrote the paper: SMV RMG MEQ JSB.
References
1. Ostrom QT, Gittleman H, Lao P, Rouse C, Chen Y, Dowling J, et al. CBTRUS statistical report: Primary brain and central nervous system tumors diagnosed in the United States in 2007–2011. Neuro Oncol. 2014 Oct; 16 Suppl 4:iv1–63. doi:10.1093/neuonc/nou223PMID:25304271
2. American Cancer Society. Cancer Facts & Figures 2014. Atlanta: American Cancer Society. 2014. Available: http://www.cancer.org/acs/groups/content/@research/documents/webcontent/acspc-042151.pdf
3. Stupp R, Mason WP, van den Bent MJ, Weller M, Fisher B, Taphoorn MJB, et al. Radiotherapy plus concomitant and adjuvant temozolomide for glioblastoma. N Engl J of Med. 2005; 10: 987–996. doi:10. 1056/NEJMoa043330
4. Wen PY, Kesari S. Malignant gliomas in adults. N Engl J of Med. 2008; 359: 492–507. doi:10.1056/ NEJMra0708126
5. Riehmer V, Gietzelt J, Beyer U, Hentschel B, Westphal M, Shackert G, et al. Genomic profiling reveals distinctive molecular relapse patterns in IDH1/2 wild-type glioblastoma. Genes Chromosomes Cancer. 2014; 53: 589–605. doi:10.1002/gcc.22169PMID:24706357
6. Parsons DW, Jones S, Zhang X, Lin JC, Leary RJ, Angenendt P, et al. An integrated genomic analysis of human glioblastoma multiforme. Science 2008; 321: 1807–1812. doi:10.1126/science.1164382 PMID:18772396
7. McLendon R, Friedman A, Bigner D, Van Meir EG, Brat DJ, Mastrogianakis GM, et al. Comprehensive genomic characterization defines human glioblastoma genes and core pathways. Nature 2008; 455: 1061–1068. doi:10.1038/nature07385
9. Nickel GC, Barnholtz-Sloan J, Gould MP, McMahon S, Cohen A, Adams MD, et al. Characterizing mu-tational heterogeneity in a glioblastoma patient with double recurrence. PLoS ONE. 2013; 7: e35262. doi:10.1371/journal.pone.0035262
10. Phillips HS, Kharbanda S, Chen R, Forrest WF, Soriano RH, Wu TD, et al. Molecular subclasses of high-grade glioma predict prognosis, delineate a pattern of disease progression, and resemble stages in neurogenesis. Cancer Cell 2006; 9: 157–173. doi:10.1016/j.ccr.2006.02.019PMID:16530701
11. Verhaak RG, Hoadley KA, Purdom E, Wang V, Qi Y, Wilkerson MD, et al. Integrated genomic analysis identifies clinically relevant subtypes of glioblastoma characterized by abnormalities in PDGFRA, IDH1, EGFR, and NF1. Cancer Cell 2010; 17: 98–110. doi:10.1016/j.ccr.2009.12.020PMID: 20129251
12. Lawrence MS, Stojanov P, Mermel CH, Robinson JT, Garraway LA, Golub TR, et al. Discovery and sat-uration analysis of cancer genes across 21 tumour types. Nature 2014; 505: 495–501. doi:10.1038/ nature12912PMID:24390350
13. Ciriello G, Miller ML, Aksoy BA, Senbabaoglu Y, Schultz N, Sander C. Emerging landscape of oncogen-ic signatures across human cancers. Nat Genet. 2013; 45: 1127–1133. doi:10.1038/ng.2762PMID: 24071851
14. Kandoth C, McLellan MD, Vandin F, Ye K, Niu B, Lu C, et al. Mutational landscape and significance across 12 major cancer types. Nature 2013; 502: 333–339. doi:10.1038/nature12634PMID:24132290
15. Liu L, Li Y, Li S, Hu N, He Y, Pong R, et al. Comparison of next-generation sequencing systems. J Biomed Biotechnol 2012; 2012: 251364. doi:10.1155/2012/251364PMID:22829749
16. Rothberg JM, Hinz W, Rearick TM, Schultz J, Mileski W, Davey M, et al. An integrated semiconductor device enabling non-optical genome sequencing. Nature 2011; 475: 348–352. doi:10.1038/ nature10242PMID:21776081
17. Gibson RM, Schmotzer CL, Quinones-Mateu ME. Next-Generation Sequencing to Help Monitor Pa-tients Infected with HIV: Ready for Clinical Use? Curr Infect Dis Rep. 2014; 16:401. doi:10.1007/ s11908-014-0401-5PMID:24585216
18. Brennan CW, Verhaak RG, McKenna A, Campos B, Noushmehr H, Salama SR, et al. The somatic ge-nomic landscape of glioblastoma. Cell. 2013; 155: 462–477. doi:10.1016/j.cell.2013.09.034PMID: 24120142
19. Cibulskis K, Lawrence MS, Carter SL, Sivachenko A, Jaffe D, Gabriel S, et al. Sensitive detection of so-matic point mutations in impure and heterogeneous cancer samples. Nat Biotechnol. 2013; 31: 213– 219. doi:10.1038/nbt.2514PMID:23396013
20. Roychowdhury S, Iyer MK, Robinson DR, Lonigro RJ, Wu YM, Cao X, et al. Personalized oncology through integrative high-throughput sequencing: a pilot study. Sci Transl Med. 2011; 3: 111ra121. doi: 10.1126/scitranslmed.3003161PMID:22133722
21. Meldrum C, Doyle MA, Tothill RW. Next-generation sequencing for cancer diagnostics: a practical per-spective. Clin Biochem Rev. 2011; 32: 177–195. PMID:22147957
22. Frampton GM, Fichtenholtz A, Otto GA, Wang K, Downing SR, He J, et al. Development and validation of a clinical cancer genomic profiling test based on massively parallel DNA sequencing. Nat Biotechnol. 2013; 31: 1023–1031. doi:10.1038/nbt.2696PMID:24142049
23. Jones DT, Jäger N, Kool M, Zichner T, Hutter B, Sultan M, et al. Dissecting the genomic complexity un-derlying medulloblastoma. Nature 2012; 488: 100–105. doi:10.1038/nature11284PMID:22832583
24. Beadling C, Neff TL, Heinrich MC, Rhodes K, Thornton M, Leamon J, et al. Combining highly multi-plexed PCR with semiconductor-based sequencing for rapid cancer genotyping. J Mol Diagn. 2013; 15: 171–176. doi:10.1016/j.jmoldx.2012.09.003PMID:23274167
25. Singh RR, Patel KP, Routbort MJ, Reddy NG, Barkoh BA, Handal B, et al. Clinical validation of a next-generation sequencing screen for mutational hotspots in 46 cancer-related genes. J Mol Diagn. 2013; 15: 607–622. doi:10.1016/j.jmoldx.2013.05.003PMID:23810757