Marilisa Berti de Azevedo BarrosI
Luane Margarete ZanchettaII Erly Catarina de MouraIII,IV Deborah Carvalho MaltaIII,V
I Departamento de Medicina Preventiva e Social. Faculdade de Ciências Médicas (FCM). Universidade Estadual de Campinas (Unicamp). Campinas, SP, Brasil
II Programa de Pós-Gradução em Saúde Coletiva. FCM-Unicamp. Campinas, SP, Brasil
III Coordenação Geral de Doenças e Agravos Não Transmissíveis. Secretaria de Vigilância em Saúde. Ministério da Saúde. Brasília, DF, Brasil
IV Núcleo de Pesquisas Epidemiológicas em Nutrição e Saúde. Universidade de São Paulo. São Paulo, SP, Brasil
V Departamento de Enfermagem Materno-Infantil e Saúde Pública. Escola de Enfermagem. Universidade Federal de Minas Gerais. Belo Horizonte, MG, Brasil Correspondence:
Marilisa Berti de Azevedo Barros Universidade Estadual de Campinas R. Tessália Vieira de Camargo, 126 Barão Geraldo
13083-970 Campinas, SP Brasil E-mail: [email protected] Received: 11/28/2008 Revised: 7/27/2009 Approved: 8/28/2009
Self-rated health and associated
factors, Brazil, 2006
ABSTRACT
OBJECTIVE: To assess prevalence of poor self-rated health and associated factors.
METHODS: Data from 54,213 individuals aged ≥18 years, collected by the Vigilância de Fatores de Risco e Proteção para Doenças Crônicas por Inquérito Telefônico (VIGITEL – Telephone-based Surveillance of Risk and Protective Factors for Chronic Diseases), in Brazilian state capitals and Federal District, in 2006, were analyzed. One resident of each household, with at least one fi xed telephone line, was randomly selected from probability samples, subsequently answering the questionnaire. Independent variables analyzed were of a demographic, behavioral and self-reported morbidity nature. Prevalences and crude and adjusted prevalence ratios of poor self-rated health were estimated using Poisson regression.
RESULTS: Poor self-rated health was more frequent in women, older individuals and those with lower level of education, without an occupation and living in state capitals of the Northern and Northeastern regions; among men prevalence of poor self-rated health was higher in the Southeastern region than in the Southern region. Smoking ≥ 20 cigarettes/day, lack of regular physical activity in leisure time and low weight or obesity were associated with poor self-rated health in both sexes; pre-obesity and frequent consumption of fruits and vegetables were signifi cant in women, while not watching television was signifi cant in men. Prevalence of poor self-rated health increased with the growth in the number of self-reported morbidities. Having four or fi ve morbidities resulted in PR=11.4 in men and PR=6.9 in women, compared to those who did not have morbidities.
CONCLUSIONS: Regional, sex and level of education inequalities were observed in the prevalence of poor self-rated health. In addition, its association with unhealthy behavior and comorbidities emphasize the need for strategies to promote healthy habits and those to control chronic diseases.
Empirical health assessment, which currently com-prises several domains, includes “tested” health measures (by means of laboratorial and functional tests), observed health (based on clinical assessment made by professionals) and perceived health (based on personal knowledge and beliefs).18 In this last
do-main, self-rated health is considered a valid and rele-vant indicator of individuals’ and populations’ health status. It is associated with objective measures of morbidity and use of services, constituting a power-ful predictor of mortality, regardless of medical, be-havioral and psychosocial factors, and equivalent to indicators obtained by more complex and extensive instruments.8 It is, however, a measure with
deter-minants distinct from those observed for mortality13
and its power to predict deaths differs among socio-demographic segments, being stronger in those with higher level of education.6
Perception of health status can be measured by dif-ferent instruments, and self-assessment of health, ob-tained from one single question, has been widely used in health surveys.4,14,19 This indicator creates a global
self-classifi cation of the individuals’ health, consid-ering signs and symptoms of diseases (diagnosed by health professionals or not), in addition to the impact these conditions have on their physical, mental and social well-being. Studies have pointed out that the physical component infl uences self-assessment more than the mental component does.17
The infl uence of the socioeconomic level on self-rat-ed health conditions has been analyzself-rat-ed in some Bra-zilian studies. Based on data from the 2003 National Household Sample Survey (PNAD), Dachs & Santos5
confi rmed associations of this indicator with income, level of education and household asset index, previ-ously observed in 1998 PNAD data.7 Lima-Costa et
al12 estimated the magnitude of infl uence of the
socio-economic situation on Brazilian adults’ and elderly people’s self-rated health, comparing 2003 PNAD fi ndings with those from 1998. Self-assessment of health has been widely used,1,19 but Brazilian
stud-ies on the association between self-assessment and health-related behavior are scarce. In one of these studies, Höfelmann & Black7 observed that, in
work-ers of the metal-mechanical sector, self-assessment of health was poorer in individuals with lower physi-cal activity level.
The present study aimed to analyze the poor self-rated health pattern in the population aged ≥18 years, ac-cording to demographic, social, health-related behav-ior and presence of self-reported morbidity variables. INTRODUCTION
METHODS
This is a cross-sectional study that used data collect-ed by the Telephone-bascollect-ed Surveillance of Risk and Protective factors for Chronic Diseases (VIGITEL) in 2006.15
VIGITEL is based on probability samples of the pop-ulation aged ≥18 years, living in households with a fi xed telephone line, in Brazilian capitals and the Fed-eral District. A minimum sample of 2,000 individuals per city was defi ned to estimate the frequency of risk factors with 95% confi dence interval and 2% maxi-mum error. Sampling included systematic random selection of 5,000 fi xed telephone lines per city, re-selection of lines in each city in 25 replicas and iden-tifi cation of (eligible) active residential lines. In the selected households, the number of residents aged ≥18 years was identifi ed, and one of them was randomly selected for the interview. Responses to the question-naire applied in telephone interviews were recorded in computers. The following variables are included in the VIGITEL questionnaire: demographic, socioeco-nomic, smoking and alcohol consumption, physical activity and diet pattern, self-assessment of health and medical diagnosis of some diseases and chronic con-ditions. More details about the survey methods have been published by Moura et al.15
In all, 76,330 telephone calls to eligible lines result-ed in 54,369 interviews (71.1%). The response rate varied from 64.4% in Porto Alegre (RS) to 81.1% in Palmas (TO). Losses corresponded to busy telephone lines, with a fax tone or connected to an answering machine, or to the impossibility of fi nding the select-ed individual after ten attempts. Overall refusal rate was 9.1%, varying from 5.4% in Palmas to 15.0% in Porto Alegre.
least fi ve times per week); practice of physical activ-ity in leisure time; complete lack of physical activactiv-ity, including physical activity in several contexts; and number of daily hours watching television. Body mass index (BMI=weight/height2) was calculated with
self-reported information about weight and height and thus classifi ed: underweight (BMI<18.5), normal weight (18.5≤BMI<25), overweight (25≤BMI<30) and obesity (BMI≥30). Self-reported morbidity, di-agnosed by a doctor included: hypertension,
diabe-tes, osteoporosis, myocardial infarction/cerebrovas-cular accident, high cholesterol or triglycerides, and the number of self-reported morbidities.
Prevalence of individuals with poor self-rated health was calculated, based on independent variables, and prevalence ratios and 95% confi dence intervals were estimated using Poisson regression. The association of self-rated health with each of the independent variables was also adjusted for age, using Poisson multiple regression models. Two models were subse-Table 1. Prevalencesa and prevalence ratios of poor self-rated health, according to sociodemographic variables and sex. Brazil,
2006. (N=54,213)
Variable
Men Women
Prevalence Crude PR (95% CI)
Adjusted PRb
(95% CI) Prevalence
Crude PR (95% CI)
Adjusted PRb
(95% CI) Age group (years)
18 to 29 2.98 1 4.21 1
30 to 39 4.00 1.35 (0.79;2.28) 5.31 1.26 (0.89;1.79) 40 to 49 5.27 1.77 (1.13;2.78) 7.50 1.78 (1.31;2.42) 50 to 59 5.12 1.72 (1.06;2.79) 8.38 1.99 (1.46;2.71) 60 to 69 6.47 2.17 (1.32;3.58) 8.71 2.07 (1.49;2.86) 70 and more 7.30 2.45 (1.51;3.99) 9.91 2.35 (1.70;3.26) Level of education (years)
12 and more 2.50 1 1 2.69 1 1
9 to 11 2.77 1.11 (0.67;1.85) 1.22 (0.74;2.01) 4.65 1.73 (1.23;2.41) 1.85 (1.33;2.57) 0 to 8 5.77 2.31 (1.40;3.80) 2.29 (1.39;3.76) 8.37 3.11 (2.26;4.27) 2.90 (2.09;4.04) Occupation
Yes 3.37 1 1 4.96 1 1
No 8.05 2.39 (1.76;3.24) 2.40 (1.72;3.35) 7.81 1.57 (1.30;1.91) 1.44 (1.17;1.77) Ethnicity
White 4.04 1 1 5.47 1 1
Black/mixed 4.42 1.09 (0.79;1.52) 1.15 (0.83;1.61) 6.93 1.27 (1.05;1.53) 1.31 (1.09;1.59) Others 10.44 2.58 (0.72;9.29) 2.40 (0.72;7.94) 3.73 0.68 (0.15;3.18) 0.70 (0.15;3.26) Marital status
Single 3.07 1 1 4.99 1 1
Married 5.23 1.70 (1.19;2.44) 1.32 (0.81;2.15) 6.86 1.37 (1.09;1.74) 1.12 (0.86;1.45) Widowed 6.19 2.02 (0.98;4.18) 1.20 (0.53;2.70) 8.36 1.68 (1.27;2.21) 0.97 (0.68;1.38) Separated/
Divorced 3.19 1.04 (0.55;1.95) 0.81 (0.40;1.64) 6.28 1.26 (0.90;1.76) 0.91 (0.63;1.31) Number of residents in household
1 3.49 1 1 6.73 1 1
2 to 3 4.47 1.28 (0.58;2.82) 1.34 (0.61;2.98) 5.65 0.84 (0.63;1.12) 1.07 (0.80;1.42) 4 to 5 3.92 1.12 (0.51;2.49) 1.32 (0.59;2.97) 5.96 0.89 (0.66;1.19) 1.25 (0.92;1.71) 6 and more 5.10 1.46 (0.63;3.38) 1.84 (0.78;4.35) 8.02 1.19 (0.86;1.66) 1.81 (1.29;2.53) Region
Southeastern 4.88 1 1 5.65 1 1
Southern 2.28 0.47 (0.31;0.71) 0.47 (0.31;0.72) 6.14 1.09 (0.84;1.40) 1.08 (0.84;1.40)
Center-West 3.18 0.65 (0.40;1.06) 0.68 (0.42;1.12) 5.66 1.00 (0.76;1.32) 1.07 (0.81;1.41) Northern 4.31 0.88 (0.62;1.26) 0.95 (0.66;1.36) 7.55 1.33 (1.05;1.70) 1.47 (1.15;1.87) Northeastern 4.41 0.90 (0.65;1.24) 0.94 (0.68;1.30) 7.43 1.31 (1.04;1.66) 1.39 (1.10;1.75)
Total 4.32 6.29
a Percentage weighted to adjust socio-demographic distribution of the VIGITEL sample to the adult population distribution of
each city in the 2000 Demographic Census, considering each city’s population weight.
quently developed. The fi rst model included sociode-mographic variables and those with p<0.05 remained in the model. The second model included variables that indicated health-related behavior, in addition to the sociodemographic variables that remained in the previous model. Variables with p<0.05 remained in the second model. This strategy of analysis consid-ered the existence of a hierarchy of determination among independent variables.21 Analyses and
mod-els were made for men and women separately, con-sidering the differences in self-rated health between sexes.2,11 Analyses were made with the svy command
from Stata 8.0 software, which enables the incorpo-ration of weighting factors and considers the sample cluster design. Weightings of estimates of each city consisted in the multiplication of three factors: the inverse of the number of fi xed telephone lines ex-isting in the interviewee’s household; the number
of people aged ≥18 years in the household; and the post-stratifi cation weight to correct under- or over-representation of sociodemographic strata, resulting from different coverage levels of such strata in the fi xed telephone system in relation to the total adult population of each city, according to the 2000 demo-graphic census. A fourth factor was included for the estimates of the group of 27 cities, considering the differences of population size and the similar number of individuals interviewed in each city.
In this study, the informed consent form was replaced by verbal consent, obtained when contacting intervie-wees by telephone. VIGITEL was approved by the Comissão de Ética em Pesquisa em Seres Humanos do Ministério da Saúde (Ministry of Health Human Research Ethics Committee).
Table 2. Prevalencesa and prevalence ratios of poor self-rated health, according to Brazilian capitals, in men and women.
Brazil, 2006. (N=54,213)
Capital Men Women
Prevalence PR adjusted for age (95% CI) Prevalence PR adjusted for age (95% CI) Aracaju 4.39 2.35 (0.98;5.63) 5.72 1.28 (0.81;2.03) Belém 3.25 1.78 (0.78;4.08) 6.63 1.50 (0.95;2.38)
Belo Horizonte 4.46 2.33 (1.02;5.32) 4.56 0.99 (0.63;1.55) Boa Vista 5.23 2.89 (1.22;6.88) 10.73 2.58 (1.65;4.05) Brasília F.D 3.36 1.84 (0.69;4.94) 5.46 1.26 (0.76;2.10) Campo Grande 2.72 1.43 (0.62;3.31) 5.43 1.21 (0.69;2.10)
Cuiabá 2.80 1.51 (0.62;3.66) 5.40 1.23 (0.77;1.97) Curitiba 3.14 1.66 (0.73;3.75) 5.86 1.28 (0.83;1.99)
Florianópolis 1.91 1 4.56 1
Fortaleza 4.50 2.39 (0.99;5.79) 7.87 1.77 (1.09;2.87) Goiânia 3.29 1.77 (0.62;5.01) 6.25 1.41 (0.88;2.26)
João Pessoa 3.63 1.92 (0.86;4.31) 6.58 1.45 (0.87;2.40) Macapá 5.53 3.11 (1.34;7.19) 9.34 2.25 (1.41;3.60) Maceió 5.94 3.19 (1.43;7.13) 10.35 2.34 (1.47;3.71) Manaus 4.76 2.65 (1.11;6.30) 7.26 1.71 (1.06;2.78)
Natal 4.90 2.60 (1.01;6.68) 8.42 1.86 (1.16;2.96) Palmas 2.09 1.18 (0.49;2.85) 6.45 1.63 (0.99;2.69) Porto Alegre 1.37 0.70 (0.27;1.79) 6.81 1.41 (0.90;2.20) Porto Velho 4.26 2.33 (1.05;5.15) 7.99 1.90 (1.13;3.17) Recife 4.42 2.32 (0.98;5.53) 7.40 1.59 (1.02;2.48)
Rio Branco 6.81 3.75 (1.69;8.32) 10.30 2.44 (1.51;3.93) Rio de Janeiro 6.37 3.22 (1.43;7.22) 6.44 1.33 (0.85;2.08) Salvador 3.81 2.07 (0.92;4.67) 6.87 1.57 (0.88;2.77) São Luís 4.17 2.29 (1.03;5.05) 6.32 1.49 (0.93;2.38)
São Paulo 4.16 2.15 (0.96;4.85) 5.41 1.18 (0.74;1.86) Teresina 5.08 2.74 (1.16;6.49) 7.22 1.67 (1.00;2.79) Vitória 3.58 1.86 (0.79;4.40) 6.14 1.33 (0.85;2.08)
a Percentage weighted to adjust sociodemographic distribution of the VIGITEL sample to the adult population distribution of
RESULTS
Of all the 54,213 interviewees, 21,231 were men and 32,982 were women. In the population studied, 56.6% were younger than 40 years and 5.6% were 70 years or older, 65.5% had an occupation, 40.6% were self-reported whites and 35.5% lived in households with less than four residents. Among interviewees, 5.4% rated their own health poor, 29.9% fair, 49.6% good, and 15.2% excellent.
More women rated their health as poor than men 6.3% vs. 4.3%) (Table 1). The percentage of individuals who rated their health as poor was signifi cantly higher in those who were older, with a lower level of educa-tion and who did not work (Table 1). Only in women ethnicity and number of residents in the household were signifi cantly associated with self-assessment of health, even after adjustment for age. As regards the region of residence, compared to individuals who live Table 3. Prevalencesa and prevalence ratios of poor self-rated health, according to health-related behavior, in men and women.
Brazil, 2006. (N=54,213)
Variable
Men Women
Prevalence Crude PR (95% CI)
Adjusted PRb
(95% CI) Prevalence
Crude PR (95% CI)
Adjusted PRb (95% CI) Smoking (number of cigarettes/day)
1 to 9 3.34 1 1 5.21 1 1
10 to 19 4.50 1.35 (0.75;2.43) 1.33 (0.74;2.40) 7.26 1.39 (0.90;2.15) 1.39 (0.90;2.15) 20 and + 1.13 0.34 (0.17;0.65) 0.32 (0.17;0.62) 9.44 1.81 (1.16;2.82) 1.77 (1.14;2.73) Non-smoker 9.47 2.83 (1.77;4.52) 2.53 (1.51;4.25) 13.80 2.65 (1.86;3.78) 2.49 (1.74;3.57) Ex-smoker 5.80 1.73 (1.21;2.49) 1.51 (1.00;2.27) 8.03 1.54 (1.24;1.91) 1.41 (1.14;1.74)
Body mass index
Underweight 8.26 2.42 (1.19;4.92) 2.64 (1.33;5.25) 8.01 2.21 (1.40;3.49) 2.40 (1.52;3.79)
Normal weight 3.44 1 1 3.62 1 1
Overweight 4.22 1.23 (0.84;1.82) 1.11 (0.75;1.62) 6.76 1.87 (1.43;2.43) 1.67 (1.27;2.19) Obesity 6.50 1.90 (1.27;2.85) 1.67 (1.10;2.54) 14.34 3.96 (3.08;5.11) 3.47 (2.70;4.47)
Regular consumption of fruits and vegetables (≥5 times per week)
Yes 3.36 1 1 4.13 1 1
No 4.53 1.35 (0.81;2.26) 1.50 (0.89;2.54) 7.18 1.74 (1.38;2.19) 1.93 (1.53;2.42) Complete lack of activity
No 3.53 1 1 6.03 1 1
Yes 5.52 1.56 (1.14;2.13) 1.50 (1.10;2.06) 7.34 1.22(1.00;1.48) 1.09 (0.90;1.34) Physical activity in leisure time
Active 2.50 1 1 3.26 1 1
Not active 6.20 2.47 (1.74;3.53) 2.28 (1.60;3.25) 7.65 2.35 (1.88;2.93) 2.37 (1.90;2.96)
Daily hours of television
Less than 2 3.36 1 1 6.11 1 1
2 to 5 4.37 1.30 (0.91;1.85) 1.34 (0.94;1.90) 5.42 0.89 (0.71;1.10) 0.89 (0.71;1.11) 5 or more 6.59 1.96 (1.22;3.14) 2.04 (1.29;3.25) 8.53 1.39 (1.06;1.84) 1.40 (1.06;1.85)
Does not watch 9.69 2.88 (1.49;5.59) 2.86 (1.47;5.59) 9.71 1.59 (1.09;2.31) 1.53 (1.06;2.22) Frequency of alcohol consumption (times/week)
No consumption 4.94 1 1 6.69 1 1
Less than 1 3.93 0.80 (0.48;1.31) 0.82 (0.50;1.35) 5.72 0.85 (0.58;1.26) 0.95 (0.64;1.39)
1 to 2 2.85 0.58 (0.39;0.85) 0.62 (0.42;0.91) 4.52 0.68 (0.48;0.96) 0.75 (0.53;1.07) 3 to 4 4.40 0.89 (0.41;1.95) 0.93 (0.42;2.03) 5.58 0.83 (0.42;1.64) 0.90 (0.46;1.77) 5 to 7 9.95 2.01 (1.09;3.72) 1.84 (0.99;3.41) 13.14 1.96 (0.83;4.67) 1.83 (0.74;4.53)
a Percentage weighted to adjust socio-demographic distribution of the VIGITEL sample to the adult population distribution
of each city in the 2000 Demographic Census, considering each city’s population weight.
in the Southeastern region, men in the Southern region showed lower prevalences, and women in the North-eastern and Northern regions showed signifi cantly higher prevalences (Table 1).
Higher prevalences in both sexes were found in the Northern region capitals (Boa Vista [RR], Macapá [AP] and Rio Branco [AC]) and in Maceió (AL); prevalences in Manaus (AM), Porto Velho (RO), Natal (RN) and Teresina (PI) were also signifi cantly higher than the observed in Florianópolis (SC) (used as reference category). Only in men, the prevalence ratios (PR) were higher in Belo Horizonte (MG), Rio de Janeiro (RJ) and São Luís (MA), and only in wom-en, in Fortaleza (CE) and Recife (PE), when compared to the prevalence of Florianópolis (Table 2).
In both sexes, the highest percentages of poor self-rated health were observed in heavy smokers (20 cigarettes/day or more), ex-smokers, individuals with underweight or obesity, those who did not practice physical activity in leisure time, those who spent fi ve or more hours watching television daily, and those who did not watch television. Among women, smok-ers (ten to 19 cigarettes/day) also had signifi cantly higher PRs, in addition to those with overweight and those who did not regularly consume fruits and veg-etables. Inactive men (considering overall activity) showed higher prevalence ratios (PR) and those who consumed alcoholic beverages one to two times per week or smoked ten to 19 cigarettes daily showed PRs below 1 (Table 3).
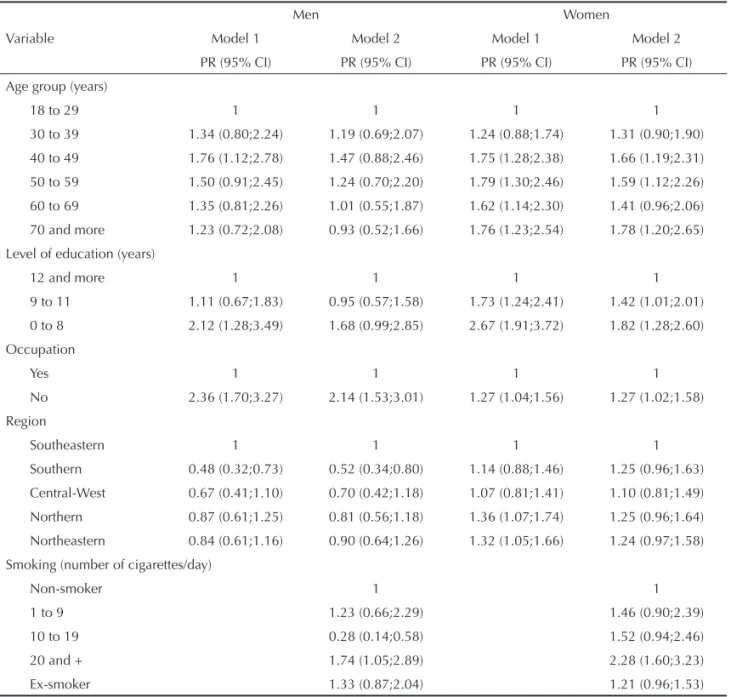
Table 4. Prevalencesa and prevalence ratios of poor self-rated health, according to socio-demographic and health-related
behavior variables, in men and women, based on two multiple regression models. Brazil, 2006. (N=54,213)
Variable
Men Women
Model 1 Model 2 Model 1 Model 2
PR (95% CI) PR (95% CI) PR (95% CI) PR (95% CI)
Age group (years)
18 to 29 1 1 1 1
30 to 39 1.34 (0.80;2.24) 1.19 (0.69;2.07) 1.24 (0.88;1.74) 1.31 (0.90;1.90)
40 to 49 1.76 (1.12;2.78) 1.47 (0.88;2.46) 1.75 (1.28;2.38) 1.66 (1.19;2.31)
50 to 59 1.50 (0.91;2.45) 1.24 (0.70;2.20) 1.79 (1.30;2.46) 1.59 (1.12;2.26)
60 to 69 1.35 (0.81;2.26) 1.01 (0.55;1.87) 1.62 (1.14;2.30) 1.41 (0.96;2.06)
70 and more 1.23 (0.72;2.08) 0.93 (0.52;1.66) 1.76 (1.23;2.54) 1.78 (1.20;2.65)
Level of education (years)
12 and more 1 1 1 1
9 to 11 1.11 (0.67;1.83) 0.95 (0.57;1.58) 1.73 (1.24;2.41) 1.42 (1.01;2.01)
0 to 8 2.12 (1.28;3.49) 1.68 (0.99;2.85) 2.67 (1.91;3.72) 1.82 (1.28;2.60)
Occupation
Yes 1 1 1 1
No 2.36 (1.70;3.27) 2.14 (1.53;3.01) 1.27 (1.04;1.56) 1.27 (1.02;1.58)
Region
Southeastern 1 1 1 1
Southern 0.48 (0.32;0.73) 0.52 (0.34;0.80) 1.14 (0.88;1.46) 1.25 (0.96;1.63)
Central-West 0.67 (0.41;1.10) 0.70 (0.42;1.18) 1.07 (0.81;1.41) 1.10 (0.81;1.49)
Northern 0.87 (0.61;1.25) 0.81 (0.56;1.18) 1.36 (1.07;1.74) 1.25 (0.96;1.64)
Northeastern 0.84 (0.61;1.16) 0.90 (0.64;1.26) 1.32 (1.05;1.66) 1.24 (0.97;1.58)
Smoking (number of cigarettes/day)
Non-smoker 1 1
1 to 9 1.23 (0.66;2.29) 1.46 (0.90;2.39)
10 to 19 0.28 (0.14;0.58) 1.52 (0.94;2.46)
20 and + 1.74 (1.05;2.89) 2.28 (1.60;3.23)
Ex-smoker 1.33 (0.87;2.04) 1.21 (0.96;1.53)
The Poisson multiple regression model, which includ-ed only sociodemographic variables, revealinclud-ed that the following continued to be signifi cant: age, level of ed-ucation, occupation and region of residence (Table 4). The incorporation of variables indicating health-relat-ed behavior (model 2) showhealth-relat-ed PRs signifi cantly high-er than 1 for both sexes, in the following categories: smoking 20 cigarettes or more per day, not practicing physical activity in leisure time, and being underweight or obese. Among women, PRs were also signifi cantly higher in those with overweight and those who did not frequently consume fruits and vegetables. Among men, higher prevalences of poor self-rated health were also found in those who did not watch television. An unusual fi nding was the PR signifi cantly lower than 1, even after adjustments, in men who smoked between ten and 19 cigarettes per day (Table 4).
The infl uence of certain chronic diseases in self-as-sessment of health is shown in Table 5. The presence of any of the chronic conditions studied doubles or triples the prevalence of poor self-rated health. In the presence of two or more morbidities, PRs of poor
self-rated health were higher in men: to have four or fi ve self-reported morbidities resulted in PR=6.9 in wom-en and PR=11.4 in mwom-en.
DISCUSSION
The most signifi cant fi ndings from this study were as follows: the consistent inequality of self-assessment of health according to the level of education; the differ-ences between Brazilian regions and capitals; the level of increase in prevalence of poor self-rated health, ac-cording to the number of self-reported chronic condi-tions; the differences in pattern of associated factors, according to sex; and the observation that the occur-rence of diseases affects self-assessment of health in men more strongly than in women.
In the population aged ≥18 years, living in the Brazil-ian capitals, this study found 5.4% of individuals who rated their health as poor, 4.3% of men and 6.3% of women. Based on the 1998 PNAD, Dachs4 found that
6% of the Brazilian population aged 15 years or older showed poor or very poor self-rated health. However, Tabela 4. continuation
Variable
Men Women
Model 1 Model 2 Model 1 Model 2
PR (95% CI) PR (95% CI) PR (95% CI) PR (95% CI)
Body mass index
Underweight 1.99 (1.04;3.80) 2.05 (1.33;3.17)
Normal weight 1 1
Overweight 1.21 (0.82;1.80) 1.62 (1.23;2.14)
Obesity 1.63 (1.07;2.48) 3.10 (2.41;3.99)
Regular consumption of fruits and vegetables
Yes 1
No 1.60 (1.24;2.06)
Physical activity in leisure time
Active 1 1
Not active 2.07 (1.42;3.01) 2.04 (1.58;2.64)
Daily hours of television
Less than 2 1
2 to 5 1.38 (0.96;1.99)
5 or more 1.43 (0.84;2.41)
Does not watch 2.32 (1.17;4.58)
a Percentage weighted to adjust sociodemographic distribution of the VIGITEL sample to the adult population distribution of
each city in the 2000 Demographic Census, considering each city’s population weight.
Model 1. Variables introduced: age group, marital status, ethnicity, number of residents, region of residence, working conditions and level of education; variables maintained: age group, region of residence and working conditions.
this proportion was 3.6% when informed by another resident. In this PNAD, 47.4% of the questions were in fact answered by the selected individuals. In the 2003 PNAD, 4.3% of the Brazilian population aged 14 years or older rated their health as poor or very poor (4.7% in women versus 3.9% in men).5 In the
WHO World Health Survey,19 9.2% of the Brazilian
population sample aged 18 years or older rated their own health as poor or very poor, with a percentage of 10.5% in women and 7.8% in men. A study performed in 2002-2003 in 15 Brazilian capitals with individuals aged 15 years or older revealed percentages of fair or poor self-rated health varying from 18.4% in Campo Grande (MS) to 36.0% in Belém (PA).
The differences among fi ndings from different studies partly result from distinct designations of categories of responses to the question about self-assessment of health. In some studies,5,16,19 the categories used were:
very good, good, fair, poor and very poor; in others,3,a
the categories were: excellent, very good, good, fair and poor. The 2006 VIGITEL survey used four cat-egories of responses (excellent, good, fair and poor), whereas the majority of studies used fi ve. However, the sum of the “poor” and “very poor” categories from the 2003 PNAD showed percentages lower than those of the present study.5 In addition to this difference, several
others explain the distinct prevalences observed among studies, such as: distinct groupings of response catego-ries, the ages of the populations studied, information obtained directly from the selected individual or from others, distinct locations of question in the question-naire, and other aspects of study design and adjust-ments in the analysis.3,5,19 Moreover, the differences
observed among countries and sub-populations are not always in agreement with objective health indicators.6
The higher prevalences of poor self-rated health in the capitals of the Northern and Northeastern regions Table 5. Prevalencesa and prevalence ratios of poor self-rated health, according to sex and presence of chronic diseases. Brazil,
2006. (N=54,213)
Variable
Men Women
Prevalence Crude PR (95% CI)
Adjusted PRb
(95% CI) Prevalence
Crude PR (95% CI)
Adjusted PRa
(95% CI) Hypertension
No 3.00 1 1 4.53 1 1
Yes 10.18 3.39 (2.50;4.59) 3.22 (2.29;4.52) 11.75 2.59 (2.15;3.12) 2.35 (1.89;2.90) Diabetes
No 3.92 1 1 5.64 1 1
Yes 13.08 3.34 (2.30;4.84) 2.79 (1.92;4.04) 16.56 2.93 (2.29;3.75) 2.43 (1.84;3.23) Osteoporosis
No 4.05 1 1 5.48 1 1
Yes 23.68 5.85 (3.68;9.30) 5.00 (3.10;8.08) 17.07 3.11 (2.52;3.56) 2.74 (2.07;3.62) Cerebrovascular accident/Myocardial infarction
No 3.97 1 1 5.94 1 1
Yes 16.24 4.09 (2.56;6.54) 3.59 (2.27;5.68) 19.02 3.20 (2.29;4.47) 2.61 (1.80;3.78) High cholesterol/Triglycerides
No 3.55 1 1 5.19 1 1
Yes 8.77 2.47 (1.78;3.43) 2.20 (1.58;3.07) 11.17 2.15 (1.79;2.59) 1.82 (1.48;2.22) Number of self-reported morbidities
0 2.72 1 1 3.65 1 1
1 4.94 1.81 (1.25;2.62) 1.83 (1.20;2.79) 7.51 2.06 (1.61;2.63) 2.15 (1.67;2.78) 2 12.23 4.49 (2.97;6.78) 4.66 (2.95;7.37) 13.92 3.81 (2.99;4.86) 4.40 (3.32;5.84) 3 22.67 8.32 (5.00;13.84) 9.05 (5.16;15.87) 19.07 5.22 (3.83;7.11) 6.42 (4.39;9.43) 4 and 5 27.64 10.14 (5.26;19.57) 11.41 (5.76;22.57) 20.45 5.60 (3.62;8.65) 6.93 (4.38;10.96)
a Percentage weighted to adjust socio-demographic distribution of the VIGITEL sample to the adult population distribution of
each city in the 2000 Demographic Census, considering each city’s population weight.
b PR adjusted for age.
are in agreement with the more unfavorable objective health indicators and socioeconomic situation ob-served in these regions. Similar results were found in other Brazilian studies, such as the ones with PNAD 19984 and INCA data.a
In the present study, poor self-rated health was more frequent in women and older individuals, in agreement with other studies.2,3,19 In Ireland, however, there was
no difference between sexes in this self-assessment.9
In this study, like those performed with 1998 and 2003 PNAD data, there was no association between self-rated health and ethnicity,4,5 differently from reports
of other countries.6,11
The percentage of poor self-rated health was higher in individuals with lower level of education, agreeing with other studies5,6,14 that have shown an association
between social inequality and self-reported health sta-tus. Muntaner et al16 found that self-rated health was
strongly associated with level of education, and social class and stratum, observing 4.4% of poor self-rated health in the capitalist class and 14.3% in the non-specialized worker class.
Not having an occupation was associated with higher prevalence of poor self-rated health in both sexes, al-though with higher PR in men. Findings from the World Health Survey detected that unemployment was asso-ciated with poor self-rated health in men exclusively.19
In the present study, poor self-rated health in heavy smokers and inactive individuals in leisure time confirms results of studies performed in other countries.2,10,11 The association with the BMI was also
observed by other authors,10,14 although there are
dis-agreeing fi ndings.11
The introduction of health-related behavior variables (model 2) reduced, but did not eliminate, the effect of education on self-assessment of health. Among the theories that try to explain the social inequalities in health, the following stand out: the structural/materi-alistic theory (explanations are centered around ma-terial conditions of life), the behavior/lifestyle-based theory (emphasis on the role of individuals’ choices) and the psychosocial theory (based on the theory of stress in disease production).14 Findings from the
present study indicate that health-related behavior does not entirely explain the socioeconomic differ-ences in self-assessment of health, an observation consistent with fi ndings from other studies.10,14
How-ever, these types of behavior represent an important mediator of the effect of education (social determi-nant) on self-rated health.
The association between the presence of any of the diseases/chronic conditions studied and poor self-rated health confi rms what has been reported by other authors,1,11,20 and the number of comorbidities has an
important effect on this indicator. Although women usually show higher percentages of poor self-rated health, PRs for presence of morbidities are higher in men,1,2 as observed in the present study. This situation
could have resulted from late diagnoses in men, detect-ing diseases in more advanced stages, or from men’s greater perception of vulnerability towards the diagno-sis of a certain disease. In VIGITEL’s questionnaire, the question about self-assessment of health precedes the questions about chronic diseases to avoid the mention of diagnosis infl uencing self-assessment of health. One of the present study limitations was the indica-tor used. Self-assessment of health is considered a valid indicator, an independent predictor of mortality and a good marker of differences among population sub-groups. In addition, it has been used to monitor clinical results and public health programs.11,14
How-ever, some authors have questioned the validity of this indicator for international comparisons and those among sub-populations, due to the infl uence of cul-tural and social factors18 and to the observation that
its results are not always in agreement with objective health indicators.6 Another limitation involves the
study’s cross-sectional design, which does not enable one to affi rm whether the associated factor determines or is determined by self-assessment of health. More-over, the VIGITEL sample only included residents in households with a fi xed telephone line, whose cover-age varied between 38.7% in Macapá and 79.4% in the Federal District.15 The post-stratifi cation
proce-dures sought to bring the obtained estimates close to those expected for the total population. On the other hand, the present study was based on a sample that included the diversity of Brazilian capitals with ad-equate sample size. Another favorable point was that data were directly obtained from selected individu-als, rather than from other informants.
In conclusion, the sharp increase in the prevalence of poor self-rated health when comorbidities are present and the association of self-rated health with unhealthy behavior indicate the importance of health promotion policies and health care improvement to avoid or de-lay the incidence of diseases and their consequences. Social and gender differences emphasize the need to provide special attention to the more vulnerable social segments, aiming to achieve greater health equity.
1. Alves LC, Rodrigues RN. Determinantes da autopercepção de saúde entre idosos do município de São Paulo, Brasil. Pan Am J Public Health. 2005;17(5/6):333-41.
2. Asfar T, Ahmad B, Rastam S, Mulloli TP, Ward KD, Maziak W. Self-rated health and its determinants among adults in Syria: a model from the Middle East. BMC Public Health. 2007;7:177. DOI:10.1186/1471-2458-7-177
3. Beltrão KI, Sugahara S. Comparação de informações sobre saúde das populações brasileiras e norte-americana baseada em dados da PNAD/98 e NHIS/96. Cienc Saude Coletiva. 2002;7(4):841-67. DOI:10.1590/S1413-81232002000400017
4. Dachs JNW. Determinantes das desigualdades na auto-avaliação do estado de saúde no Brasil: análise dos dados da PNAD/1998. Cienc Saude Coletiva. 2002;7(4):641-57. DOI:10.1590/S1413-81232002000400004
5. Dachs JNW, Santos APR. Auto-avaliação do estado de saúde no Brasil: análise dos dados da PNAD/2003. Cienc Saude Coletiva. 2006;11(4):887-94. DOI:10.1590/S1413-81232006000400012
6. Franks P, Gold MR, Fiscella K. Sociodemographics, self-rated health and mortality in US. Soc Sci Med. 2003;56(12):2505-14. DOI:10.1016/S0277-9536(02)00281-2
7. Höfelmann DA, Blank N. Auto-avaliação de saúde entre trabalhadores de uma indústria no Sul do Brasil. Rev Saude Publica. 2007;41(5):777-87. DOI:10.1590/ S0034-89102007000500012
8. Idler EL, Benyamini Y. Self-rated health and mortality: a review of twenty-seven community studies. J Health Soc Behav. 1997;38(1):21-37. DOI:10.2307/2955359
9. Kelleher CC, Friel S, Nic Gabhainn S, Tay JB. Socio-demographic predictors of self-rated health in the Republic of Ireland: fi ndings from the National Survey on Lifestyle, Attitudes and Nutrition, SLAN. Soc Sci Med. 2003;57(3):477-86. DOI:10.1016/S0277-9536(02)00371-4
10. Lantz PM, Lynch JW, House JS, Lepkowski JM, Mero RP, Musik MA, et al. Socioeconomic disparities in health change in a longitudinal study of US adults: the role of health-risk behaviors. Soc Sci Med. 2001;53(1):29-40. DOI:10.1016/S0277-9536(00)00319-1
11. Lim WY, Ma S, Heng D, Bhalla V, Chew SK. Gender, ethnicity, health behavior & self-rated health in Singapore. BMC Public Health. 2007;7:184. DOI:10.1186/1471-2458-7-184
12. Lima-Costa MF, Matos DL, Camarano AA. Evolução das desigualdades sociais entre idosos e adultos brasileiros: um estudo baseado na Pesquisa Nacional por Amostra de Domicílios (PNAD 1988, 2003) Cienc Saude Coletiva. 2006;11(4):941-50. DOI:10.1590/ S1413-81232006000400016.
13. Lynch J, Harper S, Davey Smith G. Commentary: plugging leaks and repelling boarders – where to next for the SS income inequality? Int J Epidemiol. 2003;32(6):1029-36. DOI:10.1093/ije/dyg318
14. Molarius A, Berglund K, Eriksson C, Lambe M, Nordström E, Eriksson HG, et al. Socioeconomic conditions, lifestyle factors, and self-rated health among men and women in Sweden. Eur J Public Health. 2006;17(2):125-33. DOI:10.1093/eurpub/ckl070
15. Moura EC, Morais Neto OL, Malta DC, Moura L, Silva NN, Bernal R, et al. Vigilância de Fatores de Risco para Doenças Crônicas por Inquérito Telefônico nas capitais dos 26 estados brasileiros e no Distrito Federal (2006). Rev Bras Epidemiol. 2008;11(suppl 1):20-37. DOI:10.1590/S1415-790X2008000500003
16. Muntaner C, Borrell C, Benach J, Pasarín MI, Ferandes E. The associations of social class and social stratifi cation with patterns of general and mental health in a Spanish population. Int J Epidemiol. 2003;32(6):950-8. DOI:10.1093/ije/dyg170
17. Ratner PA, Johnson JL, Jeffery B. Examining emotional, physical, social and spiritual health as determinants of self-rated health status. Am J Health Promot. 1998;12(4):275-82.
18. Sadana R, Mathers CD, Lopez AD, Murray CJL, Iburg KM. Comparative analyses of more than 50 household surveys on health status. In: Murray CJL, Salomon JA, Mathers CD, Lopez AD.Summary measures of population health: concepts, ethics, measurement and applications. Geneva: WHO; 2002. p.369-86.
19. Szwarcwald CL, Souza-Júnior PRB, Esteves MAP, Damacena GN, Viacava F. Socio-demographic determinants of self-rated health in Brazil. Cad Saude Publica. 2005;21(Suppl 1):S54-64. DOI:10.1590/ S0102-311X2005000700007
20. Theme-Filha MM, Szwarcwald CL, Souza-Junior PRB. Socio-demographic characteristics, treatment coverage, and self-rated health of individuals who reported six chronic diseases in Brasil, 2003. Cad Saude Publica. 2005;21(Suppl1):S43-53. DOI:10.1590/S0102-311X2005000700006
21. Victora CG, Huttly SR, Fuchs SM, Olinto MT. The role of conceptual frameworks in epidemiological analysis: a hierarchical approach. Int J Epidemiol. 1997;26(1):224-7. DOI:10.1093/ije/26.1.224 REFERENCES
This article underwent the peer review process adopted for any other manuscript submitted to this journal, with anonymity guaranteed for both authors and reviewers. Editors and reviewers declare that there are no confl icts of interest that could affect their judgment with respect to this article.