Rev Saúde Pública 2004;38(2) www.fsp.usp.br/rsp
Prevalence of low visual acuity in public
school’s students from Brazil
Reinaldo José Gianinia,b, Eduardo de M asib, Eliane Cleto Coelhob, Franck Ricardo O réficeb and Renato Augusto de M oraesb
aDepartamento de Medicina Preventiva da Faculdade de Medicina da Universidade de São Paulo.
São Paulo, SP, Brasil. bFaculdade de Ciências Biológicas do Centro de Ciências Médicas e Biológicas
da Pontifícia Universidade Católica. Sorocaba, SP, Brasil
Correspondence to:
Reinaldo José Gianini
Rodovia João Leme dos Santos, Km 107 18052-780 Sorocaba, SP, Brasil E-mail: [email protected]
Received on 15/10/2002. Reviewed on 11/9/2003. Approved on 5/11/2003. Keywords
Visual acuity. School health. Eye health. Students. Prevalence. Health services accessibility.
Abstract
Objective
Low visual acuity (VA) is an important public health problem due to its high prevalence and because it needs early diagnosis in order to prevent damage in childhood development and apprenticeship. To describe and analyze low visual acuity (VA) prevalence among school children
Methods
Once performed the VA test to 1st and 4thgrades primary school children data were analyzed by separating students according to sex, school grade, wearing of glasses, residence area and level of access to the supplementary medical assistance (SMA). Results
The total of 9,640 students was evaluated during the year of 2000 and they presented a prevalence of low VA of 13.1% (CI 12.5-13.8%). There was a statistical significant lower prevalence in males (11.5%) compared to females (14.9%) - (PR=0.77). There was a statistical significant higher prevalence in 1st grade students (14.1%) compared to 4th grade (11.5%) - (PR=1.22). There was also a statistical significant lower prevalence for those who were not wearing glasses (12.1%) compared to those who were using glasses (42.0%) - (PR=0.29). Concerning to residence areas, Cajuru neighborhood had the lower prevalence of low VA (1.8%) and Vila Sabia neighborhood had the higher prevalence (32.4%), and a positive correlation, according to residence area, between the proportion of people with access to the Supplementary Medical Assistance and the proportion of children wearing glasses was found (r=0.64, p<0.001).
Conclusions
The low VA high prevalence shows lack in early diagnosis and continuity of assistance pointing out to the urgent need of implementation in visual health public.
INTRODUCTION
Vision is the primary means of integration between individual and external environment, and knowledge is to a great extent acquired visually. Visual problems have negative effects on learning and social interac-tion, thus affecting the natural development of
intel-lectual, academic, professional, and social abilities.15
Several authors recognize the association between
adequate academic performance and good visual
health.6
Data from international studies11 show that
approxi-mately 25% of school-age children carry some form of visual deficiency. However, are unlikely to report
such problems to relatives or teachers.6
Rev Saúde Pública 2004;38(2) www.fsp.usp.br/rsp Baixa acuidade visual em escolares
Gianini RJ et al
The first of these was carried out in 2000 by School Healthcare Agents of the Programa Escola Saudável. These agents evaluated the visual acuity of 1st and 4th grade students from municipal and state elemen-tary schools. The exam was carried out after paren-tal/caretaker consent was obtained through School Administration.
Evaluation was performed using a Snellen chart (whose scores vary between 0.1 and 1.0). The child was placed five meters away from the chart, and optotypes were indicated using a black pencil placed vertically two centimeters below the character, as recommended by the Conselho Brasileiro de Oftalmologia (Brazilian Ophthalmology Council). Each eye was examined sepa-rately. Children who wore eyeglasses were examined with their eyeglasses appropriately placed. Children who recognized Snellen line 3 optotypes (VA=0.8) with both eyes were considered as having normal visual acuity. Children who did not recognize this line – with one or
both eyes – were classified as with LVA.3
Data from each classroom were registered in a file, including student’s name, grade and VA values for each eye. Students who had difficulty reading the table were referred to ophthalmologists at the Sorocaba Ophthalmologic Hospital.
In the second stage (2001-2002), the results re-corded in the visual screening files were analyzed. The number of school children who underwent the test was recorded, as well as the number of LVA chil-dren (one or both eyes). These data were grouped initially by school, and then by Health Center refer-ence area.
Children absent at the day of the test, whose names or scores were not legible written on the files, who’s sex could not be defined based on the records, or who could not take the test, despite being willing to do so, due to comprehension problems, were excluded.
Children were classified according to visual acu-ity (normal (VA=0.8) or low (VA<0.8), sex, grade (1st and 4th) and use of eyeglasses (yes/no).
The proportion of subjects with access to supple-mentary healthcare in a given reference area was esti-mated based on the proportion of deliveries in the area performed by the SHC system (which includes direct procedure payment and health plans or insur-ance) in 2000.
The Relative Risk (Prevalence Ratio) of LVA was calculated between sexes (male/female), grades (1st/ 4th) and use of eyeglasses (yes/no).
of the early diagnosis of visual problems as an essen-tial means of minimizing and preventing severe prob-lems in the future, including amblyopia and
strabis-mus.6 In developing countries, the scenario is even
more worrisome: data show that 80% of blindness cases worldwide occur in these countries, and that two-thirds
of these cases are either preventable or curable.14
From the public health perspective, mass investi-gation of visual problems in children by ophthal-mologists is too costly, which suggests the adminis-tration of visual acuity tests by non-physicians, as long as trained and supervised. This is the recom-mended procedure when dealing with populations clustered into schools, within the age group in which
visual problems are a priority.14
Routine visual acuity evaluation is aimed at ensur-ing good visual health, helpensur-ing to attenuate the high rates of school dropout and academic failure, and pre-venting several more important visual
complica-tions.14 Thus, visual acuity screening programs in
schools are directed towards the identification of chil-dren in need of ophthalmologic care.
In the municipality of Sorocaba, southeastern Bra-zil, such screening has been accomplished by the Programa Escola Saudável (Healthy School Program - PES). This program provides counseling by a healthcare team to maternities, day care centers, pre-schools, and elementary schools for the promotion of health and the prevention of diseases. Its activities include, among others, actions directed to Hygiene, Nutrition, and Mental, Oral, and Visual Health.
From the collective health standpoint, to describe and analyze the prevalence of low visual acuity in schoolchildren as diagnosed by healthcare agents may be of great value for the planning and improvement of preventive measures and for the establishment of local visual healthcare programs, capable of reduc-ing the inequity existent in contemporary Brazilian
healthcare, reported by various authors.2
Thus, the present study’s general goal is to describe the prevalence of low visual acuity among elemen-tary school students.
M ETH O D S
The study was conducted with first- and fourth-grade students form elementary schools of the public network in Sorocaba, southeastern Brazil. LVA diag-nosis was performed on 9.640 schoolchildren.
!
Rev Saúde Pública 2004;38(2) www.fsp.usp.br/rsp
Baixa acuidade visual em escolares Gianini RJ et al
Pearson’s correlation test was performed for the dis-tribution of variables “access to supplementary healthcare”, “use of eyeglasses”, and “low visual acu-ity” by reference area. In case a correlation was sig-nificant, a Linear Regression analysis was carried out.
Data analysis was carried out using Epi Info v.6.04d and Bioestat 2.0 software.
RESU LTS
The analysis included 47 public network schools and 19 private schools, located within the reference areas of 26 Health Centers, covering 100% of the municipality of Sorocaba, southeastern Brazil. The 4th grade schools evaluated were located in 19 Health Center areas, covering 73.1% of the municipality. The 1st grade schools were located in all 26 areas, that is, 100% of the municipality.
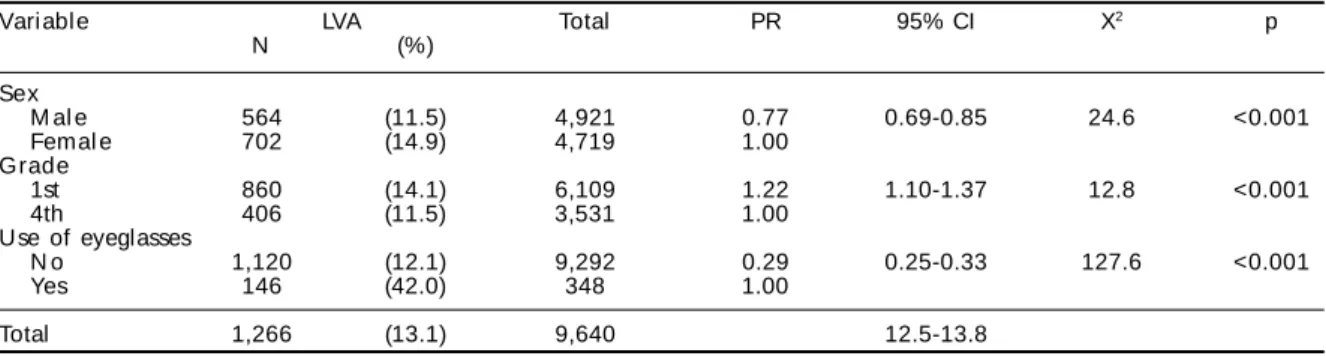
According to the number of students enrolled in the schools included in the visual screening, a total 10,982 students should have been evaluated. This did not happen in practice, however, due to the large number of absences registered on the day of the test (1,307 students, 11.9%). Furthermore, 7 students whose sex could not be determined based on the ex-amination file, 14 whose names or test results were illegible, and 14 who were not able to take the test were excluded from the second stage of the study, totalizing 1,342 losses (12.2%). Thus the second stage of the study included information on 9,640 students, of which 1,266 had low visual acuity (13.1% preva-lence, 95% CI 12.5-13.8%).
Of the 9,640 students evaluated, 4,921 (51.0%) were male and 4,719 (49.0%) female. Prevalence of LVA was 11.5% among male students (95% IC 10.6-12.4%), and 14.9% among female students (95% CI 13.9-15.9%). The prevalence ratio for male students was 0.77 (95% CI =0.69-0.85) (Table 1).
First-graders accounted for 63.4% of the sample
(6,109 students), and fourth-graders for 36.6% (3,531 students). Prevalence of LVA was 14.1% among first-graders (95% CI 13.2-15.0%) and 11.5% among fourth-graders (95% CI 10.5-12.6%). The prevalence ratio for first graders was 1.22 (95% CI 1.10-1.37).
Of the total 9,640 students analyzed, 348 (3,6%) wore eyeglasses. Of these, 146 had visual acuity be-low 0.8 even with their eyeglasses appropriately placed (42.0% prevalence, 95% CI 36.7-47.3%). Of the 9,292 students who did not wear eyeglasses, 1.120 had VA<0.8 (12.1% prevalence, 95% CI 11.4-12.7%). The prevalence ratio for students without eyeglasses was 0.29 (95% CI 0.25-0.33).
LVA prevalence ranged, according to reference area, from 1.8% in Cajurú to 32.4% in Vila Sabiá; the pro-portion of subjects with access to supplementary healthcare varied between 0.13 in Lopes de Oliveira and Nova Esperança and 0.49 in Vila Santana; and the prevalence of eyeglasses ranged from 1.3% in Eden to 9.8% in Vila Santana. No significant correlation was observed between LVA and access to SHC (r=-0.0476; p=0.8174), nor between LVA and use of eyeglasses (r=0.2097; p=0.3039). However, a significant correla-tion was observed between use of eyeglasses and ac-cess to SHC (r=0.6376; p=0.005) (Table 2).
Linear regression analysis between access to SHC (independent variable) and use of eyeglasses (depend-ent variable) results were: F=16.41, strongly signifi-cant (p=0.0007), intercept (a) =0.2760, and regres-sion coefficient (b) =12.91 (Figure).
D ISCU SSIO N
Situation in Sorocaba
The prevalence of low visual acuity among 1st and 4th grade students found in the present study was 13.1%. There are few studies in the literature includ-ing students from these two grades only, which limits the validity of comparisons. Moreover, many studies Table 1 – Distribution of the public network students analyzed, according to studied variables and visual acuity. Sorocaba, 2000.
Variable LVA Total PR 95% CI X2 p
N (%)
Sex
M al e 564 (11.5) 4,921 0.77 0.69-0.85 24.6 <0.001
Femal e 702 (14.9) 4,719 1.00
Grade
1st 860 (14.1) 6,109 1.22 1.10-1.37 12.8 <0.001
4th 406 (11.5) 3,531 1.00
Use of eyeglasses
N o 1,120 (12.1) 9,292 0.29 0.25-0.33 127.6 <0.001
Yes 146 (42.0) 348 1.00
Total 1,266 (13.1) 9,640 12.5-13.8
" Rev Saúde Pública 2004;38(2) www.fsp.usp.br/rsp Baixa acuidade visual em escolares
Gianini RJ et al
have different methodologies. Most studies use the visual acuity test only as a preliminary exam for the selection of subjects for more detailed examination. Still, we have managed to com-pare our data to those of other somewhat simi-lar studies. The prevalence of LVA among
stud-ies similar to ours varied from 7.6 to 29%.1,7
A comparison of the LVA prevalence found in Sorocaba and those from the aforemen-tioned studies places Sorocaba in an interme-diate position. This does not mean that Sorocaba students have good visual health, for the 13.1% prevalence found is potentially reducible. Despite being less than half the
value of the highest prevalence found (29%),7
the prevalence in Sorocaba is still almost
twice the lowest value (7.6%).1
The number of students absent on the day of the test (11.9%) must be considered when discussing the prevalence of LVA found in the present study. Such a high rate of absenteeism will led to a underestimation of actual levels in case a larger proportion of LVA individuals is included among the absentees.
Two studies help us understand factors that may
have led to the large number of absentees registered.10,4
In a study carried out in the city of Osasco
(southeast-Table 2 – Proportion of the population w ith access to supplementary healthcare, prevalence of low visual acuity and prevalence of use of eyeglasses among the public network students analyzed, according to reference area. Sorocaba, 2000.
Reference area* LVA Proportion with access to Prevalence of
SH C eyegl asses
(%) (%)
Apareci di nha 7.6 0.20 3.0
Brigadeiro Tobias 13.8 0.14 2.8
Cajuru 1.8 0.28 3.5
Cerrado 14.3 0.36 6.4
Centro de Saúde-Escola 19.2 0.47 9.0
Éden 3.8 0.23 1.7
Jardim Simus 12.2 0.32 3.9
Laranj ei ras 21.8 0.20 1.9
Lopes de Oliveira 9.7 0.13 2.5
M arcia M endes 17.9 0.31 4.5
Maria do Carmo 14.2 0.44 2.5
M ari a Eugeni a 9.4 0.31 1.3
M i nei rão 8.8 0.24 3.0
N ova Esperança 7.9 0.13 1.6
N ova Sorocaba 13.6 0.23 3.9
São Bento 14.4 0.19 3.1
Sorocaba I 14.6 0.25 3.6
Vila Angélica 15.2 0.27 4.5
Vila Barão 8.7 0.25 1.9
Vila Barcelona 13.8 0.30 4.5
Vila Fiore 11.8 0.29 6.2
Vila Haro 12.6 0.46 4.2
Vila H ortência 17.1 0.32 3.3
Vila Sabiá 32.4 0.15 4.9
Vila Santana 7.9 0.49 9.8
Vitória Régia 14.2 0.16 1.6
*significant correlation (r=0.6376; p=0.0005) betw een use of eyeglasses and access to SH C; nonsignificant correlations between LVA and use of eyeglasses (r=0.2097; p=0.3039) and LVA and access to SHC (r=-0.0476; p=0.8174).
LVA = Low visual acuity
SH C = supplementary healthcare
ern Brazil), 2,238 of the 2,280 enrolled students were
tested, a 1.84 absentee rate.10 However, this
evalua-tion included a prior effort directed towards increas-ing family awareness and pedagogically preparincreas-ing the target population; teachers were instructed to develop means of raising the students’ interest in the test through games and recreational activities. The Oftalmologia Sanitária project4 found that a large
Prevalence of use of eyeglasses (%)
Linear Regression: F = 16.41; p=0.0007; a=0.276; b=12.91 Each dot represents
one Health Center reference area
Proportion of the population with access to assistência médica supletiva. Sorocaba, 2000
0.1 0.2 0.3 0.4 0.5
10
8
6
4
2
0
#
Rev Saúde Pública 2004;38(2) www.fsp.usp.br/rsp
Baixa acuidade visual em escolares Gianini RJ et al
number of children did not come to school on the day of the test. A large number absences was regis-tered throughout the entire length of the project, and the authors suggest that, since the absent children belonged to low purchasing-power classes, socioeco-nomic factors might have contributed towards such high absenteeism. This could be explained by the lack of information and interest in matters related to education observed among poorer classes, which combine with the health-related problems character-istic of these populations, such as malnutrition and the consequent increase in disease incidence, to pre-vent school attendance.
On the other hand, the low specificity of this form of diagnosis may have contributed towards an over-estimation of the prevalence in Sorocaba. In a 1989
study,4 the number of false-positives reached 63.4%
of students referred to more detailed examination af-ter visual acuity screening. In this study, the high incidence of false-positive outcomes may be ex-plained by a certain level of insecurity observed among volunteer screeners, who, in case of doubt, refer the student to ophthalmologic examination.
The use of a =0.8 visual acuity level as a referral criterion yields 17 positives for every 3 false-negatives. However, if a =0.7 visual acuity cutoff point is employed (as in the present study), this relation-ship shifts to 9 false-positives for every 6
false-nega-tives.14 This corroborates the hypothesis that the
prevalence of LVA found in the municipality of Sorocaba may be an overestimate, since, even though there is a certain level of compensation, false-posi-tives still exceed false-negafalse-posi-tives in 50%.
If the cutoff point were VA=0.8, the number of false-positives would be more than twice the number found when using the AV=0.7 threshold, generating a costly exaggeration in terms of public health planning. A VA=0.5 cutoff point would generate an almost three-fold increase in the number of false-negatives (the main error to be avoided in this type of program). Thus, the
VA=0.7 threshold seems to be the most adequate.14
An alternative for reducing the prevalence of LVA in Sorocaba would be the implementation of sanitary ophthalmology projects among non-school-age chil-dren (or preschool chilchil-dren) who seek medical care with pediatricians from the municipal healthcare net-work. Most forms of amblyopia do not respond to treatment after age 6-7 years, resulting in permanent visual deficiency. In addition, at age 7 years most children are already passed the age when best thera-peutic results can be obtained for refraction
prob-lems associated with strabismus and amblyopia.14
However, such proposal may be hampered by pediatricians’ lack of knowledge of ophthalmologic
problems in children and newborn.9 Furthermore, the
number of pediatricians who do not perform ophthal-mologic exams on their patients is also high. Only 20% of pediatricians perform routine evaluations in newborn babies, and 64% do not perform any routine examinations on infants. Thus, training these profes-sionals is a necessary step, since survey results indi-cate that 25.4% of pediatricians consider it
unneces-sary to verify the vision of children below school age.9
Several specialists emphasize the importance of early detection of ocular problems in infants, pre-school children, and first-grade children as one of the most effective measures for the prevention of
visual deficiencies.1,10,14
Relationship between LVA and gender
The present study found a significant difference in the prevalence of low visual acuity between sexes; LVA prevalence was greater among girls (14.9%) than among boys (11.5%). This is probably due to the greater frequency suggested for ocular diseases among females. This hypothesis is corroborated by a study carried out in 1994, in which 217 children with visual deficiencies were found in a screening of 1,397 stu-dents aged 5-17 years. Of these 217 subjects selected for a more detailed examination, 149 (69%) were fe-males, and 68 (31%), males. After ophthalmologic examination, of the 135 students with some sort of refraction problem, 94 (70%) were female and 41
(30%) were male.13
Data from a study conducted by the Associação Brasileira de Deficientes Visuais (Brazilian Visual Deficient Association) in 98 municipalities of
North-eastern Brazil15 also supports this hypothesis. This
study found a predominance of females (62.6%) when compared to males (37.4%) among subjects with visual impairment.
Relation between LVA and grade
The present study found a greater prevalence of LVA among 1st grade students when compared to 4th graders. This difference maintained itself even when the comparison was restricted to the 19 areas with data registered for both grades (data not shown).
$ Rev Saúde Pública 2004;38(2) www.fsp.usp.br/rsp Baixa acuidade visual em escolares
Gianini RJ et al
with ophthalmologic problems are included in the evaluation, since there has not been enough time for the teacher to identify these students’ academic short-comings. However, when evaluating the visual acu-ity of fourth-graders, students with poor academic standings were not evaluated, for the period between 1st and 4th grades gives teachers enough time to iden-tify any academic achievement problems and thus to refer students to the ‘acceleration classes’.
This hypothesis is supported by a including 270 low-achievement students, which concluded, by means of ophthalmologic exams, that only 50 (19.5%)
satisfied all criteria for being considered as ‘normal’.6
According to the authors, this is equivalent to saying that 80.5% of subjects in this sample could have their academic shortcomings explained by low visual acu-ity or refraction problems. It should be emphasized that a large number of children labeled as incapable – many of which are referred to ‘special classes’ –
may actually be suffering from refraction problems.12
Another hypothesis is that 4th graders are at a higher level of psychomotor development, and thus are capa-ble of better understanding the explanations preced-ing the test, and hence achievpreced-ing better test results.
Furthermore, since 4th graders are obviously older – around age 10 years –, it is expected that they have already been submitted to the Snellen test in other occasions, and perform better due to their familiarity with the table.
The hypothesis that prevalence is lower among fourth-graders because of adequate care and correc-tion of visual acuity by the use of corrective lenses can be discarded, since, as we pointed out in the re-sults section, and will further discuss in the section below, the prevalence of LVA is greater among eye-glass wearers.
Relation between LVA and use/nonuse of eyeglasses
The prevalence of low visual acuity was higher among eyeglass wearers (42.0%) when compared to non-wearers (12.1%). This may be related to a lack of follow-up and updating of the prescription lenses worn by children. The unfavorable economic scenario and the lack of complaints from the child or of observation by parents and teachers may account for the insuffi-cient correction provided by lenses worn by children.
In a study carried out in 1979, of the 564 school-children evaluated, 52 wore optical correction. After ophthalmologic evaluation, 12 eyeglasses (23.8%)
were maintained, 18 (34.6%) were updated, and 22 (42.8%) were removed. Furthermore, of the
remain-ing students, 55 required optical correction.8 In a
study carried out with pre-school children,5 of the
five eyeglass wearers selected for further examina-tion, 3 (60%) had their prescriptions updated. These data support the results found in the present study, since the majority of eyeglass wearers required pre-scription updating, or even removal.
It would be appropriate that all children, when they are enrolling in 1st grade, undergo ophthalmologic examinations, or, at least, have their visual acuity
measured.14 But this is not enough. It seems to us
inadequate to promote a visual health program for children one year – 1st grade – and not to provide follow-up in subsequent years, since the optical cor-rection provided may cease to fulfill the child’s needs, or even, in certain cases, become hazardous to the child’s health. A minimal goal for visual health pro-grams should be to perform visual evaluations at ages
4, 7 and 13 years.14
Access to supplementary healthcare and use of corrective lenses
The analysis of LVA prevalence according to refer-ence area was not related to access to supplementary healthcare. As an initial hypothesis, this may be re-lated to shortcomings in this sector in terms of diag-nosis and treatment. The hypothesis of treatment fail-ure is supported by the absence of a correlation be-tween LVA and use of eyeglasses, a result consistent with that of the association analysis between use of eyeglasses and LVA, which indicated a greater risk of LVA among wearers, already discussed above. How-ever, we wish to emphasize that the data indicate that treatment failure does not occur only among students who depend on the public network, but also among those with access to supplementary healthcare.
%
Rev Saúde Pública 2004;38(2) www.fsp.usp.br/rsp
Baixa acuidade visual em escolares Gianini RJ et al
The present study indicates the existence of short-comings in the early diagnosis of low visual acuity, as evidenced by the high prevalence registered among students without eyeglasses. It also suggests that such shortcomings are especially prejudicial to those without access to supplementary healthcare, and points towards a poor continuity of ophthalmo-logic care, as evidenced by the high prevalence of LVA among eyeglass wearers due to the inadequacy of their corrective lenses. Therefore, the implementa-tion of a public visual health program is urgent, nec-essary, and imperative if a reduction of the negative
consequences of LVA prevalence is to be achieved.
ACKN O W LED GEM EN TS
We would like to thank Dr. José Manoel Amadio
Guerrero and Dra.Iara Regina L. R. Krüger from the
Municipal Secretariat of Health of Sorocaba for pro-viding the data on which the resent study is based. We thank Gisele Bernardi, Maurício Migliorini, and Rosemeire de Franco Vaz, of the Faculdade de Ciências Biológicas (PUCSP) for their help with or-ganizing the data.
REFEREN CES
1. Alberto FL, Callera F, Daré GNR, Rodrigues MLV. Estudo das condições oculares em uma população de estudantes de primeiro grau na cidade de Ribeirão Preto. Arq Bras Oftal 1992;5:188.
2. Almeida C, Travassos C, Porto S, Labra ME. Health sector reform in Brazil: a case study of inequity. Int J Health Serv 2000;30:129-62.
3. Alves MR, José NK. Veja bem Brasil: manual de orientação. São Paulo: Conselho Brasileiro de Oftalmologia; 1998. p. 31.
4. Constanti FU, Costa MS, Salgado MB, Bastos CLM, Benchimol E. Avaliação das alterações oculares encontradas na aplicação do projeto de oftalmologia sanitária escolar. Rev Bras Oftalmol 1989;48:39-42.
5. Costa M N, M acchiaverini-Filho N, José NK, Rangel FF, Rueda G, Pereira VL. Estudo da incidência de ambliopia e ansiometropia em pré-escolares. Arq Bras Oftalmol 1979;42:249-52.
6. Lauretti-Filho A, Romão E. Estudo da acuidade visual e dos erros de refração em crianças com baixo rendimento escolar. Rev Bras Oftalmol 1982;41:31-6.
7. Lima HCMV, Verçosa IC, Oliveira JP, Alves KM, Monte FQ. Prevalência de ambliopia em escolares da rede pública de fortaleza. Arq Bras Oftalmol
1997;60:362.
8. M acchiaverni-Filho N, José NK, Rueda G, Pereira VL, Costa MN, Rangel FF et al. Levantamento oftalmoló-gico em escolares da primeira a quarta série do primeiro grau na cidade de Paulínia, São Paulo. Arq Bras Oftalmol 1979;42:289-94.
9. Manso PG, Ribeiro MD, Belfort-Jr R, Chinen N, Niero AL, Ribeiro CR. Avaliação do conhecimento oftalmoló-gico entre pediatras. Arq Bras Oftalmol 1988;52:74-6.
10. M oreira JBC. Projeto Osasco: exame de pré-escolares na cidade de Osasco em 1975. Arq Bras Oftalmol 1983;46:24-7.
11. Pettiss S. Os olhos dos inocentes. Saúde Mundo 1993;46:2-3.
12. Romani FA. Estudo oftalmológico em escolares da cidade de Jaraguá do Sul (SC). Arq Bras Oftalmol 1981;44:143-4.
13. Siqueira GB, Siqueira MCRG. Projeto de oftalmologia sanitária escolar no Município de São Romão, Minas Gerais. Rev Bras Oftalmol 1994;53:71-4.
14. Temporini ER. Ação preventiva em problemas visuais de escolares. Rev Saúde Pública 1984;18:259-62.