O
RIGINALA
RTICLE Revista Brasileira de FisioterapiaPrevalence of the use of physical therapy
services among the urban adult
population of Lages, Santa Catarina
Prevalência da utilização de serviços de fisioterapia entre
a população adulta urbana de Lages, Santa Catarina
Moretto LC, Longo GZ, Boing AF, Arruda MP
Abstract
Objective: To describe the prevalence of physical therapy service use among the urban adult population of Lages (Santa Catarina), according to demographic and socioeconomic variables. Methods: A population-based cross-sectional study with multiple-stage sampling was carried out among adults aged 20 to 59 years (n=2051). Data were gathered by means of interviews at the participants’ home, in which they provided information on the use of physical therapy services over their lifetime. The prevalence of this outcome was estimated for the entire population according to sex, age, educational level, self-evaluation of health, and income. Results: The prevalence of physical therapy service use was 33.5% (95% CI: 33.0%-39.8%) among men and 31.5% (95% CI: 28.9%-34.1%) among women. Regarding the other demographic variables investigated, the prevalence of physical therapy use increased with age and was highest among the 50 to 59 year-old group (47.2%; 95% CI: 42.4%-52.0%). The prevalence was also higher among participants of self-reported Asian background (45.9%; 95% CI: 29.1%-62.7%). Regarding socioeconomic variables, it was observed that groups with better indicators reported greater service use: 46.9% (95% CI: 42.3%-51.5%) in the highest income range and 37.5% (95% CI: 34.4%-40.7%) in the range of 12 to 15 years of education. Conclusion: The present study found that physical therapy service use varied among this population according to the participants’ socioeconomic and demographic characteristics.
Key words: physical therapy; prevalence; health services; epidemiology.
Resumo
Objetivo:Descrever a prevalência da utilização de serviços de fisioterapia entre a população adulta urbana de Lages (Santa Catarina) segundo variáveis demográficas e socioeconômicas. Métodos: Realizou-se um estudo transversal de base populacional com amostra obtida em múltiplos estágios ecomposta poradultos entre 20 e 59 anos (n=2.051).Os dados foram coletados por meio de entrevistas domiciliares em que se obtevea informação por parte dos sujeitos de pesquisa sobre o uso, em algum momento da vida, de serviços de fisioterapia. Foi calculada a prevalência desse desfecho para a população global segundo sexo, idade, escolaridade, autoavaliação em saúde e renda. Resultados: Observou-se que a prevalência da utilizaçãode serviços de fisioterapia foi de 33,5% (IC95%
33,0%-39,8%) entre os homens e de 31,5% (IC95% 28,9%-34,1%) entre as mulheres. Quanto às demais variáveis demográficas investigadas,
verificou-se que a prevalência do uso da Fisioterapia aumentou de acordo com a idade dos indivíduos, sendo o maior valor relatado no grupo de 50 a 59 anos (47,2%; IC95% 42,4%-52,0%) e foi maior entre as pessoas que referiram cor amarela (45,9%; IC95% 29,1%-62,7%).
Em relação às variáveis socioeconômicas, constatou-se que grupos com melhores indicadores reportaram maior uso do serviço, sendo esse valor equivalente a 46,9% (IC95% 42,3%-51,5%) no estrato de maior renda e a 37,5% (IC95% 34,4%-40,7%) entre aqueles de
12 a 15 anos de estudo. Conclusão: Observou-se, no presente estudo, que o uso de serviços de fisioterapia variou na população de acordo com as características socioeconômicas e demográficas das pessoas investigadas.
Palavras-chave: fisioterapia; prevalência; serviços de saúde; epidemiologia.
Received: 13/03/2008 – Revised: 05/09/2008 – Accepted: 12/12/2008
Graduate Program in Collective Health, Universidade do Planalto Catarinense (UNIPLAC), Lages (SC), Brazil
Introduction
The changes in the age distribution and in the epide-miologic profile of the Brazilian population in the past few decades have posed new challenges to managers, service providers and professionals in the areas of healthcare and health promotion. Among the elements that triggered these changes are the ageing of the population and the increase in chronic diseases, with special emphasis on the magnitude of injuries in the morbidity and mortality profile of the begin-ning of the 21st century1-3. This demographic and
epidemio-logic scenario, i.e. this context of a growing older population and an increasing rate of injuries, highlights the relevance of the incorporation of physical therapy into health practices, both in its conceptual dimension which involves principles that support the discourse on health promotion and in its methodological aspect related to the practices, strategies and interventions4.
As a health science that studies, prevents and treats move-ment disorders caused by genetic changes, traumas, acquired diseases, pathological changes and their psychological and organic repercussions, physical therapy aims at conserving, de-veloping or restoring the integrity of organs, systems, or func-tions5. It is also capable of reducing the need for more costly
or traumatic treatments, preventing diseases and promoting health. In spite of that, there is a wide gap in the scientiic lit-erature regarding the prevalence of its use by the population.
he search carried out in LILACS (Latin-American and Caribbean Literature on Health Sciences), Medline (Medical Literature Analysis and Retrieval System Online) and SciELO (Scientiic Electronic Library Online), using the descriptor “physical therapy” associated with terms such as “epidemiol-ogy”, “services”, “Public Health System (SUS)”, “public service”, “Family Health Program (PSF)” and “health centers”, resulted in a single population-based study carried out in Pelotas, Rio Grande do Sul, in 20036. he remainder of the articles
referred to the use of physical therapy in the treatment and rehabilitation of patients or to the qualiications of physical therapists. he research developed by Siqueira, Facchini and Hallal6 in Pelotas showed that the prevalence of the use of
physical therapy services in the Brazilian sample was lower than in some developed countries and in other developing countries. hese indings are relevant because they indicate the need for new studies that describe the prevalence of the use of physical therapy services in Brazil and that test its distribution according to demographic and socioeconomic characteristics. herefore, this study intends to partly ill out this gap by analyzing and describing the data obtained in a population-based study carried out in a medium-sized city in southern Brazil.
Methods
A cross-sectional, population-based study was carried out in the city of Lages, Santa Catarina, located in the mountain region and 176.5 km from the state capital. In 2004, Lages had an infant mortality rate of 22.8 deaths per 1000 live births, a life expectancy of 71.9 years, and, in the year 2000, scored 0.813 in the Municipal Human Development Index7,8.
he reference population for the study consisted of male and female adults aged 20 to 59 years at the time of the study and living in the city’s urban area. his age group represented approximately 52% of the population of Lages, which totaled 168382 people in 20069. To determine the sample size, we used
the formula for prevalence estimation based on a reference population of 86998 people, conidence level of 95%, unknown expected prevalence of the phenomenon (50%), sampling error of 3.5%, and efect of study design (cluster sampling) estimated at two. Ten percent were added in order to make up for the refusals and losses, and 20% considering the existence of con-founding variables. he calculation of the sample size was car-ried out in the Epi Info application10.
he inal sample consisted of 2051 adults. A prevalence of 50% was used because the present study is part of a broader research project that analyzed other outcomes and associated factors with unknown prevalence, such as: self-referred dis-eases, life habits, blood pressure, physical activity, oral health, educational level, income, demographic factors, etc.
hrough cluster sampling, 60 census areas were randomly selected by draw from the 186 census areas of the municipal district by means of a simple random sampling without re-placement using tables of random numbers. A city block from each area was selected by draw, and a corner from each block was selected to begin the data collection in the homes. In each one of the selected homes, all residents aged 20 to 59 were po-tentially eligible to take part in the study.
he information was processed in the Epi Info 6.04 applica-tion, and two databases were created with the data entered by two professionals trained for this task. he consistency of the databases was veriied. In the data analyses, the composition of the sample was described according to the population groups. Next, the prevalence of the use of physical therapy services in the global population and according to each independent variable was displayed, and the chi-square test was used to verify whether the diferences were statistically signiicant. A p<0.05 value was adopted as the cutof value to reject the null hypothesis. he statistical package Stata 9 was used for the analyses, and the research was approved by the Research Eth-ics Committee of Universidade do Planalto Catarinense, under protocol number 01/2007. All of the patients read and signed a consent form, according to the requirements of Resolution 196/96 of the National Health Council.
Results
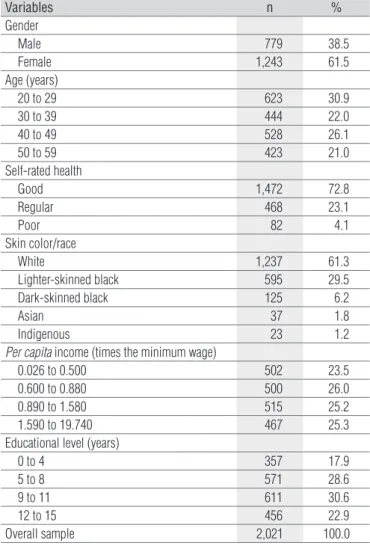
he inal sample consisted of 2,022 individuals, including 779 men and 1,243 women, with a loss rate of 1.4%. As shown in
Variables n %
Gender
Male 779 38.5
Female 1,243 61.5
Age (years)
20 to 29 623 30.9
30 to 39 444 22.0
40 to 49 528 26.1
50 to 59 423 21.0
Self-rated health
Good 1,472 72.8
Regular 468 23.1
Poor 82 4.1
Skin color/race
White 1,237 61.3
Lighter-skinned black 595 29.5
Dark-skinned black 125 6.2
Asian 37 1.8
Indigenous 23 1.2
Per capita income (times the minimum wage)
0.026 to 0.500 502 23.5
0.600 to 0.880 500 26.0
0.890 to 1.580 515 25.2
1.590 to 19.740 467 25.3
Educational level (years)
0 to 4 357 17.9
5 to 8 571 28.6
9 to 11 611 30.6
12 to 15 456 22.9
Overall sample 2,021 100.0
Table 1. Sample distribution. Lages, Santa Catarina, 2007.
Table 1, most interviewees were 20 to 29 years old, white, with a per capita income between 1.59 and 19.8 times the minimum wage and 12 to 15 years of education.
he prevalence of the use of physical therapy services among the adult population of Lages was 33.2% (IC95% 31.0%-35.3%) with a higher rate among men (36.4%; IC95% 33.0%-39.9%) than among women (31.5%; IC95% 28.9%-34,1%) (Table 2). his phe-nomenon occurred in all age groups except for the older adult group (50 to 59 years old), in which the prevalence was greater among women. In the other demographic variables, the preva-lence of the use of physical therapy increased with age (p<0.001). he greatest value was reported in the 50 to 59 year-old individu-als (47.2%; IC95% 42.4%-52.1%) and was twice the value of the 20-29 year old group (21.1%; IC95% 17.9%-24.4%). With regard to skin color/race, Asian descendants had the greatest prevalence of the use of physical therapy services (45.9%; IC95% 29.1%-62.8%), while indigenous individuals had the lowest (26.1%; IC95% 6.7%-45.6%); however, there was no statistically signiicant association between this variable and the use of physical therapy. Groups with better socioeconomic indicators also reported a more fre-quent use of physical therapy services (p<0.001), and this preva-lence reached 47.0% (IC95% 42.4%-51.5%) in the highest income group and 41.4% (IC95% 36,8%-45,9%) among those with 12 to 15 years of education.
he most common reasons for the use of physical therapy were back problems, comprising almost a third of the total sample (Table 3). Next came the external causes and knee problems. hese three reasons accounted for 57.1% of all rea-sons given. Among the people who referred to the use of physi-cal therapy services, there was a similar proportion of public health users (49.6%) in comparison with private health users (50.4%). Among the social levels, however, there was a sharp contrast. In the lowest income quartile, only 20% of the people used private physical therapy services; among high income us-ers, this proportion reached 54%.
Discussion
he importance of adopting epidemiology tools in physi-cal therapy practice has been highlighted in the literature. Identifying the population’s physical therapy use and needs and creating information subsystems to evaluate actions and strategies in this area should be emphasized for health inspec-tion and public policy planning11. Yet, the population-based
studies that investigate the use of physical therapy are still scarce. he only published study based on a Brazilian sample6
he proportion of people who had used physical therapy ser-vices in the 12 months prior to the research was also reported. In this case, the prevalence was 4.9%, a lower value compared to the Netherlands (23.7%)12 and to Curaçao (Dutch Antilles)
(8.8%)13. he present study did not collect data related to the
use of physical therapy in the past year, which prevents com-parison with the aforementioned international studies. In 2007, there were 91 physical therapists registered in the Regional Council of Physical herapy and Occupational herapy in the city of Lages. his represents a ratio of one professional for every 1,850 inhabitants. Furthermore, Lages is a regional refer-ence in health services, attracting a considerable part of the population from the neighboring cities who seek treatment, physical therapy included. here are also 14 physical therapy clinics, out of which only ive are accredited by SUS. hese factors may explain the low use of physical therapy services; however, this was not the main concern of the present study. New research must be carried out to verify this hypothesis.
he present study conirmed other indings in the litera-ture, according to which the highest prevalence of physical therapy use is found in the older and more privileged seg-ments of the population6. Regarding age, data from the 2003
National Research by Home Sample (PNAD) indicate a posi-tive gradient between the presence of chronic morbidities and higher age brackets14. Many chronic diseases require the
use of physical therapy for the maintenance and rehabilita-tion of the patients’ health. his fact may be modulating the uneven distribution of the use of this service among age groups. Another important factor is that the study focuses on the use of this service at any point in life. Having lived longer, older individuals are more likely to have had physical therapy treatment. As for the socioeconomic level, national and in-ternational studies point out that, proportionally, the more educated, high income individuals make use of health ser-vices on a more regular basis15-17. he same applies to physical
therapy. his is a worrying trend because the underprivileged have the highest rate of disease18,19.he combination of higher
morbidity and less use of health services, especially physical therapy, causes a great loss for this segment of society and calls for special attention on the part of health policy makers at federal and particularly municipal level.
Contrary to what has been observed in the health ser-vices in general16, the men in the present study had a higher
rate of physical therapy use. Nevertheless, in the older age group (50-59 years), this rate was higher among the women. A possible explanation for the greater prevalence among men is that young male adults have a high rate of injuries due to external causes (violence, traffic accidents, sports) which later require physical therapy. The greater preva-lence of chronic diseases among older women14 may have
*: chi-square test.
Table 2. Prevalence of the use of physical therapy services (CI 95%).
Lages, Santa Catarina, 2007.
Variables Prevalence CI 95% p-value*
Gender 0.023
Male 36.4 33.0-39.9
Female 31.5 28.9-34.1
Age (years) <0.001
20 to 29 21.1 17.9-24.4
30 to 39 30.6 26.3-34.9
40 to 49 39.1 34.9-43.3
50 to 59 47.2 42.4-52.1
Self-rated health <0.001
Good 30.5 28.1-32.9
Regular 39.6 35.1-44.1
Poor 50.0 38.8-61.2
Skin color/race 0.014
White 35.4 32.7-38.1
Lighter-skinned black 28.3 24.6-32.0
Dark-skinned black 35.8 27.2-44.4
Asian 45.9 29.1-62.8
Indigenous 26.1 6.7-45.6
Per capita income
(times the minimum wage) <0.001
1.59 to 19.80 47.0 42.4-51.5
0.88 to 1.58 32.6 28.5-36.7
0.51 to 0.87 31.5 27.4-35.6
0.02 to 0.50 23.7 19.9-27.5
Educational level (years) 0.001
12 to 15 41.4 36.8-45.9
9 to 11 32.6 28.9-36.4
5 to 8 29.4 25.6-33.1
0 to 4 32.3 27.3-37.2
Overall sample 33.2 31.0-35.3
Table 3. Reasons for the use of physical therapy. Lages, Santa
Catarina, 2007.
Reason n %
Back problems 240 32.4
External causes (accidents, sprains, fractures, trauma and
muscle injuries) 96 12.9
Knee problems 87 11.7
Upper limb problems 80 10.8
Lower limb problems 61 8.2
Tendonitis 42 5.7
Shoulder problems 25 3.4
Rheumatism (arthritis, osteoarthritis and fibromyalgia) 19 2.6
Neurological problems (paralysis, polyneuritis and stroke) 17 2.3
Postoperative recovery 14 1.9
Bursitis 11 1.5
Respiratory problems 9 1.2
Others 40 5.4
1. Monteiro CA. Velhos e novos males da saúde no Brasil. São Paulo: Hucitec; 1995.
2. Organização Pan-Americana da Saúde – OPAS/OMS. Indicadores básicos para a saúde no Brasil: conceitos e aplicações. Brasília; 2002.
3. Schramm JMA, Oliveira AF, Leite IC, Valente JC, Gadelha AMJ, Portela MC, et al. Transição epidemiológica e o estudo de carga de doença no Brasil. Cien Saude Colet. 2004;9(4):897-908.
4. Cerqueira MT. Promoción de la salud y educación para la salud: retos y perspectivas. In: Organización Mundial de la Salud. La promoción de la salud y la educación para la salud en América Latina: un análisis sectorial. Geneva: Universidad de Puerto Rico; 1997. p. 7-48.
5. Conselho Federal de Fisioterapia e Terapia Ocupacional. Definição de Fisioterapia. Disponível em: http://www.coffito.org.br/conteudo/con_view. asp?secao=27 (acessado em 15/Out/2007).
6. Siqueira FV, Facchini LA, Hallal PC. Epidemiologia da utilização de fisioterapia em adultos e idosos. Rev Saude Publica. 2005;39(4): 662-8.
7. Programa das Nações Unidas para o Desenvolvimento - PNUD. Atlas do desenvolvimento humano no Brasil. Brasília: Programa das Nações Unidas para o Desenvolvimento; 2003.
8. Ministério da Saúde - DATASUS. Sistema de Informações sobre Nascidos Vivos – Santa Catarina. Acesso em 20/09/2007. Disponível em: http:// tabnet.datasus.gov.br/cgi/deftohtm.exe?sinasc/cnv/nvsc.def.
9. Instituto Brasileiro de Geografia e Estatística. Acesso em 14/02/2008. Disponível em: http://www.ibge.gov.br/cidadesat/default.php.
10. Dean AG, Dean JA, Colombier D, Brendel KA, Smith DC, Burton AH et al. Epi Info, version 6: a word processing, database, and statistics program for
contributed to the change in the profile of physical therapy use in the 50-59 age group.
here was a greater prevalence in the use of physical ther-apy services among people who rated their health as “regular” or “poor” compared to those who rated it as “good”. his may be due to the association between the presence of chronic diseases and a poor assessment of their health conditions. People who sufer more from chronic diseases alsoseek health services more often20. Regarding the reasons for seeking
physi-cal therapy services, the greater proportion of back problems and external causes is similar to what has been reported in the national literature6. Currently, both types of injury are of great
epidemiological relevance in Brazil, with back problems as the most referred chronic disease in the PNAD-200314 and external
causes as one of the main reasons for morbidity, hospitaliza-tion, and mortality in the country21.
he various health occupations usually focus on the clinical treatment of the disease, even more so in physical therapy. he physical therapist is commonly referred to as the rehabilitation professional who only acts when the disease, injury or disorder is already established22. he reversal of this narrow-minded
concept is vital to popularize the use of the physical therapy, and it could improve the quality of life of the population, en-compassing not only rehabilitation but also health promotion and the prevention of diseases. As pointed out by Silva e da Ros25, it is essential that the professional training received by
the physical therapists prepare them for teamwork and to pro-vide total care.
epidemiology on microcomputers. Atlanta: Centers for Disease Control and Prevention; 1994.
11. Baquero G, Lopez O. El papel de la epidemiología en la identificación de necesidades relacionadas con la fisioterapia en Colombia. Salud Pública Méx. 2004;46(1):5-6.
12. Reijneveld SA, Stronks K. The validity of self-reported use of health care across socioeconomic strata: a comparison of survey and registration data. Int J Epidemiol 2001;30(6):1407-14.
13. Alberts JF, Sanderman R, Eimers JM, van den Heuvel WJ. Socioeconomic inequity in health care: a study of services utilization in Curaçao. Soc Sci Méd. 1997;45(2):213-20.
14. Barros MBA, César CLG, Carandina L, Torre GD. Desigualdades sociais na prevalência de doenças crônicas no Brasil, PNAD-2003. Cien Saúde Colet. 2006;11(4):911-26.
15. Schoen C, Doty MM. Inequities in access to medical care in five countries: findings from the 2001 Commonwealth Fund International Health Policy Survey. Health Policy. 2004;67(3):309-22.
16. Travassos C, Viacava F, Pinheiro R, Brito A. Utilização dos serviços de saúde no Brasil: gênero, características familiares e condição social. Rev Panam Salud Publica. 2002;11(5):365-73.
17. Gwatkin DR, Bhuiya A, Victora CG. Making health systems more equitable. Lancet. 2004;364(9441):1273-80.
18. Macintyre S. The Black Report and beyond: what are the issues? Soc Sci Med. 1997;44(6):723-45.
19. Goldberg M, Melchior M, Leclerc A, Lert F. Epidemiology and social determinants of health inequalities. Rev Epidemiol Sante Publique. 2003;51(4):381-401.
20. Almeida MF, Barata RB, Montero CV, Silva ZP. Prevalência de doenças crônicas auto-referidas e utilização de serviços de saúde, PNAD/1998, Brasil. Cien Saúde Colet. 2002;7(4):743-56.
21. Carmo EH, Barreto ML, da Silva Jr JB. Mudanças nos padrões de morbimortalidade da população brasileira: os desafios para um novo século. Epidemiol Serv Saúde. 2003;12(2):63-75.
22. Deliberato PCP. Fisioterapia Preventiva: Fundamentos e Aplicações. Barueri: Manole; 2002.