Risia Cristina Egito de MenezesI Pedro Israel Cabral de LiraII Vanessa Sá LealI
Juliana Souza OliveiraIII Sandra Cristina da Silva SantanaIV
Leopoldina Augusta de Souza SequeiraII
Anete RissinV
Malaquias Batista FilhoV
I Faculdade de Nutrição. Universidade Federal de Alagoas. Maceió, AL, Brasil II Departamento de Nutrição. Universidade
Federal de Pernambuco (UFPE). Recife, PE, Brasil
III Centro Acadêmico de Vitória. UFPE. Recife, PE, Brasil
IV Faculdade Maurício de Nassau. Recife, PE, Brasil
V Instituto de Medicina Integral Prof. Fernando Figueira. Recife, PE, Brasil Correspondence:
Risia Cristina Egito de Menezes Faculdade de Nutrição Universidade Federal de Alagoas Av. Lourival Melo Mota, s/n, Campus A. C. Simões Tabuleiro do Martins 57072-970 Maceió, AL, Brasil E-mail: [email protected] Received: 10/27/2010
Approved: 5/13/2011
Article available from: www.scielo.br/rsp
Determinants of stunting
in children under fi ve in
Pernambuco, Northeastern
Brazil
ABSTRACT
OBJECTIVE: To describe the prevalence of stunting in children under fi ve and identify factors associated.
METHODS: Population-based cross-sectional study conducted in 1991, 1997 and 2006 in the state of Pernambuco, northeastern Brazil. The following variables associated with the prevalence of stunting (height-for-age < –2 z-score) were studied: socioeconomic condition, maternal and child characteristics, and health care provided. A hierarchical model was used in the multiple logistic regression to assess the impact of explanatory variables on children’s stunting.
RESULTS: The prevalence of child malnutrition (height-for-age) was reduced
by 65% from 1991 to 2006. Socioeconomic variables (per capita family
income, maternal education, number of people living in the household and access to consumer goods), maternal height and birth weight were associated
with stunting in children under fi ve.
CONCLUSIONS: All the determinants studied improved over the study period
though not consistently. Despite signifi cant reduction of child malnutrition in
Pernambuco there remain differences regarding stunting, and children with better socioeconomic conditions have more favorable outcomes.
DESCRIPTORS: Infant. Child. Stature by Age. Malnutrition. Risk Factors. Socioeconomic Factors. Cross-Sectional Studies.
INTRODUCTION
Child malnutrition is one of the main nutritional status alterations in developing
countries, and it is also considered a public health problem.15 Studies have
shown the degree and distribution of this multifactorial problem in populations, as well as its association with factors related to maternal level of schooling, healthcare provided, sanitization of the environment, housing conditions,
family’s purchasing power,a among others.4,10,13
Economic, social and demographic transformations have considerably
modi-fi ed the nutritional profi le of the child population in the last decades, and the
World Health Organization (WHO) estimates that 7% of the children younger
than fi ve years are stunted.17 In Brazil, the frequencies
of weight-for-height and weight-for-age defi cits (1.4%
and 1.9%, respectively) point to the virtual control of the risk of child malnutrition, as they are in the expected
level for healthy and well-nourished populations.17,a
The decline in child malnutrition in Brazil has been
recently attributed to the signifi cant rise in families’
purchasing power, to the increase in maternal schooling, to greater access to maternal and child healthcare and
to the amplifi cation of essential public services, such
as water supply networks and garbage collection.13,a
In view of this and of the negative repercussions of malnutrition among children, this study aimed to
describe stunting in children under fi ve and identify
associated factors.
M E T H O D S
This population-based cross-sectional study used data
from Pesquisa Estadual de Saúde e Nutrição (PESN –
State Health and Nutrition Survey), carried out in the State of Pernambuco (Northeastern Brazil) in 1997 and 2006. The objective of the inquiries was the diagnosis of health, nutrition and eating habits of children under
fi ve, including demographic, socioeconomic and
envi-ronmental data, as well as data related to health services utilization and childcare.b,c,d
The sampling process was performed in three stages:
in the fi rst and second ones, the municipalities and the
census tracts within each municipality were drawn. In the third stage, an initial point within each tract was drawn, from which the households that constituted the pre-established sample quota were visited.
The random and stratifi ed probability sample was
constituted by children aged zero-59 months and
totaled 935 children in the fi rst phase of the research,
(1991), 2,040 in the second (1997) and 1,609 in the
third (2006). The fi eldwork was performed by teams
of interviewers and anthropometrists. Anthropometric evaluation was carried out after the researchers were trained according to the technical procedures
recom-mended by the WHO17 and the norms of the Manual de
Acompanhamento do Crescimento e Desenvolvimento do Ministério da Saúde (Growth and Development
Follow-up Manual of the Ministry of Health).e
Forms and questionnaires composed of pre-coded questions were used to collect data referring to
b Fundo das Nações Unidas para a Infância. Crianças e adolescentes em Pernambuco: saúde, educação e trabalho. I Pesquisa Estadual de Saúde e Nutrição. Brasília; 1992.
c Batista Filho M, Romani SAM, organizadores. Alimentação, Nutrição e Saúde no Estado de Pernambuco. Recife: Instituto Materno-Infantil de Pernambuco; 2002. (Série de Publicações Científi cas do Instituto Materno-Infantil de Pernambuco, 7).
d Secretaria de Saúde do Estado de Pernambuco. Universidade Federal de Pernambuco. III Pesquisa estadual de saúde e nutrição: saúde, nutrição, alimentação, condições socioeconômicas e atenção à saúde no estado de Pernambuco. Recife; 2010.
e Ministério da Saúde. Secretaria de Políticas de Saúde. Departamento de Atenção Básica. Saúde da Criança: acompanhamento do crescimento e desenvolvimento infantil. Brasília, 2002. (Série A. Normas e Manuais Técnicos - Série Cadernos de Atenção Básica, 11). f World Health Organization. Anthro for personal computers. Version 2. 2007: Software for assessing growth and development of the world’s children. Geneva; 2007[cited 2008 Jan 23]. Available from: http://www.who.int/childgrowth/software/en/
socioeconomic, demographic and biological informa-tion. The anthropometric information was registered
in a specifi c form. Weight and height measures were
classifi ed according to the WHO and all the children
with height less than two standard-deviations below the median expected for age and sex, expressed in Z-scores,
were considered as stunted.6
The software Anthro version 2f was used for the
evalu-ation of the defi cit nutritional status.
The independent variables were child’s age, household
situation, per capita family income, maternal schooling,
number of people residing in the household, ownership of goods, access to essential services, maternal height and body mass index (BMI), child’s birth weight and healthcare provided (adequate: with six prenatal consul-tations and hospital delivery; inadequate: access to only one or none of these services).
The data were processed and analyzed by means of a database with available variables in the two phases of the study. The software EpiInfo version 6.04 was used for the double data input.
Stunting for the years of 1991, 1997 and 2006 was analyzed according to household situation. The evolu-tion of the influence of stunting determinants was
obtained by comparing the percentages and their confi
-dence intervals (95%CI) for the periods of 1997 and 2006. The data from the 1991 survey were not analyzed in view of the limitation of the information of some variables, which hampered comparability with the other studied years. To compare the categorical variables, the chi-square test was used, or the chi-square test with Yates’ correction for the dichotomous variables, consid-ering p < 0.05 as statistical signifi cance. The programs EpiInfo version 6.04 and SPSS version 8.0 were utilized.
The determinant factors of malnutrition were analyzed with data from the 2006 PESN. Odds ratio (OR) of stunting were calculated to each exposure variable through logistic regression. The variables with p < 0.20 in the bivariate analysis were selected for initial inclusion in the regression analysis. Multiple logistic regression was performed with the adoption of a
process of hierarchical modeling per blocks18 using
the method enter, so that the fi rst block contained
the socioeconomic variables: maternal schooling and
following variables were introduced: household situa-tion, consumer goods, access to essential services and number of people residing in the household; in the third block, maternal height; and, fi nally, in the fourth block, the variable related to healthcare (prenatal assistance and delivery) and birth weight. To adjust the odds ratio, the variables of the fi rst hierarchical block were included in the regression model. The variables of this level that showed association with stunting (p < 0.05) were maintained in the model in the lower hierarchical levels. The same procedure was adopted to the other hierarchical levels.
The PESN editions were approved by the Ethics Committee of Research in Human Beings of the
Health Sciences Center of Universidade Federal de
Pernambuco and of Instituto Materno-Infantil de Pernambuco (II PESN: Directive no. 044/96-CCS, of December 17, 1996).
RESULTS
The prevalence of stunting among children in the State as a whole decreased from 24.6%, in 1991 to 8.7% in 2006, which represents a 64.6% reduction (Figure). The Metropolitan Region of Recife showed prevalences inferior to those of inland municipalities in the analyzed period, when these regions registered reductions of 73% e 65%, respectively.
In 1997 and 2006, the lowest prevalences of stunting were found among children from families with higher
per capita income (≥ 0.50 minimum salary); of
mothers with at least four years of schooling; from less numerous families; with access to the listed consumer goods and to better sanitation conditions, with statistical
signifi cance for both years (Table 1).
Stunting exhibited a signifi cant reduction trend for all
the strata of the variables studied in the two periods, with percentages that varied from 31% to 64%.
In 2006, the occurrence of stunting among low birth weight children of mothers with short stature was three times higher when compared to those born with more than 2,500 g of mothers whose height was above 1.50 m (Table 2). Children whose mothers had received better prenatal and delivery assistance presented lower prevalence of stunting.
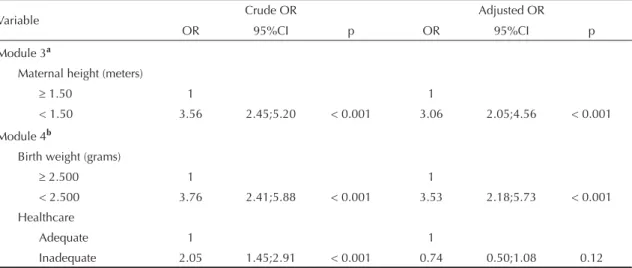
The results of the multiple logistic regression analysis and the adjusted effects of the explanatory variables in relation to the height-for-age index can be found in Tables 3 and 4. The adjusted OR shows that the
socioeconomic variables (per capita family income,
maternal schooling, number of people in the household and access to consumer goods), maternal height and birth weight remained among the factors associated with stunting in children.
DISCUSSION
The prevalence of child malnutrition according to the height-for-age index decreased by 65% in the State of Pernambuco between 1991 and 2006. This result is
similar to the one found by Monteiro et al12 (2009), who
studied the prevalence of malnutrition in the Brazilian
population of children under fi ve between 1996 and
2006 and indicated a 50% decline.
Despite the similarity in relation to the temporal variation trend, the prevalence estimated to the State as a whole (8.7%) in 2006 was higher than the ones
verifi ed to the Northeast (5.7%) and to Brazil (7.0%)
by Pesquisa Nacional de Demografia e Saúde da Criança e da Mulher (PNDS – National Survey of Children’s and Women’s Demography and Health) in
this same year.a The interior of the State (10.1%) and
more specifi cally the rural zone (11.4%) presented even
higher prevalences.
The higher prevalence of malnutrition in the interior of the State delimits spatial differences that agree with the trends found in the 2006 PNDS for the North Region of Brazil (14.8%). These results express socioeconomic
inequalities and diffi culty to access primary healthcare
services and basic social work services, and make these regions be priority areas for efforts to control child malnutrition in Brazil.a
According to the results of the present study, stunting is statistically associated with socioeconomic condi-tions. Children of mothers with less than four years of schooling have odds two times higher of being
stunted, which was also observed in the 2006 PNDS.a
Figure. Prevalence of stunting in children under fi ve,
accor-ding to the household’s geographic situation. Pernambuco, Northeastern Brazil, 1991-2006.
24.6
16.2
8.7
State 0
5 10 15 20 25 30 35 %
MRR Interior 17.0
12.8
4.6
28.8
18.1
10.1
1991 1997 2006
In the evaluated period, the socioeconomic condi-tions improved, mainly regarding maternal schooling: mothers with less than four years of education decreased from 24.2% (1997) to 10.7% (2006) in the State as a whole. However, lower maternal schooling continues to be associated with higher malnutrition indexes, with two times higher odds of occurrence in comparison to those with higher level of schooling, a
fact that was also observed in the 2006 PNDS.a
Maternal schooling has been pointed out as a factor associated with child growtha in the scientifi c
litera-ture.7,10,12 The way in which the mother dedicates
attention to her children, both directly and through caregivers, as well as her access to healthcare services are infl uenced by the level of schooling.11
Table 1. Prevalence of stunting in children under fi ve, according to the household’s geographic situation and socioeconomic
characteristics. Pernambuco, Northeastern Brazil, 1997-2006.
Variable
Stunting/Age (< -2 EZ) Variation 1997/2006 PESN-1997 (n = 2,040) PESN-2006 (n = 1,609)
n % 95%CI n % 95%CI %
Household situation*
Metropolitan Region 91 12.8 10.5;15.4 19 4.6 2.8;6.9 -64.1*
Urban interior 99 14.5 12.0;17.3 32 7.8 5.5;10.7 -46.2* *
Rural interior 141 21.9 18.8;25.2 89 11.4 9.3;13.7 -47.0*
Per capita family income* (minimum salaries)
0.50 55 6.9 5.3;8.8 9 3.3 1.6;6.0 -52.2* * *
0.25 – 0.49 107 18.5 15.5;21.8 32 6.6 4.7;9.1 -63.3*
< 0.25 169 25.6 22.4;29.0 98 11.8 9.8;14.2 -53.9*
Maternal schooling*
4 years of schooling 122 10.4 8.7;12.2 21 4.2 2.7;6.2 -59.6*
< 4 years of schooling 209 24.2 21.4;27.2 119 10.7 9.0;12.7 -55.8*
People/household
1-5 129 11.7 9.9;13.7 65 6.3 4.9;7.9 -46.0*
6 and more 202 21.5 19.0;24.2 75 13.0 10.4;15.9 -39.5*
Consumer goods (television, refrigerator, stove and radio)*
Has all 94 9.2 7.5;11.1 52 6.2 4.7;8.0 -32.6* * *
Has three of them 103 20.6 17.3;24.4 32 8.1 5.7;11.1 -60.2*
Has two of them 67 21.8 17.5;26.7 30 13.9 9.7;19.0 -36.2* * *
Has one or none 67 31.6 25.6;38.1 26 16.5 11.3;22.9 -47.8*
Sanitation*
General water network, sewage and garbage collection 32 7.0 4.9;9.6 23 4.8 3.1;7.0 -31.4
Two of the conditions above 69 13.6 10.8;16.8 51 8.3 6.3;10.7 -40.0* *
One/none of the conditions above 230 21.4 19.0;23.9 66 12.8 10.2;15.9 -40.2*
PESN: Pesquisa Estadual de Saúde e Nutrição (State Health and Nutrition Survey)
Level of signifi cance: * p < 0.001; * *p < 0.01; * * * p < 0.05 (differences between variables and between years for the same stratifi cation).
Studies also show the infl uence of family income on
children’s nutritional status.4,10,12,a In relation to the
per capita family income, the difference in stunting prevalence between the extremes of the purchasing power classes is of approximately three times, with concentration of infant growth retardation in the less favored strata. Despite the economic development and the advances in the Brazilian population’s quality of life that were observed in the last decades, there was
no adequate or better income distribution.g,h,i
Traditionally, populations that live in the interior of the State, especially in rural areas, have been more
susceptible to nutritional defi cits, mainly children. In
the last decades, with the fast reduction in malnutrition, although still with disadvantages to the rural areas,
g Cavenaghi S. Perfi l dos domicílios e das famílias. In: Ministério da Saúde. Pesquisa Nacional de Demografi a e Saúde da criança e da mulher: PNDS 2006: Dimensões do processo reprodutivo e da saúde da criança. Brasília; 2009. p.33-53.
h Instituto Brasileiro de Geografi a e Estatística. Pesquisa de Orçamentos Familiares 2008-2009. Antropometria e Estado Nutricional de Crianças, Adolescentes e Adultos no Brasil. Rio de Janeiro; 2010.
the differences in prevalences have not presented
statistical signifi cance when they interact with other
determinants.i In the present study, although the highest
OR for stunting correspond to the rural area, the
same was not confi rmed in the multiple analysis after
adjustment by the other factors. In the 2006 PNDS, the difference in the prevalences of stunting-for-age was
of 0.7 percentage point (urban = 6.9%; rural = 7.6%).a
In relation to family composition, important demo-graphic changes have occurred in the last years, mainly
in the number of people in the households.1 The
contin-uous decline in fertility, even after it reached low levels, is, to a large extent, responsible for the reduction in the number of components in the Brazilian households, in such a way that family density decreased from the mean
of 4.1 to 3.1 people.g This scenario of demographic
changes, with less numerous families, will result in children’s improved health condition, accompanying the improvement in the Brazilian population’s quality
of life that has been observed in the last decades.1,g
In the present study, stunting in the group of children belonging to the most numerous families was approxi-mately two times higher when compared to that of households with fewer dwellers, a result that was also
observed in the 1997 PESN.14 These results are
corrobo-rated by other studies.1,5
The results of the present study refl ect an advance in
the ownership of durable consumer goods, a fact that has also been observed in the Brazilian population.7,h In
spite of this progress, it is still possible to visualize an inverse relationship between ownership of goods and child malnutrition: the frequency of malnourished chil-dren increases as the number of goods that the family owns decreases, with odds of malnutrition higher than 1.5 times among economically vulnerable children.
The basic infrastructure that is available to the house-holds is an important indicator of socioeconomic condi-tions, and it behaves as a marker of the sanitary and health conditions of the population.1,3,14 The percentage
of households with access to the services of water supply, sewage and garbage collection has increased signifi cantly; however, it is still restricted to a small part of the population. This indicator has not improved in the same rhythm of that of durable consumer goods.
These data indicate that the policies in the scope of public health will not be effective in disease prevention if there are no intersectoral actions with this purpose. Access,
Table 2. Prevalence of stunting in children under fi ve, according to personal, maternal and healthcare characteristics. Pernambuco,
Northeastern Brazil, 1997-2006.
Variable
Stunting/Age (< -2 EZ) Variation
1997/2006 PESN-1997 (n = 2,040) PESN-2006 (n = 1,609)
n % 95%CI n % 95%CI %
Maternal height (meters)*
1.50 217 13.1 11.5;14.8 90 6.7 5.5;8.2 -48.9*
< 1.50 109 32.7 27.8;37.9 48 20.6 15.8;26.2 -37.0* *
Maternal BMI (kg/m2)
18.5 305 16.3 14.7;18.1 128 8.6 7.3;10.1 -47.2*
< 18.5 21 16.7 10.9;23.9 10 12.5 6.3;21.2 -25.2
Birth weight (grams)*
2,500 224 13.0 11.4;14.6 109 7.4 6.2;8.8 -43.1*
< 2.500 51 34.2 26.9;42.1 31 23.1 16.6;30.8 -32.5* * *
Sex
Male 179 17.7 15.4;20.1 85 10.3 8.4;12.5 -41.8*
Female 152 14.8 12.7;17.1 55 7.0 5.4;9.0 -52.7*
Age (months)
< 24 140 16.3 14.0;18.9 55 8.4 6.4;10.7 -48.5*
24 191 16.2 14.1;18.3 85 8.9 7.2;10.8 -45.1*
Healthcare*
Adequate 95 10.5 8.7;12.7 62 6.4 5.0;8.0 -39.1* *
Inadequate 236 20.7 18.4;23.2 78 12.3 9.9;15.0 -40.6*
PESN: Pesquisa Estadual de Saúde e Nutrição (State Health and Nutrition Survey) BMI: Body Mass Index
total or partial, to basic infrastructure is one of the factors that has been traditionally associated with improvements in the malnutrition indexes.15 Sociocultural factors, such
as poverty and social deprivation, as well as mothers’ biological and nutritional factors, can also be important
determinants of malnutrition.6,8,9 This is what data in
relation to mothers’ height suggest: in the present study, maternal stunting was associated with three times higher odds of stunting in their children.
The pregnant woman’s poor nutritional condition at birth constitutes a signifi cant risk factor for subsequent
infant growth retardation, mainly in the fi rst years of
life.5 In fact, in the present study, low birth weight
represented three times higher odds of malnutrition in children under fi ve.
It is known that low birth weight can express a popula-tion’s standard of life, and its most severe consequences happen during fetal development and in the fi rst years of life, with serious implications for the future nutritional
status. It may even become one of the main compo-nents of child mortality.5 Thus, the fi ndings point to the
need of establishing strategies that enable to prevent low birth weight, which is operationally translated as adequate prenatal care, appropriate assistance to child-birth and child’s health.
Healthcare showed a signifi cant statistical relationship
in the bivariate analysis, but it was not maintained in the multiple logistic regression analysis. Therefore, healthcare is not an independent associated factor in this population, unlike birth weight, which was maintained in the succession of explanatory models of stunting. Thus, results grounded in inductive indicators should be analyzed with caution.
The present study was founded on population-based state inquiries, which grants it internal validity and enables a better healthcare planning in the State. Besides, the results presented here may serve as reference to studies in areas whose socioeconomic
Table 3. Multiple logistic regression for stunting in children under fi ve (<-2 Z score), according to socioeconomic, maternal,
child’s and healthcare variables. Pernambuco, Northeastern Brazil, 2006.
Variable Crude OR Adjusted OR
OR 95%CI p OR 95%CI p
Module 1
Per capita family income(minimum salaries)
0.50 1 1
0.25 – 0.49 2.05 0.96;4.37 0.06 1.74 0.77;3.91 0.18
< 0.25 3.88 1.93;7.79 <0.001 2.93 1.35;6.35 0.007
Maternal schooling
4 years of schooling 1 1
< 4 years of schooling 2.76 1.71;4.44 <0.001 2.01 1.19;3.37 0.009
Module 2a
Household situation
Metropolitan region 1 1
Urban interior 1.77 0.99;3.18 0.05 1.21 0.61;2.37 0.59
Rural interior 2.68 1.61;4.46 <0.001 1.67 0.90;3.09 0.11
Number of people in the household
1-5 1 1
6 and more 2.22 1.56;3.4 <0.001 1.92 1.33;2.77 0.001
Consumer goods
Has 3 or 4 items 1 1
Has 2 items 2.21 1.42;3.45 <0.001 1.66 1.02;2.72 0.06
Has one item or none 2.70 1.68;4.34 <0.001 1.69 0.98;2.89 0.04
Sanitation
General water network, general sewage network and
garbage collection 1 1
Two of the conditions above 1.82 1.09;3.02 0.21 1.43 0.79;2.61 0.24
and cultural characteristics are similar to those of Pernambuco, like other states of the Northeastern region of Brazil. Despite the reduced prevalence of
malnutri-tion, the sample size was suffi cient to the performance
of the multiple logistic statistical analysis, with the utilization of a hierarchical determination model.
Sample losses inferior to 3% during data collection can be considered a limitation. In addition, it is not possible to generalize the results, because it is fundamental to consider the differences and specifi cities of the studied
population to make a more specifi c criticism,
under-standing, in each context, the behavior of the variables,
how they articulate with each other and how they result in varied outcomes, in view of the fact that there is no single and universal model destined to the explanation
of the diverse circumstances of reality.2
In conclusion, there is a clear difference in stunting that
is refl ected on practically all the analyzed indicators,
always in favor of children in better socioeconomic condition.
Temporal trend studies like the present one have a strategic importance to guide universal policies of employment and income (social inclusion), as well as primary healthcare.
Table 4. Multiple logistic regression for stunting in children under fi ve(< -2 Z score), according to maternal, child’s and healthcare
variables. Pernambuco, Northeastern Brazil, 2006.
Variable Crude OR Adjusted OR
OR 95%CI p OR 95%CI p
Module 3a
Maternal height (meters)
1.50 1 1
< 1.50 3.56 2.45;5.20 < 0.001 3.06 2.05;4.56 < 0.001
Module 4b
Birth weight (grams)
2.500 1 1
< 2.500 3.76 2.41;5.88 < 0.001 3.53 2.18;5.73 < 0.001
Healthcare
Adequate 1 1
Inadequate 2.05 1.45;2.91 < 0.001 0.74 0.50;1.08 0.12
a Module 3 adjusted by socioeconomic and environmental variables.
1. Alves JED, Cavenaghi S. Questões conceituais e metodológicas relativas a domicílio, família e condições habitacionais. Pap Poblac. 2005;(43):105-31.
2. Batista Filho M, Rissin A. A transição nutricional no Brasil: tendências regionais e temporais. Cad Saude Publica. 2003;19(1):181-91. DOI:10.1590/S0102-311X2003000700019
3. Barcellos C, Coutinho K, Pina MF, Magalhães MMAF, Paola JCMD, Santos SM. Inter-relacionamento de dados ambientais e de saúde: análise de risco à saúde aplicada ao abastecimento de água no Rio de Janeiro utilizando Sistemas de Informações Geográfi cas. Cad Saude Publica. 1998;14(3):597-605. DOI:10.1590/ S0102-311X1998000300016
4. Barros FC, Victora CG, Scherpbier R, Gwatkin D. Iniquidades sociais na saúde e nutrição de crianças em países de renda baixa e média. Rev Saude Publica. 2010; 44(1):1-16. DOI:10.1590/S0034-89102010000100001
5. Barroso GS, Sichieri R, Salles-Costa R. Fatores associados ao défi cit nutricional em crianças residentes em uma área de prevalência elevada de insegurança alimentar. Rev Bras Epidemiol.
2008;11(3):484-94. DOI:10.1590/S1415-790X2008000300015
6. Black RE, Allen LH, Bhutta ZA, Caulfi eld LE, Onis M, Ezzati M, et al. Maternal and child under nutrition: global and regional exposures and health consequences. Lancet. 2008; 371(9608):243-60. DOI:10.1016/S0140-6736(07)61690-0
7. Bobak M, Bohumir K, Leon DA, Danová J, Marmot M. Socioeconomic factors on height of preschool children in the Czech Republic. Am J Publ Health.
1994;84(7):1167-70. DOI:10.2105/AJPH.84.7.1167
8. Drachler ML, Andersson MCS, Leite JCC, Marshall T, Aerts DRGC, Freitas PF, et al. Desigualdade social e outros determinantes da altura em crianças: uma análise multinível. Cad Saude Publica. 2003;19(6):1815-25. DOI:10.1590/S0102-311X2003000600025
9. James WPT, Ferro-Luzzi A, Waterlow JC. Defi nition of chronic energy defi ciency in adults. Report of a working party of the International Dietary Energy Consultative Group. Eur J Clin Nutr. 1988;42(12):969-81.
10. Lima ALL, Silva ACF, Konno SC, Conde WL, Benicio MHD’A, Monteiro CA. Causas do declínio acelerado da desnutrição infantil no Nordeste do Brasil (1986-1996-2006). Rev Saude Publica. 2010;44(1):17-27. DOI:10.1590/S0034-89102010000100002
11. Monteiro CA, Freitas ICM. Evolução de condicionantes socioeconômicos da saúde na infância na cidade de São Paulo (1984-1996). Rev Saude Publica.
2000;34(6Suppl):S8-12. DOI:10.1590/S0034-89102000000700004
12. Monteiro CA, Benicio MHD, Konno SC, Silva ACF, Lima ALL, Conde WL. Causas do declínio da desnutrição infantil no Brasil, 1996-2007. Rev Saude Publica. 2009;43(1):35-43. DOI:10.1590/S0034-89102009000100005
13. Onis M, Blössner M, Borghi E, Frongillo EA, Morris R. Estimates of global of childhood underweight in 1990 and 2015. JAMA. 2009;291(21) 2600-6. DOI:10.1001/ jama.291.21.2600
14. Rissin A, Batista Filho M, Benício MHD’A, Figueiroa. Condições de moradia como preditores de riscos nutricionais em crianças de Pernambuco, Brasil. Rev Bras Saude Matern Inf. 2006;6(1):59-67. DOI:10.1590/ S1519-38292006000100007
15. Valente FLS. Fome e desnutrição: determinantes sociais. São Paulo: Editora Cortez; 1988.
16. Victora CG, Huttly SR, Fuchs SC, Olinto MTA. The role conceptual frameworks in epidemiological analysis: a hierarquical approach. Int J Epdemiol. 1997;26(1):224-7. DOI:10.1093/ije/26.1.224.
17. World Health Organization. Physical Status; The use and interpretation of anthropometry. Geneva; 1995. (Technical Report Series, 854).
18. World Health Organization. Multicentre Growth Reference Study Group. Who child growth standards based on length/height, weight and age. Acta Paediatr Suppl. 2006; (450):76-85.
REFERENCES
Paper based on the doctoral dissertation by Menezes RCE, submitted to Universidade Federal de Pernambuco in 2011. The Pesquisa Estadual de Saúde e Nutrição (State Health and Nutrition Survey) was fi nanced by the United Nations Children’s Fund/Ministry of Health, Instituto Nacional de Alimentação e Nutrição (National Institute of Food and Nutrition)/ Ministry of Health and Conselho Nacional de Desenvolvimento Científi co e Tecnológico (National Council for Scientifi c and Technological Development).