0021-7557/$ - see front matter © 2013 Sociedade Brasileira de Pediatria. Published by Elsevier Editora Ltda. All rights reserved. http://dx.doi.org/10.1016/j.jped.2013.03.003
www.jped.com.br
☆Please, cite this article as: Schuch I, de Castro TG, de Vasconcelos FA, Dutra CL, Goldani MZ. Excess weight in preschoolers: prevalen-ce and associated factors. J Pediatr (Rio J). 2013;89:179−88.
*Corresponding author.
E-mail: ischuch@uol.com.br (I. Schuch).
ORIGINAL ARTICLE
Excess weight in preschoolers: prevalence and associated factors
☆Ilaine Schuch
a,*, Teresa G. de Castro
b, Francisco de A.G. de Vasconcelos
c,
Carmem L.C. Dutra
d, Marcelo Z. Goldani
eaPhD, Departamento de Medicina Social, Faculdade de Medicina, Universidade Federal do Rio Grande do Sul (UFRGS),
Porto Alegre, RS, Brazil
bPhD, Departamento de Enfermagem Materno-Infantil e Saúde Pública, Escola de Enfermagem, Universidade Federal de
Minas Gerais (UFMG), Belo Horizonte, MG, Brazil
cPhD, Departamento de Nutrição, Centro de Ciências da Saúde, Universidade Federal de Santa Catarina (UFSC),
Florianópolis, SC, Brazil
dMSc, Instituto de Nutrição Josué de Castro, Universidade Federal do Rio de Janeiro (UFRJ), Rio de Janeiro, RJ, Brazil
ePhD, Departamento de Pediatria, Faculdade de Medicina, UFRGS, Porto Alegre, RS, Brazil
Received 7 May 2012; accepted 19 September 2012
KEYWORDS
Excess weight; Children;
Nutritional status; Risk factors
Abstract
Objective: To study the prevalence and factors associated with excess weight in children enrolled in public schools in the states of Rio Grande do Sul (RS) and Santa Catarina (SC).
Methods: This was a cross-sectional study, carried out with children aged 4 to 6 years. The studied outcome was excess weight, defined by z-score > two standard deviations for body mass index (BMI)/age, compared with the World Health Organization (WHO) reference population of 2006/2007. Anthropometric measurements of body mass and height were measured in duplicate using standard techniques, in accordance with the WHO. Data were double entered using EPI-INFO software, release 6.04. Absolute and relative frequencies were calculated, as well as mean values and standard deviations. Associations between excess weight and other variables were assessed by using Poisson model with robust variance. STATA software release 12.0 was used (p < 0.05).
PALAVRAS-CHAVE
Excesso de peso; Crianças;
Estado nutricional; Fatores de risco
Excesso de peso em crianças de pré-escolas: prevalência e fatores associados
Resumo
Objetivo: Estudar a prevalência e os fatores associados ao excesso de peso em crianças matriculadas em escolas públicas dos estados do Rio Grande do Sul (RS) e Santa Catarina (SC).
Métodos: Realizou-se estudo transversal com crianças de idade entre quatro e seis anos. O desfecho estudado foi o excesso de peso, definido através do escore Z > 2DP para o Índice de Massa Corporal (IMC)/idade, em comparação com a população de referência da OMS 2006/2007. As medidas antropométricas de massa corporal e altura foram aferidas em duplicata, utilizando-se técnicas padronizadas conforme a Organização Mundial de Saúde (OMS). Os dados foram duplamente digitados utilizando o software EPI-INFO, ver-são 6.04. Foram calculadas frequências absolutas e relativas e médias (DP). Associações entre excesso de peso e demais variáveis foram avaliadas em modelo de Poisson de variância robusta. Foi utilizado o programa STATA versão 12.0 (p < 0,05).
Resultados: Foram avaliadas 4.914 crianças (RS 2.578 e SC 2.336). No RS,o excesso de peso foi de 14,4% (IC 95% = 13,1-15,8%) e, em SC, de 7,5% (IC 95% = 6,5-8,7%). As vari -áveis que apresentaram associação com o excesso de peso foram: número de moradores no domicílio; escolaridade materna; situação conjugal; número de filhos; idade materna ao nascimento do primeiro filho; idade gestacional; e o peso ao nascer.
Conclusão: As crianças matriculadas nas pré-escolas públicas do RS apresentaram uma prevalência de excesso de peso duas vezes maior do que a identificada em SC, demons-trando uma diferença significativa na magnitude da obesidade infantil em dois estados brasileiros situados em uma mesma região.
© 2013 Sociedade Brasileira de Pediatria. Publicado por Elsevier Editora Ltda. Todos os direitos reservados.
Introduction
The increasing prevalence of obesity has represented a significant change in the profile of health and disease worldwide in recent years.1-3 In preschool ages, the
early occurrence of body adiposity and fast weight gain represents a risk factor for the development of obesity in later life.4
The 2006 National Survey on Demographics and Health (Pesquisa Nacional sobre Demografia e Saúde – PNDS) evaluated children under 5 years of age and demonstrated a national prevalence of overweight of 6.6%, and of 8.8% in the South.5 The results of the 2008-2009 Household
Budget Survey (Pesquisa de Orçamento Familiar – POF) pointed to an increase in the prevalence of overweight in Brazil that reached 33.5% of children aged between 5 and 9 years, ranging from 32% to 40% in the Southeast, South, and Midwest, and from 25% to 30% in the North and Northeast.6
Among the main determinants of childhood obesity that have been studied are high birth weight; maternal obesity during pregnancy, especially in the first trimester; parental obesity; low socioeconomic status; and low maternal education.7-10 In the study on the prevalence of obesity
among preschool children in five cities of the state of São
Paulo,11 obesity increased with the increasing per capita
income. In São Leopoldo, RS, Vitolo et al.,12 found a positive
association between excess weight in children younger than 5 years of age and high socioeconomic status in the area of the health facility.
Moreover, important population-based studies on the prevalence of obesity measured in two cohorts of live births in Pelotas in 1982 and 199313 recorded an increase in this
prevalence of approximately 40% over almost a decade; obesity also increased with the family income level. In this same population, nutritional deficits (weight/age and length/age) were higher in children from families with lower incomes (10%) and lower in those from families of higher income categories (3%).
This article describes the main results of a study aimed to determine the prevalence of excess weight and associated factors in preschool children enrolled in public schools in the states of Rio Grande do Sul (RS) and Santa Catarina (SC), Southern Brazil.
Methods
This was a school-based cross-sectional study with data obtained from schools located in RS and SC. The study Conclusion: Children enrolled in public preschools in RS had a two-fold higher excess weight prevalence than that identified in SC, demonstrating a significant difference in the magnitude of childhood obesity in two Brazilian states located in the same region. © 2013 Sociedade Brasileira de Pediatria. Published by Elsevier Editora Ltda.
population consisted of children aged between 4 and 6 years old, enrolled in 2007.
Public school records from the Brazilian Ministry of Education (MEC) were used to calculate sample size. Only schools that had 39 or more students enrolled in preschool were considered. Sampling was conducted by conglomerates, which were defined according to the mesoregions established by the Brazilian Institute of Geography and Statistics (Instituto Brasileiro de Geografia e Estatística - IBGE).
Data analysis was performed using the Statistical Package for Social Sciences (SPSS) 13.0 software, using the Complex Samples module, according to the complex sampling plan that was used. Each child was assigned a sample weight according to the school and municipality to whom he/ she belonged, within each state. To calculate the weight assigned to each child, sampling fractions were defined (inclusion probabilities) of f1 and f2, where f1 is the sampling fraction of the municipality within the stratum and f2 is the sampling fraction of the school within the municipality. The final inclusion probability of each child was: f = f1 * f2. The final weight assigned to each child was w = 1 / f, equal for children from the same school.
The working team consisted of 21 dietitians, and data collection occurred between September and December of 2007. Anthropometric measurements were measured in duplicate using standard techniques according to the World Health Organization (WHO).14 Body mass (in kg) was
obtained using a portable digital scale with a capacity of 200 kg and precision of 50 g. Height (cm) was measured using a portable stadiometer with an accuracy of 1 mm. Excess weight was considered in children with z-score values > + two standard deviations for body mass index for age (BMI/A) compared with the WHO reference population.15,16
Descriptive analysis of data was performed by calculating absolute and relative frequencies, and means and standard deviations. Comparisons between frequencies and means were carried out, respectively, using the chi-squared test and Student’s t-test for independent samples; values were considered signiicant when p < 0.05.
The variables studied were: 1. related to the child: gender, age, ethnicity, birth weight, gestational age, total time of breastfeeding, state of residence; 2. related to the child’s mother: educational level, number of children, maternal age at birth of first child, maternal age at child’s birth, marital status, 3. related to the child’s family and school: number of people in the household, number of rooms used for sleeping, location of residence, type of school, and school period (morning/ afternoon/full-time).
Factors associated with excess weight were irst analyzed from crude prevalence ratios and their respective 95% conidence intervals (95% CI); associations with p-values < 0.25 (chi-squared test for heterogeneity and linear trend) were selected. Then, the selected independent variables were studied by multiple analysis with Poisson regression with robust variance. Statistical analysis was performed using STATA software, release 12.0.
The study protocol was approved by the Research Ethics Committee of the Universidade Federal do Rio Grande do Sul (CEP/UFRGS) under protocol No. 2007736.
Results
A total of 4,914 children (2,578 from RS and 2,336 from SC) from 14 municipalities (eight in RS and six in SC) were evaluated. Among the general characteristics, it was observed that most children lived in urban areas, studied in public schools in the afternoon, and more than half were born to mothers with educational level equivalent to elementary school education (Table 1). There were significant differences in the two states regarding the number of rooms used for sleeping and the mother’s marital status. In RS there were more households with fewer rooms used for sleeping, and a higher proportion of mothers that did not live with a husband or partner.
The general prevalence of excess weight was 14.4% (95% CI = 13.1-15.8) and 7.5% (95% CI = 6.5-8.7), respectively, for the states of RS and SC. Variables that were associated with a higher prevalence of excess weight in the total population were: the number of household members, maternal education, number of children, maternal age at birth of the first child, birth weight, and gestational age. Children from families with the highest number of household members had the lowest rates of excess weight. Regarding the maternal education variable, children of mothers with higher levels of education had the lowest prevalence of overweight. As for maternal age, those born to teenage mothers had the lowest rates of excess weight. The variable birth weight was associated with the prevalence of excess weight; the lowest rates were found among those born with low birth weight, and the highest were found among those born weighing more than 4,000 g. Preterm children had lower rates of excess weight, compared to the rates of those born at term (Table 2).
In the analysis by state, the prevalence of overweight was associated, in both states, to the variables number of residents in the household, maternal age at birth of the first child, number of children, birth weight, and gestational age. Only in RS was the prevalence associated with maternal education, mother’s marital status, and school period.
Those who attended school full-time had lower proportion of excess weight; children of mothers with high school education had the highest rates of excess weight compared to children of mothers with elementary school or college/ university education. When the husband or partner of the child’s mother lived with the family, the prevalence of excess weight was higher.
Table 1 General characteristics of the total population and according to the state in relation with the study variables. Rio Grande do Sul and Santa Catarina, Brazil, 2007.
Variables Total (RS and SC) RS SC p
n % n % n %
Type of school 4,914 2,578 2,336
Municipal 3,440 70 1,824 78.8 1,620 67.4 0.185
State 1,470 30 754 21.2 716 32.6
School period 4,914 2,578 2,336
Morning 1,624 33 802 32.4 822 34.1 0.818
Afternoon 2,438 49.6 1,282 48.4 1,156 49.4
Full-time 852 17.4 494 19.2 358 16.5
Number of household members 4,851 2,551 2,300
≤ 3 1,428 29.4 777 31.4 651 28.5 0.328
4-5 2,657 54.8 1,356 53.3 1,301 56.8
≥ 6 766 15.8 418 15.4 348 14.7
Number of rooms used for sleeping 4,837 2,548 2,289
≤ 2 2,928 60.5 1,655 64.6 1,273 55.5 0.001
3-4 1,716 35.5 798 31.9 918 40.3
≥ 5 193 4.0 95 3.5 98 4.2
Household location 4,681 2,482 2,199
Urban 4,522 96.6 2,425 97.3 2,097 95.1 0,277
Rural 159 3.4 57 2.7 102 4.9
Maternal education 4,697 2,480 2,217
Elementary school 2,522 53.4 1,277 51.5 1,245 55.8 0.399
High school 1,740 37.0 968 39.7 772 35.2
College/university 435 9.3 235 8.7 200 9
Husband/partner 4,757 2,504 2,253
Yes 3,813 80.1 1,939 79.1 1,874 83.4 0,019
No 944 19.9 565 20.9 379 16.6
Number of children 4,821 2,544 2,277
1 1,302 27.0 715 29.5 587 26 0.460
2 1,726 35.8 888 35.5 838 36.9
3-4 1,396 29.0 721 27.4 675 29.3
≥ 5 397 8.2 220 7.6 177 7.8
Mother’s age at birth of first child 4,067 2,145 1,922
≤ 19 years 1,899 46.7 971 44.7 928 47.6 0.162
20-29 years 1,927 47.4 1,023 48 904 47.6
≥ 30 years 241 5.9 151 7.3 90 4.8
Mother’s age at birth of the child 4,698 2,478 2,220
≤ 19 years 929 19.8 468 19.2 461 20.4 0.509
20-29 years 2,362 50.3 1,236 49.8 1,126 50.7
≥ 30 years 1,407 29.9 774 31 633 28.9
Gender 4,914 2,578 2,336
Male 2,475 50.4 1,268 48,9 1,207 51,4 0,073
Female 2,439 49.6 1,310 51.1 1,129 48.6
Ethnicity 4,883 2,559 2,324
White 3,586 73.4 1,897 77.6 1,689 73 0.235
Non-white 1,297 26.6 662 22.4 635 27
Age (years) 4,914 2,578 2,336
4 -4.99 770 15.7 382 15.7 388 16.4 0.485
5- 5.99 1,881 38.3 1,000 41.7 881 37.3
6-6.99 2,263 46.0 1,196 42.7 1,067 46.3
Breastfeeding duration (months) 4,278 2,255 2,023
≤ 1 248 5.8 134 6.4 114 5.6 0.063
1.01-2 358 8.4 207 9.8 151 7.3
2.01-4 734 17.2 389 18.4 345 16.8
4.01-6 643 15.0 349 15.3 294 14.8
6.01-12 810 18.9 395 16.7 415 20.7
Table 1 (Continuation) General characteristics of the total population and according to the state in relation with the study variables. Rio Grande do Sul and Santa Catarina, Brazil, 2007.
Variables Total (RS and SC) RS SC p
n % n % n %
> 12 1,485 34.7 781 33.4 704 34.7
Birth weight (g) 4,772 2,523 2,249
< 2,500 495 10.4 251 10.5 244 10.9 0.817
2,500-4,000 4,028 84.4 2,129 84.2 1,899 84.2
> 4,000 249 5.2 143 5.3 106 4.9
Premature 3,758 2,041 1,717
No 2,400 63.9 2,578 62.1 1,083 64.4 0.263
Yes 1,358 36.1 1,268 37.9 634 35.6
RS, Rio Grande do Sul; SC, Santa Catarina.
Table 2 Prevalence (%) of excess weight in the total population and by state according to variable categories. Rio Grande do Sul and Santa Catarina. Brazil, 2007.
Variables Total (RS and SC) Rio Grande do Sul Santa Catarina
Total Obese p Total Obese p Total Obese p
n n % n % n %
Type of school 4,914 0.185 2,578 0.346 2,336 0.204
Municipal 3,444 376 10.8 1,824 263 12.9 1,620 113 7.3
State 1,470 171 12.8 754 108 14.7 716 63 8.8
School period 4,914 0.144 2,578 0.035 2,336 0.406
Morning 1,624 176 12.7 802 113 16.1 822 63 7.9
Afternoon 2,438 282 11.8 1,282 202 14.6 1,156 80 7.2
Full-time 852 89 9.0 494 56 8.4 358 33 9.3
Number of household 4,851 0.001 2,551 0.004 2,300 0.016
members
≤ 3 1,428 210 14.7 777 141 16.6 651 69 10.7
4 to 5 2,657 284 11.5 1,356 197 14.3 1,301 87 6.8
≥ 6 766 50 6.5 418 32 7.5 348 18 6.0
Number of rooms used 4,837 0.364 2,548 0.236 2,289 0.347
for sleeping
≤ 2 2,928 326 11.1 1,655 235 12.6 1,273 91 7.2
3-4 1,716 194 12.6 798 118 15.9 918 76 8.7
≥ 5 193 25 11.4 95 18 14.4 98 7 6.8
Household location 4,914 0.469 2,482 0.994 2,199 0.476
Urban 4,522 516 11.8 2,425 359 13.9 2,097 157 7.7
Rural 159 15 9.9 57 9 14.6 102 6 6
Maternal education 4,697 0.007 2,480 0.028 2,217 0.600
Elementary school 2,522 257 10.5 1,277 168 12.7 1,245 89 7.4
High school 1,740 231 13.9 968 165 16.9 772 66 8.6
College/university 435 47 9.8 235 31 10.7 200 16 8.2
Husband/partner 4,914 0.020 2,504 0.021 2,553 0.067
Yes 3,813 436 12.0 1939 289 14.6 1,874 147 8.1
No 944 95 9.9 565 75 11.8 379 20 5.2
Number of children 4,821 0.001 2,544 0.001 2,277 0.049
1 1,302 187 14.8 715 128 17.6 587 59 10.3
2 1,726 206 12.5 888 144 15.7 838 62 7.8
3-4 1,396 131 9.7 721 86 11.7 675 45 6.5
≥ 5 397 18 4.5 220 11 4.6 177 7 4.2
Mother’s age at birth 4,067 0.001 2,145 0.014 1,922 0.005
of first child
≤ 19 years 1,899 168 0.3 971 115 11.7 928 53 5.6
Table 2 (Continuation) Prevalence (%) of excess weight in the total population and by state according to variable categories. Rio Grande do Sul and Santa Catarina. Brazil, 2007.
Variables Total (RS and SC) Rio Grande do Sul Santa Catarina
Total Obese p Total Obese p Total Obese p
n n % n % n %
20-29 years 1,927 250 13.2 1,023 170 16.0 904 80 9.1
≥ 30 241 31 11.3 151 24 12.9 90 7 7.5
Mother’s age 4,698 0.280 2,478 0.467 2,220 0.334
≤ 19 years 929 82 10.1 468 55 12.8 461 27 6.2
20-29 years 2,362 268 11.4 1,236 176 13.5 1,126 92 8.2
≥ 30 years 1,407 172 12.4 774 126 15.1 633 46 7.6
Gender 4,914 0.360 2,578 2,336 0.073
Male 2,475 294 12.1 1,268 191 14.2 1,207 103 8.9
Female 2,439 253 10.8 1,310 180 13.5 1,129 73 6.5
Ethnicity 4,883 0.174 2,559 0.221 2,324 0.436
White 3,586 420 12.1 1,897 287 14.8 1,689 133 8.0
Non-white 1,297 126 10.1 662 83 11.7 635 43 7.2
Age (years) 4,914 0.316 2,578 0.234 2,336 0.851
4 -4.99 770 89 11.8 382 57 14.2 388 32 8.3
5- 5.99 1,881 195 10.4 1,000 132 12.0 881 63 7.7
6-6.99 2,263 263 12.3 1,196 182 15.2 1.067 81 7.7
Breastfeeding duration 4.278 0.194 2,255 0.471 2,023 0.586
(months)
≤ 1 248 35 14.8 134 22 17.4 114 13 10.8
1.01-2 358 47 13.5 207 33 15.5 151 14 9.9
2.01-4 734 78 11.7 389 53 13.4 345 25 7.3
4.01-6 643 73 11.8 349 49 10.1 294 26 9
6.01-12 810 70 9.1 395 44 13.3 415 26 6.5
> 12 1,485 167 11.2 781 114 13.1 704 53 7.8
Birth weight (g) 4,772 0.001 2,523 0.001 2,249 0.038
< 2,500 495 27 5.9 251 16 6.7 244 11 4.8
2,500-4,000 4,028 456 11.7 2,129 309 14.0 1,899 147 7.9
> 4,000 249 53 21.0 143 39 25.0 106 14 13
Premature 3,758 0.001 2,041 0.004 1,717 0.006
Yes 1.358 123 9.1 724 87 11.2 634 36 5.8
No 2,400 316 13.4 1,317 220 15.9 1,083 96 9.2
RS, Rio Grande do Sul; SC, Santa Catarina.
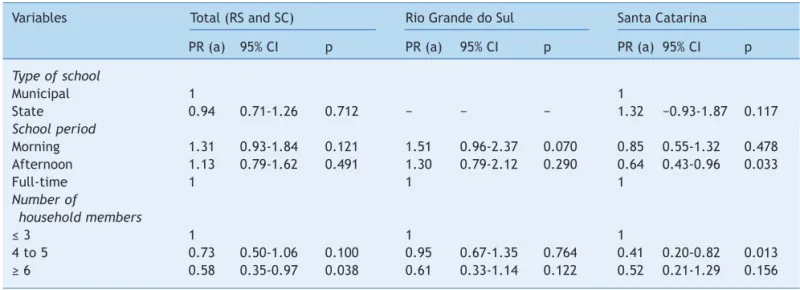
Tabela 3 Factors associated with excess weight in preschoolers according to the study variables for the total population (Rio Grande do Sul and Santa Catarina) and by state, obtained by multivariate analysis (Poisson regression). Brazil, 2007.
Variables Total (RS and SC) Rio Grande do Sul Santa Catarina
PR (a) 95% CI p PR (a) 95% CI p PR (a) 95% CI p
Type of school
Municipal 1 1
State 0.94 0.71-1.26 0.712 − − − 1.32 −0.93-1.87 0.117
School period
Morning 1.31 0.93-1.84 0.121 1.51 0.96-2.37 0.070 0.85 0.55-1.32 0.478
Afternoon 1.13 0.79-1.62 0.491 1.30 0.79-2.12 0.290 0.64 0.43-0.96 0.033
Full-time 1 1 1
Number of
household members
≤ 3 1 1 1
4 to 5 0.73 0.50-1.06 0.100 0.95 0.67-1.35 0.764 0.41 0.20-0.82 0.013
≥ 6 0.58 0.35-0.97 0.038 0.61 0.33-1.14 0.122 0.52 0.21-1.29 0.156
Discussion
Children enrolled in public preschools in RS presented a two-fold higher prevalence of excess weight than that
identified in SC, demonstrating a significant difference in the magnitude of childhood obesity in two Brazilian states located in the same region. This finding shows the existence of distinct phases within a nutritional transition
Tabela 3 (Continuation) Factors associated with excess weight in preschoolers according to the study variables for the total population (Rio Grande do Sul and Santa Catarina) and by state, obtained by multivariate analysis (Poisson regression). Brazil, 2007.
Variables Total (RS and SC) Rio Grande do Sul Santa Catarina
PR (a) 95% CI p PR (a) 95% CI p PR (a) 95% CI p
Number of rooms used for sleeping
≤ 2 1 1 1
3 to 4 1.60 1.24-2.06 0.001 1.69 1.23-2.32 0.002 1.80 1.33-2.44 0.001
≥ 5 1.35 0.64-2.83 0.420 1.63 0.78-3.40 0.189 1.36 0.56-3.31 0.492
Maternal education
Elementary school 1.30 0.91-1.85 0.150 1.68 1.11-2.53 0.015 − − −
High school 1.26 0.90-1.76 0.167 1.61 1.05-2.50 0.031 − − −
College/university 1 1
Husband/partner
Yes 1.52 1.20-1.93 0.001 1.44 1.12-1.86 0.005 2.23 1.12-4.43 0.023
No 1 1 1
Number of children
1 1 1 1
2 0.90 0.66-1.22 0.486 0.74 0.55-1.00 0.048 1.24 0.64-2.44 0.511
3 to 4 0.77 0.53-1.11 0.162 0.66 0.48-0.90 0.009 1.13 0.49-2.60 0.768
≥ 5 0.42 0.18-0.99 0.047 0.31 0.11-0.85 0.025 0.64 0.16-2.52 0.513
Mother’s age at birth of first child
≤ 19 years 0.88 0.72-1.06 0.181 0.87 0.66-1.14 0.306 0.72 0.42-1.25 0.238
20 to 29 years 1
≥ 30 years 0.86 0.60-1.24 0.415 0.90 0.58-1.40 0.646 0.64 0.26-1.54 0.315 Mother’s age
≤ 19 years − − − − − − 0.92 0.45-1.87 0.817
20 to 29 years − − − − − − 1
≥ 30 − − − − − − 1.09 0.62-1.91 0.763
Gender
Male − − − 1
Female − − − − − − 1.33 0.94-1.88 0.104
Ethnicity
White 1
Non-white 1.08 0.81-1.43 0.597 − − − − − −
Age (years) − − − − − − − − −
Breastfeeding duration (months)
≤ 1 1.22 0.82-1.80 0.317 − − − − − −
1.01-2 1.17 0.76-1.81 0.466 − − − − − −
2.01-4 1.05 0.64-1.74 0.828 − − − − − −
4.01-6 1 − − −
6.01-12 0.73 0.43-1.24 0.243 − − − − − −
≥ 12 0.95 0.68-1.31 0.754 − − − − − −
Birth weight g)
< 2,500 0.47 0.27-0.83 0.011 0.37 0.16-0.82 0.016 0.75 0.33-1.71 0.488
2,500 to 4,000 1
> 4,000 1.36 0.91-2.05 0.130 1.50 1.03-2.17 0.034 0.93 0.42-2.10 0.875 Premature
Yes 0.73 0.59-0.92 0.007 0.76 0.59-0.97 0.031 0.76 0.52-1.09 0.133
No 1 1 1
process in contiguous areas of Brazil, determined by different representations in each state of the social factors associated with this outcome.
The present results show a differentiation of Brazil in relation to other countries regarding the prevalence of childhood obesity. Onis et al.,17 analyzing data from 144
countries, estimated that there were 43 million overweight or obese children in 2010, and of those, 35 million were in developing countries, with an increase from 4.2% in 1990 to 6.7% in 2010.
The results of the present study indicate that social variables, together with the birth variables (birth weight and gestational age), were the most significant determinants for the higher prevalence of excess weight, being more significant for RS.
The results presented by Monteiro and Count18 in a study of secular trends in malnutrition and obesity in children younger than 5 years from the city of São Paulo, based on data from three surveys in the years 1974, 1989, and 1996, showed a frequency of excess weight between 3% and 4% that was restricted to children from wealthier households and that was higher in those whose maternal level of schooling was also higher. The present study demonstrated a higher prevalence of excess weight in children whose mothers had a high school level of education; the prevalence was lower when maternal education was at elementary school level or at college/university level.
In a cross-sectional study nested in a cohort of children 4 years of age, in Feira de Santana, state of Bahia, the prevalence of excess weight was 12.5% and, as in the present study, there were no differences between genders, and daughters of mothers with more years of education had higher prevalence of excess weight, but the practice of breastfeeding and maternal age at the child’s birth were not significantly associated with the prevalence of excess weight.19 Vitolo et al.12 found a prevalence of excess weight
of 9.8% in children younger than 5 years of age that was associated, in addition to higher socioeconomic status, with birth weight > 2,500 g and the trend of significant association when it was an only child.
Variables such as maternal education, number of household members, and the number of children allows inference of the dependents of family income and intrafamilial division of food available for consumption and therefore, on nutritional status. The lower rates of overweight among children from families with a higher number of members and higher number of children are possibly linked to a greater division of income and food.
The discussion on the determinants of obesity is complex and, in Brazil as well as in other countries, it has emphasized the study of the social determinants of childhood obesity, such as parental education and family income. In Germany, an assessment of children aged 6 years showed that those born to mothers with no education had a three-fold greater risk of obesity, when compared to those who were born to mothers with 13 years of schooling, and that poorer children had a 3.3-fold higher risk of being obese than wealthier children.20
In this study, most mothers had low educational level, consistent with Brazilian official statistics, which indicate that approximately 25% of individuals aged 25 years or older have
no education.21 The educational level of parents, especially
that of the mother, alters the development of obesity in children in many ways, but it can be suggested that more years of schooling reflect in higher income and the possibility of acquiring better quality food. Moreover, education provides the capacity to incorporate health recommendations and make healthy choices regarding food products, such as the inclusion of fruits and vegetables in the diet.
The present results indicate that the total duration of breastfeeding was not associated with the prevalence of excess weight in the studied children. Similarly, Durmus et al.22 showed that the duration of breastfeeding and
exclusive breastfeeding in the first six months tend to be associated with rates of growth in height, weight, and BMI in the period between 3 and 6 months of age, but not with the risk of overweight and obesity up to 3 years of age. However, it is essential to highlight the protective effect of breastfeeding against many diseases in childhood and adulthood. Lamberti et al.23 corroborate
the WHO recommendation that exclusive breastfeeding in the first 6 months of life is a key intervention for child survival.
Goldani et al.24 studied the influence of early life factors
on BMI in young adulthood and found higher BMI values among those who were born with high birth weight (> 4,000 g) and those born to families with lower socioeconomic status at the time of birth, a finding consistent with the present study, which demonstrated higher rates of excess weight in those born weighing more than 4,000 g and those born at term. Studies conducted in other regions of the world have also confirmed the association between high birth weight and development of obesity, such as the study of preschool children in Cyprus that presented odds ratios of 7.63 for birth weight > 4,000 g when compared to birth weight between 2,501 g and 3,000 g.25 Additionally,
in two recently published systematic review studies, the findings showed that high birth weight was associated with overweight and obesity in childhood, and that low birth weight had no influence on the increase of obesity in children, but those born with impaired intrauterine development would be more prone to it.10,26
The results of the present study show that 43% of the women had their first child during adolescence, and 20% of the assessed children were born when the mothers were aged ≤ 19 years. This is a high proportion when compared to Brazilian statistics: in 2008, the percentage of teenage mothers between 15 and 17 years old who had already had children was 6.3%, whereas in the South it was 4%.21
The prevalence rates of preterm birth are much higher than those found in studies carried out in Brazil and other countries. Barros et al.27 showed, using data from cohort
studies in Brazil, that in Pelotas, state of RS, prematurity rates increased from 6% in 1982 to 7.5% in 1993 and 15% in 2004; in Ribeirão Preto, state of São Paulo, the prevalence was 6% in 1978/1979 and 13.3% in 1994. According to Bettiol et al.,28 the development of population studies in Brazil is necessary to assess the prevalence and long-term evolution of the rate of preterm infants.
family income, which would allow for a more adequate understanding of the results. The fact that the sample was selected only from public schools does not allow for a broader generalization about the prevalence of excess weight for children in this age group in the general population.
In the present study, the prevalence of excess weight occured differently in the two states, possibly related to distinct epidemiological and nutritional changes determined by socioeconomic factors. The interaction between social factors in the determination of obesity is complex, having a distinct impact in similar social groups and a sometimes similar impact in individuals from extremely divergent social groups.29
This study contributed to the understanding of the nutritional transition process in Brazil by demonstrating signiicant differences between adjacent states. Further studies, including new variables, are needed for a better interpretation of the differences observed in this study. It is possible, based on the results of this study, to draw attention to the need for greater investment in terms of public child protection policies, particularly those related to maternal and child education, health promotion,and nutritional monitoring.
Funding
Fundo Nacional de Desenvolvimento da Educação (FNDE/ MEC), through Centro Colaborador em Alimentação e Nutrição do Escolar of UFRGS.
Conlicts of interest
The authors have no conflicts of interest to declare.
Acknowledgements
To the families of the preschool children who participated in the study. To the school employees for their good will and support in ield data collection. To the graduate fellows and dietitians who participated in the data collection in the two states. To the Centro Colaborador em Alimentação e Nutrição do Escolar of the Universidade Federal do Rio Grande do Sul.
References
1. Obesity: preventing and managing the global epidemic. Report of a WHO consultation. World Health Organ Tech Rep Ser. 2000;894:i-xii, 1-253.
2. Dietz WH, Bellizzi MC. Introduction: the use of body mass index to assess obesity in children. Am J Clin Nutr. 1999;70:123S-5S. 3. Cole TJ, Bellizzi MC, Flegal KM, Dietz WH. Establishing a
standard deinition for child overweight and obesity worldwide: international survey. BMJ. 2000;320:1240-3.
4. Lanigan J, Singhal A. Early nutrition and long-term health: a practical approach. Proc Nutr Soc. 2009;68:422-9.
5. Brasil. Ministério da Saúde. Pesquisa Nacional de Demograia e Saúde da Criança e da Mulher – PNDS 2006: dimensões do processo reprodutivo e da saúde da criança. Brasília: Ministério da Saúde; 2009. 300 p.
6. Instituto Brasileiro de Geograia e Estatística (IBGE). Pesquisa de orçamentos familiares 2008-2009: antropometria e estado nutricional de crianças, adolescentes e adultos no Brasil. Rio de Janeiro: IBGE; 2010.
7. Danielzik S, Czerwinski-Mast M, Langnäse K, Dilba B, Müller MJ. Parental overweight, socioeconomic status and high birth weight are the major determinants of overweight and obesity in 5-7 y-old children: baseline data of the Kiel Obesity Prevention Study (KOPS). Int J Obes Relat Metab Disord. 2004; 28:1494-502.
8. Savva SC, Tornaritis M, Chadjigeorgiou C, Kourides YA, Savva ME, Panagi A, et al. Prevalence and socio-demographic associations of undernutrition and obesity among preschool children in Cyprus. Eur J Clin Nutr. 2005;59:1259-65.
9. Singh GK, Kogan MD, Van Dyck PC, Siahpush M. Racial/ethnic, socioeconomic, and behavioral determinants of childhood and adolescent obesity in the United States: analyzing independent and joint associations. Ann Epidemiol. 2008;18:682-95. 10. Rossi CE, Vasconcelos FA. Birth weight and obesity in children
and adolescents: a systematic review. Rev Bras Epidemiol. 2010;13:246-58.
11. Saldiva SR, Escuder MM, Venâncio SI, Benício MH. Prevalence of obesity in preschool children from ive towns in São Paulo State, Brazil. Cad Saúde Pública. 2004;20:1627-32.
12. Vitolo MR, Gama CM, Bortolini GA, Campagnolo PD, Drachler M de L. Some risk factors associated with overweight, stunting and wasting among children under 5 years old. J Pediatr (Rio J). 2008;84:251-7.
13. Post CL, Victora CG, Barros FC, Horta BL, Guimarães PR. Infant malnutrition and obesity in two population-based birth cohort studies in southern Brazil: trends and diferences. Cad Saúde Pública. 1996;12:49-57.
14. Physical status: the use and interpretation of anthropometry. Report of a WHO Expert Committee. World Health Organ Tech Rep Ser. 1995;854:1-452.
15. World Health Organization (WHO). WHO Child Growth Standards: length/height-for-age, weight-for age, weight-for-length, weight-for-height and body mass index-for-age. Methods and development. WHO (nonserial publication). Geneva: WHO; 2006.
16. de Onis M, Onyango AW, Borghi E, Siyam A, Nishida C, Siekmann J. Development of a WHO growth reference for school-aged children and adolescents. Bull World Health Organ. 2007;85:660-7. 17. de Onis M, Blössner M, Borghi E. Global prevalence and trends
of overweight and obesity among preschool children. Am J Clin Nutr. 2010;92:1257-64.
18. Monteiro CA, Conde WL. Secular trends in malnutrition and obesity among children in the city of São Paulo, Brazil (1974-1996). Rev Saúde Pública. 2000;34:52-61.
19. Jesus GM, Vieira GO, Vieira TO, Martins C da C, Mendes CM, Castelão ES. Determinants of overweight in children under 4 years of age. J Pediatr (Rio J). 2010;86:311-6.
20. Lamerz A, Kuepper-Nybelen J, Wehle C, Bruning N, Trost-Brinkhues G, Brenner H, et al. Social class, parental education, and obesity prevalence in a study of six-year-old children in Germany. Int J Obes (Lond). 2005;29:373-80.
21. Instituto Brasileiro de Geograia e Estatística (IBGE). Síntese de Indicadores Sociais: uma análise das condições de vida da população brasileira em 2008. Rio de Janeiro: IBGE; 2008. 280p.
23. Lamberti LM, Fischer Walker CL, Noiman A, Victora C, Black RE. Breastfeeding and the risk for diarrhea morbidity and mortality. BMC Public Health. 2011;11:S15.
24. Goldani MZ, Haeffner LS, Agranonik M, Barbieri MA, Bettiol H, Silva AA. Do early life factors inluence body mass index in adolescents? Braz J Med Biol Res. 2007;40:1231-6.
25. Savva SC, Tornaritis M, Chadjigeorgiou C, Kourides YA, Savva ME, Panagi A, et al. Prevalence and socio-demographic associations of undernutrition and obesity among preschool children in Cyprus. Eur J Clin Nutr. 2005;59:1259-65.
26. Martins EB, Carvalho MS. Birth weight and overweight in childhood: a systematic review. Cad Saúde Pública. 2006;22: 2281-300.
27. Barros FC, Diaz-Rossello JL. Redes multicêntricas e a qualidade da atenção neonatal. J Pediatr (Rio J). 2004;80:254-6. 28. Bettiol H, Barbieri MA, da Silva AA. Epidemiology of preterm
birth: current trends. Rev Bras Ginecol Obstet. 2010;32: 57-60.