Jornal de Pediatria
Copyright © 2008 by Sociedade Brasileira de Pediatria
O
RIGINALA
RTICLESome risk factors associated with overweight, stunting and
wasting among children under 5 years old
Márcia R. Vitolo,1 Cíntia M. Gama,2 Gisele A. Bortolini,3 Paula D. B. Campagnolo,3 Maria de Lourdes Drachler2
Abstract
Objective:To explore whether socioeconomic and sanitary conditions, maternal and child factors are associated with overweight, stunting, and wasting in children under five year old in the city of São Leopoldo, southern Brazil.
Methods:Cross-sectional study of 3,957 children aged 1 month to 5 years conducted in all primary care services of the city during the National Children’s Vaccination Day in 2002. Maternal and child factors were assessed by a questionnaire. Children’s height and weight were measured. Cluster analysis was used to group the areas served by the primary care services according to socioeconomic and sanitary conditions of the census tracts assessed by the 2001 National Census.
Results:Wasting was observed in 2.6% of children, stunting in 9.1% and overweight in 9.8%. The multivariable logistic regression model suggests that overweight was associated with higher socioeconomic status and better sanitation of the area (OR = 1.47; 95%CI 1.09-1.96), single child (OR = 1.44; 95%CI 1.00-2.07) and birth weight ≥ 2,500 g (OR = 2.21; 95%CI 1.27-3.83). Wasting was associated with low birth weight (OR = 3.46; 95%CI 2.06-5.80) and mother’s age < 20 years (OR = 1.99; 95%CI 1.09-3.62). Stunting was associated with low socioeconomic status and poor sanitation of the area (OR = 2.36; 95%CI 1.51-3.69), three or more siblings (OR = 3.12; 95%CI 2.18-4.47), low birth weight < 2,500 g (OR = 3.49; 95%CI 2.53-4.80), child age < 36 months (OR = 1.77; 95%CI 1.37-2.29) and mother’s age < 20 years (OR = 1.60; 95%CI 1.09-2.35).
Conclusions:Overweight and stunting were the major anthropometric problems and therefore should be a priority for public policies.
J Pediatr (Rio J). 2008;84(3):251-257:Nutritional status, children, risk factors, anthropometrics, overweight, and stunted growth.
Introduction
Brazilian surveys conducted between 1975 and 19961-3 and recent population-based studies in different Brazilian regions4,5have suggested that there is a decrease in stunting and wasting and an increase in overweight among children younger than 5 years. However, current population based data on the nutritional status of children in Brazil is scarce. The 2000/2003 Family Budget Survey provided data on children, but the Brazilian Institute of Geography and Statistics (IBGE)
does not recommend the use of these data for children due to measurement errors in children’s height.6
The assessment of the association between children’s nutritional status associated and the socioeconomic condi-tions, maternal and child factors is essential for the develop-ment and evaluation of public policies aimed at health equity. Studies conducted in various Brazilian regions have exam-ined the association of children’s nutritional status with fam-ily income and parent’s education . This studies suggest that lower socioeconomic status is a risk factor for wasting and
1. Doutora, Universidade Federal de Ciências da Saúde de Porto Alegre (UFCSPA), Porto Alegre, RS, Brazil. 2. Mestre. UFCSPA, Porto Alegre, RS, Brazil.
3. Doutora. School of Allied Health Professions, University of East Anglia (UEA), Norwich, UK.
No conflicts of interest declared concerning the publication of this article.
Suggested citation:Vitolo MR, Gama CM, Bortolini GA, Campagnolo PD, Drachler ML. Some risk factors associated with overweight, stunting and wasting among children under 5 years old. J Pediatr (Rio J). 2008;84(3):251-257.
Manuscript received Nov 14 2007, accepted for publication Jan 30 2008.
doi:10.2223/JPED.1776
stunting in children,7-10whereas the risk for overweight tends to be greater in families with a higher socioeconomic back-ground.4,11In the last 5 years, few population-based studies on nutritional status and risk factors for overweight, stunting and wasting have been undertaken in Brazil.12,13Such stud-ies are needed to report on social inequalitstud-ies on the nutri-tional status of Brazilian children.
This article assesses some socioeconomic and sanitary conditions, child and maternal factors associated with over-weight, stunting, and wasting in under-five year old children who attended the National Vaccination Day in the primary care services in the city of São Leopoldo, southern Brazil, in 2002.
Methods
Data collection was carried out in children from 1 month to 5 years who attended the National Vaccination Day in the primary care services in the city of São Leopoldo, during the National Vaccination Day in 24 of August 2002. São Leopoldo is about 30 km from the capital of the southern Brazilian state, Rio Grande do Sul. São Leopoldo has 193,547 inhabitants, including 17,779 children younger than 5 years; literacy rate is 95.6%.14The immunization campaign included 13 primary care services. The four mobile health units were not included in this study because they did not have adequate conditions for the measurements of children’s height and weight.
The data was collected by 102 nutrition students from Uni-versidade do Vale do Rio dos Sinos. They were trained by nutri-tionists to measure children’s weight and height and to apply a questionnaire to the child’s mother or carer. The question-naire assessed age, sex, date of birth, gestational age at birth, birth weight, number of siblings, and mother’s age. Data col-lection was supervised by nutritionists. The height of infants younger than 2 years was measured using a wooden stadiometer; they were weighted using Welmy®pediatric scales. Children older than 2 years were weighed using a por-table Techline®digital scales. Height was measured using a non-extensible Seca®tape attached to a smooth wall surface containing no baseboard, and with the help of a wide wooden sliding piece. Nutritional status was expressed as z-score according to the Multicentre Growth Study standard recom-mended by the World Health Organization.15Stunting was defined by child’s height-for-age z-scores < -2 standard devia-tion (SD) wasting by weight-for-height < -2 SD and over-weight by over-weight-for-height > 2 SD of these international standards.16
The socioeconomic and sanitary conditions of the areas served by the primary care services were estimated using cen-sus tracts data of the 2001 National Cencen-sus. The following information was collected for each census tract: percentage of heads of household with primary education, income of the heads of household (in percentiles) and percentage of house-holds with inadequate sewage system. Cluster analysis was used to group the areas served by the primary care services
according to these socioeconomic and sanitary conditions as follows: (I) area with low socioeconomic and sanitary condi-tions (n = 1 area), which presented one third of households with inadequate sewage system and most of the principal earners did not complete primary education and were below the 3rd percentile for the income municipality; (II) area with intermediate socioeconomic and sanitation (n = 8 areas), characterized by < 10% of households with inadequate sew-age system, but still a predominance (50-60%) of low school-ing and income; (III) area with higher sanitary conditions and socioeconomic conditions (n = 4 areas), where almost all households had adequate sewage system (97.5%) and a pre-dominance of primary education and (58%) and income higher than the 3rd percentile. Ethical clearance was obtained from Ethics Committee of the Universidade Federal do Rio Grande do Sul (UFRGS). A questionnaire about child and mother’s factors were applied to the mother or care giver, after a written informed consent. The data was double-entered by independent data entry operators using Epi-Info. Anthro 2005 was used to calculate the children’s nutritional status.17
Multivariable logistic regression taking into account the conceptual hierarchy of the risck factors in the process that determines overweight, wasting and stunting was carried out using the SPSS, version 11.0. Initially, we estimated the odds ratios for sociodemographic variables, child’s age and sex, adjusted for each other (variables of block 1). It was pre-defined that variables of block 1, whose statistical signifi-cance was lower than 20% (p < 0.2), would be included as possible confounding factors for the variables of interest in block 2: mother’s age; model 3: number of siblings and birth weight. Likewise, if the p for mother’s age would be lower than 0.2, these variable would be also kept as possible confound-ing factor for the variables of interest in block 3: number of siblings and birth weight. An association was taken as statis-tically significant if the p < 5% (p < 0.05).
Results
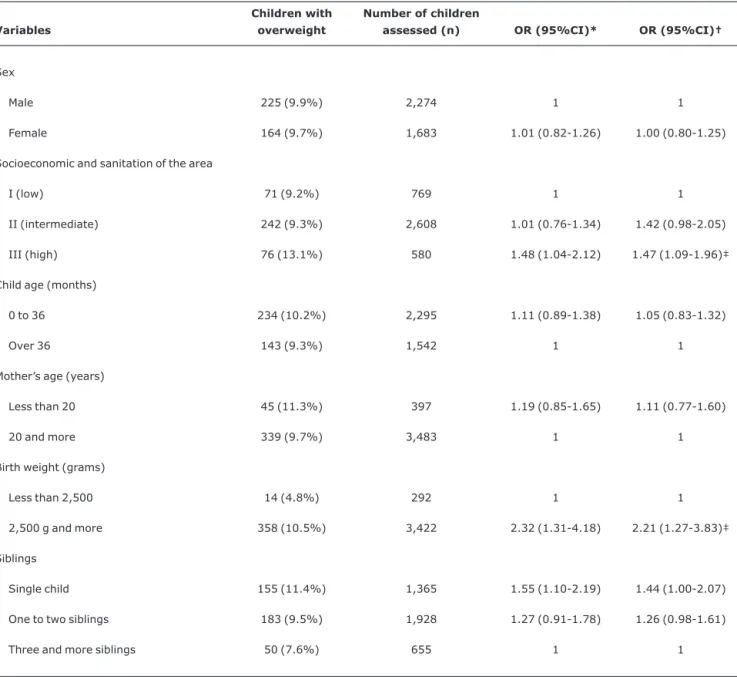
Wasting was observed in 2.6% (n = 103), stunting in 9.1% (n = 361) and overweight in 9.8% (n = 389) of the assessed children. Tables 1 through 3 show the distribution of children according to the exposure variables analyzed.
Table 1 shows the factors associated with overweight. The odds ratios adjusted for possible confounding factors suggest that overweight is positively associated with the area with high socioeconomic level (OR = 1.47; 95%CI 1.09-1.96), with birth weight ≥ 2,500 g (OR = 2.21; 95%CI 1.27-3.83) and with a tendency towards significant association in case of no sib-lings (OR = 1.44; 95%CI 1.00-2.07).
for those whose mother’s age was less than 20 years (OR = 1.99; 95%CI 1.09-3.62).
Table 3 shows the factors associated with stunting. The odds for stunting was two times as high in the area with low socioeconomic and sanitary (OR = 2.36; 95%CI 1.51-3.69) and 1.5 times higher in the area with intermediate conditions (OR = 1.57; 95%CI 1.20-2.05), compared to the wealthier areas. The odds of stunting was also higher among infants with low birth weight (OR = 3.49; 95%CI 2.53-4.80) and among children with one or two siblings (OR = 1.82; 95%CI 1.36-2.43) it was three times as high among those with three
or more siblings ren (OR = 3.12; 95%CI 2.18-4.47) com-pared to single child. Male sex (OR = 1.36; 95%CI 1.07-1.72) and age up to 36 months (OR = 1.77; 95%CI 1.37-2.29) were also associated with stunting.
Discussion
Overweight and stunting are the major nutritional prob-lems, which is consistent with the latest studies conducted in Brazil.1-3In this study, the risk for overweight was higher for children attending the NationalVaccination Day at primary care centres located in areas with a high socioeconomic and
Table 1- Prevalence of children with overweight and socioeconomic and demographic variables (odds ratios and confidence interval)
Variables
Children with overweight
Number of children
assessed (n) OR (95%CI)* OR (95%CI)†
Sex
Male 225 (9.9%) 2,274 1 1
Female 164 (9.7%) 1,683 1.01 (0.82-1.26) 1.00 (0.80-1.25)
Socioeconomic and sanitation of the area
I (low) 71 (9.2%) 769 1 1
II (intermediate) 242 (9.3%) 2,608 1.01 (0.76-1.34) 1.42 (0.98-2.05)
III (high) 76 (13.1%) 580 1.48 (1.04-2.12) 1.47 (1.09-1.96)‡
Child age (months)
0 to 36 234 (10.2%) 2,295 1.11 (0.89-1.38) 1.05 (0.83-1.32)
Over 36 143 (9.3%) 1,542 1 1
Mother’s age (years)
Less than 20 45 (11.3%) 397 1.19 (0.85-1.65) 1.11 (0.77-1.60)
20 and more 339 (9.7%) 3,483 1 1
Birth weight (grams)
Less than 2,500 14 (4.8%) 292 1 1
2,500 g and more 358 (10.5%) 3,422 2.32 (1.31-4.18) 2.21 (1.27-3.83)‡
Siblings
Single child 155 (11.4%) 1,365 1.55 (1.10-2.19) 1.44 (1.00-2.07)
One to two siblings 183 (9.5%) 1,928 1.27 (0.91-1.78) 1.26 (0.98-1.61)
Three and more siblings 50 (7.6%) 655 1 1
95%CI = 95% confidence interval; OR = odds ratio. * Unadjusted odds ratio.
† Adjusted odds ratio (block 1 = sex, socioeconomic and sanitary conditions, child’s age; block 2 = block 1 plus mother’s age; block 3 = block 1 plus mother’s age, birth weight and number of siblings).
sanitary conditions. The association between overweight and socioeconomic factors seems to depend on the country and on the age assessed. In industrialized countries, the preva-lence of childhood obesity is higher among children whose families have a lower socioeconomic costatus.18,19 Con-versely, in developing countries, overweight and obesity among children are usually more prevalent in families with a higher socioeconomic conditions.4,11,20,21Our study also shows a higher prevalence of overweight in areas with a higher socioeconomic and sanitary conditions, thus corroborating the latest data obtained by Brazilian studies. Similarly to other
studies5,11,18low-birth weight was associated with a lower risk of overweight, whilst being a single child increased this risk. This association may be partially explained by better socio-economic status of families. However, there are other factors known as strongly correlated with overweight in children which were not covered by our study, such as early weaning, inappropriate nutritional practices and sedentary lifestyle.
The prevalence of 2.6% for wasting in children observed in study is consistent with the expected prevalence for the
Table 2- Prevalence of children with wasting and socioeconomic and demographic variables (odds ratios and confidence interval)
Variables
Children with wasting
Number of children
assessed (n) OR (95%CI)* OR (95%CI)†
Sex
Male 59 (2.6%) 2,274 1 1
Female 44 (2.6%) 1,683 1.01 (0.67-1.52) 0.90 (0.59-1.39)
Socioeconomic and sanitation of the area
I (low) 13 (1.7%) 769 1 1
II (intermediate) 74 (2.8%) 2,608 1.70 (0.91-3.23) 1.50 (0.69-3.27)
III (high) 16 (2.8%) 580 1.65 (0.75-3.67) 0.99 (0.55-1.80)
Child age
0 to 36 months 67 (2.9%) 2,295 1.47 (0.95-2.25) 1.26 (0.80-2.00)
Over 36 months 31 (2.0%) 1,542 1 1
Mother’s age
Younger than 20 years 19 (4.8%) 397 2.08 (1.25-3.47) 1.99 (1.09-3.62)‡
20 years or older 82 (2.4%) 3,483 1 1
Birth weight
Less than 2,500 g 21 (7.2%) 292 3.37(2.05-5.54) 3.46 (2.06-5.80)‡
2,500 g and more 77 (2.3%) 3,422 1 1
Siblings
Single child 35 (2.6%) 1,365 1 1
One or two siblings 54 (2.8%) 1,928 1.09 (0.70-1.72) 1.11 (0.55-2.28)
Three and more siblings 14 (2.1%) 655 0.87 (0.44-1.60) 0.87 (0.45-1.66)
95%CI = 95% confidence interval; OR = odds ratio. * Unadjusted odds ratio.
† Adjusted odds ratio (block 1 = sex, socioeconomic and sanitary conditions, child’s age; block 2 = block 1 plus mother’s age; block 3 = block 1 plus mother’s age, birth weight and number of siblings).
general population. Studies conducted in other Brazilian cit-ies and regions have also suggested low prevalence of wast-ing.4,12,22,23In this study, we used weight-for-height instead of the weight-for-age ratio; although growth curves based on age percentiles can be used in the health units to monitor chil-dren’s growth channel, they are inadequate for nutritional
diagnosis as most children with stunting may be misdiag-nosed as being wasted.
This study showed that low-birth weight was associated with wasting and stunting with stunting, which is a form of chronic malnutrition with remarkable effects on the health
Table 3- Prevalence of children with stunting and socioeconomic and demographic variables (odds ratios and confidence interval)
Variables
Children with stunting
Number of children
assessed (n) OR (95%CI)* OR (95%CI)†
Sex
Male 220 (9.7%) 2,275 1.17 (0.94-1.46) 1.36 (1.07-1.72)‡
Female 141 (8.4%) 1,683 1 1
Socioeconomic and sanitation in the area
I (low) 102 (13.3%) 769 2.71 (1.76-4.21) 2.36 (1.51-3.69)‡
II (intermediate) 228 (8.7%) 2,608 1.70 (1.14-2.55) 1.57 (1.20-2.05)‡
III (high) 31 (5.3%) 581 1 1
Age
0 to 36 months 67 (2.9%) 2,295 1.47 (0.95-2.25) 1.26 (0.80-2.00)
Over 36 months 31 (2.0%) 1,542 1 1
Mother’s age
Younger than 20 years 50 (12.6%) 397 1.49 (1.08-2.05) 1.60 (1.09-2.35)‡
20 years or older 307 (8.8%) 3,484 1 1
Birth weight
Less than 2,500 g 69 (23.6%) 292 3.53 (2.62-4.74) 3.49 (2.53-4.80)‡
2,500 g or more 276 (8.1%) 3,422 1 1
Age
0 to 36 months 245 (10.7%) 2,294 1.71 (1.34-2.17) 1.77 (1.37-2.29)‡
Over 36 months 101 (6.5%) 1,544 1 1
Siblings
Single child 86 (6.3%) 1,365 1 1
One or two siblings 177 (9.2%) 1,930 1.50 (1.14-1.98) 1.82 (1.36-2.43)‡
Three and more siblings 96 (14.7%) 654 2.56 (1.86-3.52) 3.12 (2.18-4.47)‡
95%CI = 95% confidence interval; OR = odds ratio. * Unadjusted odds ratio.
† Adjusted odds ratio (block 1 = sex, socioeconomic and sanitary conditions, child’s age; block 2 = block 1 plus mother’s age; block 3 = block 1 plus mother’s age, birth weight and number of siblings).
health of disadvanteged populations. These findings confirm the importance that should be given to women’s health, pre-natal care and the surveilance of children with low-birth weight. Young motherhood is another risk factor for wasting, which underscores the need to prioritize nutritional surveil-lance of teenage women due to the higher nutritional risk to which their children are exposed.24Stunting has been consid-ered a better indicator of negative environmental influences on children’s health than is wasting, since it is the most sen-sitive indicator of malnutrition in developing countries.
Differently from overweight which is more likely among people in higher socio-economic conditions, the risk for stunt-ing was greater for those with a lower socioeconomic sta-tus8,10,25 and low birth weight as as shown in other studies.4,12,23The risk for stunting increased with the num-ber of siblings, which probably represents another indicator of families with a lower socioeconomic status and limited mother’s availability for child care. In the present study, the risk for stunting was higher for children aged up to 36 months. The same association was found by other studies and should be interpreted with caution due to the cross-sectional design of the study.13,26Further longitudinal studies are needed to clarify whether there is some recovery of linear growth after the first 3 years of life. In this study, male children were at higher risk for stunting, suggesting that boys seem to be more vulnerable. A population-based study carried out in Porto Alegre (RS) in the 1990s showed higher prevalence of stunt-ing among male children, but no statistical significance was observed.13
With regard to the limitations of the present study, is the possibility that some children did not took part in the study because their parents did not want to spend time cueing for the anthropometric measurements of the child. The sociode-mographic classification may not correspond to the area of residence of some children, who might have been vaccinated in primary care centers which were not close to their area of residence.
Conclusions
Overweight and stunting were the major anthropometric problems observed in this study and should be contemplated by current public policies. One should evaluate the policies set up for nutritional disorders in the public health systems, which still priorize the combat against childhood malnutrition within the anthropometric context. A previous study with 1,200 preschool children from a public municipal school of the state of São Paulo revealed a higher prevalence of over-weight among children, showing a process of nutritional tran-sition in this age group.27The adoption of public policies such as nutritional surveillance and health surveillance of children from the moment of conception may reduce low birth weight and stunting rates in Brazil, in addition to helping control excessive gain weight in the first years of life.
Acknowledgements
We want to express our gratitude to the Coordinating Group of the Nutrition Program . of the Municipal Health Department of São Leopoldo.
References
1. Instituto Brasileiro de Geografia e Estatística (IBGE). Estudo Nacional de Despesa Familiar (ENDEF). Rio de Janeiro: IBGE; 1974.
2. Instituto Nacional de Alimentação e Nutrição (INAN). Pesquisa Nacional sobre Saúde e Nutrição. Perfil de Crescimento da População Brasileira de 0 a 25 anos - PNSN. Brasília: INAN; 1989.
3. Instituto Brasileiro de Geografia e Estatística (IBGE). Sociedade Civil Bem-Estar Familiar no Brasil. Pesquisa Nacional sobre Demografia e Saúde - PNDS; 1996. Rio de Janeiro: IBGE; 1996.
4. Monteiro CA, Conde WL.Tendência secular da desnutrição e da obesidade na infância na cidade de São Paulo (1974-1996).Rev Saude Publica. 2000;34:S52-61.
5. Gigante DP, Victora CG, Pavin CL, Barros AFC.Tendências no perfil nutricional das crianças nascidas em 1993 em Pelotas, Rio Grande do Sul, Brasil: análises longitudinais.Cad Saude Publica. 2003;19:S141-7.
6. Instituto Brasileiro de Geografia e Estatística (IBGE).Pesquisa de Orçamentos Familiares 2002-2003. Antropometria e análise do estado nutricional de crianças e adolescentes no Brasil. Rio de Janeiro: IBGE; 2006.
7. Wang Y, Monteiro C, Popkin BM. Trends of obesity and underweight in older children and adolescents in the United States, Brazil, China, and Russia. Am J Clin Nutr. 2002;75: 971-7.
8. Engstrom EM, Anjos LA.Relação entre o estado nutricional materno e sobrepeso nas crianças brasileiras.Rev Saude Publica. 1996;30:233-9.
9. Arifeen AE, Black RE, Caulfield LE, Antelman G, Baqui AH, Nahar Q.Infant growth patterns in the slums of Dhaka in relation to birth weight, intrauterine growth retardation, and prematurity.
Am J Clin Nutr. 2000;72:1010-7.
10. Guimarães LV, Latorre MD, Barros MB.Fatores de risco para a ocorrência de déficit estatural em pré-escolares. Cad Saude Publica. 1999;15:605-15.
11. Drachler ML, Macluf SP, Leite JC, Aerts DR, Giugliani ER, Horta BL.Fatores de risco para sobrepeso em crianças no Sul do Brasil.Cad Saude Publica. 2003;19:1073-81.
12. Corso AC, Botelho LJ, Zeni LA, Moreira EA.Sobrepeso em crianças menores de 6 anos de idade em Florianópolis, SC.Rev Nutr. 2003; 16:21-8.
13. Aerts D, Drachler ML, Giugliani ER.Determinants of growth retardation in Southern Brazil.Cad Saude Publica. 2004;20: 1182-90.
14. Instituto Brasileiro de Geografia e Estatística (IBGE). Sistema de Recuperação de Informação Georreferenciadas; Censo 2000.[CD ROM]. Rio de Janeiro: IBGE; 2003.
16. World Health Organization (WHO). Physical Status: The use and interpretation of anthropometry. Report of WHO Expert Committee, WHO Technical Report Series, 854. Geneva: WHO; 1995.
17. World Health Organization (WHO). Anthro 2005. [computer program].Versão beta (Feb 17th, 2006).http://www.who.int/ childgrowth/software/en/
18. von Kries R, Koletzko B, Sauerwald T, von Mutius E, Barnert D, Grunert V, et al.Breast feeding and obesity: cross sectional study. BMJ. 1999;319:147-50.
19. Ogden CL, Flegal KM, Carroll MD, Johnson CL.Prevalence and trends in overweight among US children and adolescents, 1999-2000.JAMA. 2002;288:1728-32.
20. al-Isa AN, Moussa MA.Factors associated with overweight and obesity among Kuwaiti kindergarten children aged 3-5 years. Nutr Health. 1999;13:125-39.
21. Kain J, Vio F, Albala C.Obesity trends and determinant factors in Latin America.Cad Saude Publica. 2003;19 Suppl 1:S77-86. 22. Victora CG, Gigante DP, Barros AJ, Monteiro CA, de Onis M.
Estimativa da prevalência de déficit de altura/idade em criança brasileiras.Rev Saude Publica. 1998;32:321-7.
23. Strufaldi MW, Puccini RF, Pedroso GC, da Silva EM, da Silva NN.
Prevalência de desnutrição em crianças residentes no município de Embu, São Paulo, Brasil, 1996-1997. Cad Saude Publica. 2003;19:421-8.
24. Lima M, Figueira, F, Ebrahim GJ.Malnutrition among children of adolescent mothers in a squatter community of Recife, Brazil. J Trop Pediatr. 1990;36:14-9.
25. Marins VM, Coelho MA, Matos HJ, Amaral NS, Valle J, Gismondi RC, et al.Perfil antropométrico de crianças de 0 a 5 anos do município de Niterói, Rio de Janeiro, Brasil.Cad Saude Publica. 1995;11:246-53.
26. de Onis M, Frongillo EA, Blössner M.Is malnutrition declining? An analysis of changes in levels of child malnutrition since 1980. Bull World Health Organ. 2000;78:1222-33.
27. Guimarães LV, Barros MB.As diferenças de estado nutricional em pré-escolares de rede pública e a transição nutricional. J Pediatr (Rio J). 2001;77:381-6.
Correspondence: Márcia Regina Vitolo
Departamento de Saúde Coletiva - UFCSPA Avenida Sarmento Leite, 245