Weight-Gain Velocity in Newborn Infants Managed
with the Kangaroo Method and Associated Variables
Raquel Guimara˜es Nobre1 • Daniela Vasconcelos de Azevedo1• Paulo Ce´sar de Almeida1•Na´dia Maria Gira˜o Saraiva de Almeida2• Francisco Edson de Lucena Feitosa3
Published online: 15 July 2016
ÓSpringer Science+Business Media New York 2016
Abstract Objectives The Kangaroo method helps promote maternal breastfeeding and adequate growth of low birth-weight preterm infants. The objective of this study was to analyze the association between weight-gain velocity during use of the Kangaroo method and maternal and infant variables.
MethodsA nested cross-sectional study in a cohort of newborn infants managed using the Kangaroo method was carried out at a reference center for the method in Brazil. Data on low birthweight and preterm infants managed using the Kangaroo Method (n=78) and on their respective mothers (n=70) was collected between January and July 2014. Maternal and infant variables were associated and correlated with weight-gain velocity (g/kg/day) at each phase of the method (p\0.05).ResultsMean weight-gain velocity increased from
0.12±11.11 g/kg/day in the first phase to 13.47±4.84 g/ kg/day in the third phase (p\0.001), and percentage of
adequate weight increased at phase 3 (p\0.001).
Birth-weight was inversely correlated with Birth-weight-gain velocity at phases 1 and 2 of the Kangaroo method. Birthweight of under
1500 g was associated with a lower likelihood of inadequate weight-gain velocity of the newborn at phase 1 (OR=0.1; 95 % CI 0.01–0.78;p=0.012). In phase 3, maternal age was directly correlated with weight-gain velocity. Conclusions
Weight-gain velocity was associated with maternal (age) and infant (gestational age at birth, birthweight, weight for ges-tational age at birth, length of hospital stay and five-minute Apgar score) variables. Knowledge of the factors influencing weight-gain velocity and its behavior at each phase of the method can help guide conduct toward potentializing factors that promote adequate weight-gain.
Keywords Kangaroo-mother care methodGrowth
Weight gainNewbornNeonatology
Significance
The Kangaroo method acts positively on the growth and promotion of breastfeeding in premature infants and low birth weight. There is a lack of studies involving the growth of preterm and low birth weight during the three phases of the Kangaroo Method. Weight-gain velocity rate increases over the phases and was associated with maternal (age) and infant (gestational age at birth, birthweight, gestational weight for age at birth, length of hospital stay and five-minute Apgar score) variables in different ways in the three phases of the Kangaroo method.
Introduction
The Kangaroo method (KM) is recommended by the World Health Organization (WHO) as an alternative to conven-tional care for preterm and low birthweight newborn & Raquel Guimara˜es Nobre
Daniela Vasconcelos de Azevedo [email protected]
Paulo Ce´sar de Almeida [email protected]
Na´dia Maria Gira˜o Saraiva de Almeida [email protected]
Francisco Edson de Lucena Feitosa [email protected]
1 State University of Ceara´, Fortaleza, Ceara´, Brazil
2 School of Public Health of Ceara´, Fortaleza, Ceara´, Brazil
infants (NB) that promotes humanized conduct and direct skin-to-skin contact between mother and infant whenever possible (Brasil 2013; WHO 2012). First developed and implemented in Colombia, by the doctor Edgar Rey, in the 70 s, the KM emerged as an alternative to conventional hospital care, due to the lack of resources such as incu-bators, and high rates of infection and maternal abandon-ment (Conde-Agudelo and Beliza´n2011). Although it has since been used more often in situations of limited resources and low-income countries, it should be more widespread worldwide because of its innumerous benefits, such as increased breastfeeding rates and reduced risk of complications and hospitalization (Rodgers2013).
KM consists of three phases which evolve according to criteria of clinical stability, weight-gain of NB and maternal and family safety in the care of the newborn. The first phase may begin pre-natally but more often com-mences immediately after birth during the infant’s stay at the neonatal unit. The second phase also takes place within the hospital when mother and NB share the same ward and experience the process of care, learning and maternal breastfeeding more intensely. The third phase involves out-patient follow-up after hospital discharge when the NB has met the pre-requisites of clinical and nutritional stability, having reached greater physiological maturity (Brasil
2013; WHO2012).
Prematurity is considered one of the leading causes of perinatal mortality (Goldenberg and McClure 2015), and the KM can significantly reduce mortality in preterm and low birthweight NBs, lowering mortality rates during infancy and promoting the practice of exclusive maternal breastfeeding (WHO2012). The KM also plays a key role in reducing cases of hypothermia and sepsis and in short-ening hospital stays (Conde-Agudelo and Beliza´n2011). In addition, the method improves growth as well as motor and mental development compared to conventional care (Bera et al.2014).
Anthropometry is typically used for assessing growth of preterm NB, with weight being the most commonly employed measure. Weight-gain velocity (g/kg/day) is widely used for monitoring weight gain (Senterre and Rigo
2012; Olusanya and Renner 2011; Fenton et al.2013) and is useful for assessing nutritional adequacy over a given time period (Cardoso-Demartini et al. 2013). Thus, this reference parameter helps diagnose growth deficits, allowing changes in the nutritional and health status of NB to be identified (Jones et al.2013; Tudehope et al.2012). Preterm NBs are at higher risk of fetal growth restriction and post-natal growth deficits, which may be associated with subsequent adverse outcomes in neurodevelopment (Tudehope et al.2012). However, despite the importance of awareness of the growth process, its monitoring is often neglected during the hospital stay, a period which may be
lengthy in preterm NB (Sassa´ et al. 2011; Anchieta et al.
2004a).
Few studies assessing weight-gain velocity using the Kangaroo Method are available (Lamy Filho et al. 2008; Freitas and Camargo2007), while those analyzing the three phases are even scarcer (Penalva and Schwartzman2006). Against this background, the objective of the present study was to analyze the association between weight-gain velocity during the three phases of the Kangaroo Method and maternal and NBs variables.
Methods
A nested cross-sectional study (Medronho 2009) in a cohort of preterm and low birthweight NBs managed by the KM was performed at the Assis Chateaubriand Maternity-school of the Federal University of Ceara´, situated in Fortaleza, Ceara´, Brazil. The school is a reference center in gynecology, obstetrics and neonatology, and is a Human Milk Bank, constituting one of the first centers for KM training in Brazil (Brasil2013). The KM is not the standard of care in the hospital. The Unit of Intermediate Kangaroo Care—UCINCa, where the second and third stages of the method are conducted, has five beds, and the mothers and respective NBs are selected according to specific criteria, established by the method, also respecting the availability of the mothers.
Participants
The study population comprised all preterm and low birthweight NBs and their respective mothers undertaking all three phases of the KM, giving a total of 78 NB and 70 mothers, since eight deliveries involved twins.
Inclusion criteria were low birthweight (LBW) infants (birthweight\2500 g) and preterm (gestational age at birth \37 semanas) who were in the third phase of the KM and
accompanied by the mother. That is, the mothers and their newborns were addressed in the third stage of the method. The study was approved by the Research Ethics Com-mittee of the State University of Ceara´, Brazil and all women gave informed written consent.
Data Collection Procedure
dependent variable. The independent maternal variables were: age, schooling and parity. The NB variables were: gestational age at birth, birthweight, classification of weight for gestational age at birth, Apgar score, and duration of each stage in days.
Regarding to maternal age, the WHO classification (WHO2006) was used, according to which adolescents are defined as individualsC10 and\20 years of age. Thus, the
participating mothers were classified as either ‘‘adoles-cent’’ when aged \20 years or ‘‘non-adolescent’’ when
agedC20 years.
In the present study, NB were stratified into two cate-gories: moderate pre-term (32 to\37 weeks) and very
preterm (\32 weeks), based on WHO recommendations
(WHO2012).
For birthweight, given that all NB had low birthweight (\2500 g), the classifications of low weight (C1500 g) and
very low weight (\1500 g) were used in this study, also
based on WHO recommendations (WHO2010).
For classification of NB according to weight for gesta-tional age at birth, the intrauterine growth curve of Fenton and Kim (2013) was used, specific for preterm infants and differentiated for sex. NBs were therefore distributed into three categories: small for gestational age—SGA (\10th
percentile), large for gestational age—LGA ([90th
per-centile) or appropriate for gestational age—AGA (between 10th and 90th percentiles).
Apgar scores at birth were classified according to the cut-off pointsB7 and[7 (AAP et al.2006).
For the analysis of the length of hospital stay variable, corresponding to the time in days for phases 1 and 2 of the KM, cut-off points were established based on the mean of the normal distribution for this variable, with two cate-gories defined: 3 to 17 days and 17.5 to 50.5 days.
Weight-gain velocity was assessed in g/kg/day, according to the formula used in the studies of Fenton et al. (2013) and Senterre and Rigo (2012):
Final weight gð Þ Initial weight gð Þ
Mean weight kgð Þ
Number of days
This rate was applied to all NBs at each phase of the method (first, second and third) in order to classify weight-gain velocity into adequate or inadequate. Adequate weight-gain was considered an average daily gain of
C15 g/kg/day whereas inadequate was\15 g/kg/d, based
on the recommendation of Jones et al. (2013) who estab-lished a parameter of 15–20 g/kg/day.
The weight measurements of NB were taken within the maternity unit routinely at birth and daily thereafter throughout the hospital stay. In the third phase, weight measurements were taken at each visit.
Data Analysis
Data were analyzed using simple frequencies and per-centage for the categorical variables and as mean and standard deviation for quantitative variables, for both mother and NB. Epidemiological measurements of odds ratio and confidence interval (95 % CI) were also calculated.
Associations and correlations of maternal variables and NB variables with weight-gain velocity were analyzed for the three phases of the KM, using odds ratios, and applying Fisher´s exact test and McNemar´s test to determine the dependence of weight-gain velocity of one phase on another. Spearman´s correlation coefficient (rs) was used for continuous variables. Comparisons of measures of central tendency for weight-gain velocity at each phase of the KM were calculated using Friedman´s test, followed by Con-over´s test.
Multivariate linear regression was performed (Y=a ? b1?b2?b3?b4?b5?b6?b7?ei), using as
out-come variable weight-gain velocity during phase 3 of the KM. As independent variables related to the mother, we used: age, education, parity, and related to NB: Apgar, gestational age, weight in phase 3 and length of phase 3. The model used was the ‘‘backward’’. We used the phase 3 of the KM for this analysis because at this stage the infant is out of the hospital, in stable clinical conditions, which enable better environment for the investigation of the influence of the independent variables selected.
For all statistical analysis, apvalue\0.05 was considered
statistically significant. Data were processed using the sta-tistical package SPSS version 20 (license no 10101131007).
Results
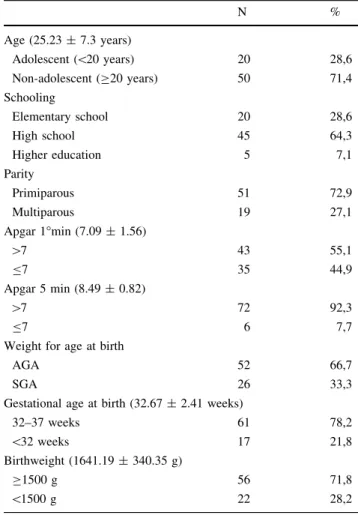
The mean age of mothers was 25.23 ±7.3 years, 28.6 % (n =20) of whom were adolescents. Most mothers had studied to middle school level (64.3 %, n=45) and were primiparous (72.9 %, n =51) (Table1).
Most of the NBs were classified as AGA (66.7 %; n =52), were moderate preterm (78.2 %; n=61) and weighed C1500 g (71.8 %; n=56). 55.1 % (n=43) of NBs attained an Apgar score[7 at 1 min and 92.3 %
(n =72) at 5 min (Table1).
Mean overall duration of the KM was 51.81±20.74 days, with mean duration of the first phase of 19.74±19 days, second phase of 9.83±5.92 days and third phase of 22.05±10.8 days.
0.12±11.11 g/kg/day, second phase of 7.62±6.24 g/ kg/day and third phase growth of 13.47±4.84 g/kg/day in the third phase, with a statistically significant difference between mean gains (p\0.001).
It was observed that the percentage of NB with weight-gain rate classified as adequate increased from 6.4 % in the first stage to 44.9 % in the third stage (Table2).
Weight-gain velocity in phase 1 was inversely correlated with gestational age at birth (r= -0.550;p\0.001) and
with birthweight (r= - 0.792;p\0.001) (Table3).
In phase 2, weight-gain velocity was inversely corre-lated with Apgar score at 5 min (r= -0.227;p=0.046) and with birthweight (r= -0.243;p =0.032) (Table3). In phase 3, weight-gain velocity was proportionally inversely correlated with length of hospital stay in phase 1 (r= - 0.291; p=0.010) and was directly proportional with maternal age (r=0.293;p=0.009), Apgar score at 5 min (r=0.243;p=0.032), and with gestational age at birth (r=0.279;p =0.013) (Table3).
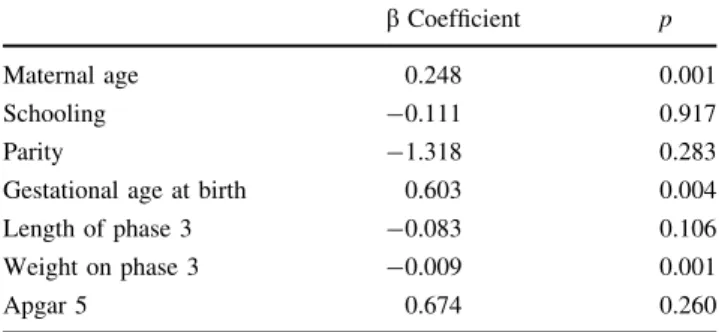
Multivariate regression analysis showed that the NBs weight-gain velocity on phase 3 of the KM was directly
proportional influenced by maternal age (b coeffi-cient=0.248, p =0.001) and gestational age at birth (b
coefficient =0.603, p=0.004), and inversely propor-tional by weight on phase 3 (b coefficient=0.009,
p =0.001) (Table4).
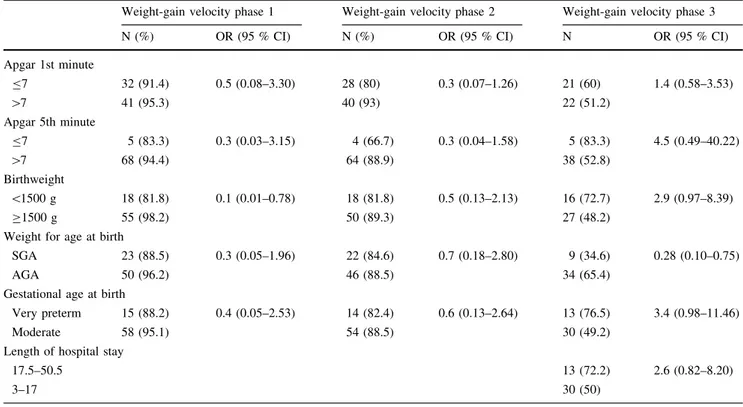
In the first phase of the KM, a birthweight \1500 g
reduced the likelihood of the NB having inadequate weight-gain velocity during phase 1 (OR=0.1; 95 % CI 0.01–0.8;p=0.012) (Table5).
Classification of the NB as SGA proved a protective factor for likelihood of the NB having inadequate weight-gain velocity in phase 3 (OR 0.28; 95 % CI 0.10–0.75,
p =0.010) (Table5).
Discussion
Weight-gain velocity during the KM behaved differently during each of the phases and exhibited rising values during the course of the phases. This fact is important in alerting health teams to the factors which may influence the growth on each phase, guiding the conduct for contribu-tions to a more adequate growth.
In the first phase, mean weight-gain velocity was below the recommended rate (0.12±11.12 g/kg/day) and only approached adequacy (13.47±4.84 g/kg/day) during the third phase. Penalva and Schwartzman (2006) found neg-ative weight gain (-8 g/day) during the ICU stay in the first phase of KM. It is reported in previous studies that most NBs, especially preterm NBs, experience up to 20 % weight loss during the first week of life, a phenomenon which depends on the maturity, birthweight and presence of clinical complications, which can cause metabolic stress and catabolism. Return to the initial birthweight and sub-sequent steady expected gain of 15 g/kg/day only occurs after 10–20 days of life, with a tendency for faster increase in this weight under adequate clinical and nutritional conditions (Fenton et al. 2013; Cardoso-Demartini et al.
2013; Freitas and Camargo2007).
Table 1 Characteristics of mothers and newborns participants of the Kangaroo Method, Fortaleza 2014
N %
Age (25.23±7.3 years)
Adolescent (\20 years) 20 28,6
Non-adolescent (C20 years) 50 71,4
Schooling
Elementary school 20 28,6
High school 45 64,3
Higher education 5 7,1
Parity
Primiparous 51 72,9
Multiparous 19 27,1
Apgar 1°min (7.09±1.56)
[7 43 55,1
B7 35 44,9
Apgar 5 min (8.49±0.82)
[7 72 92,3
B7 6 7,7
Weight for age at birth
AGA 52 66,7
SGA 26 33,3
Gestational age at birth (32.67±2.41 weeks)
32–37 weeks 61 78,2
\32 weeks 17 21,8
Birthweight (1641.19±340.35 g)
C1500 g 56 71,8
\1500 g 22 28,2
Table 2 Adequacy of weight gain velocity in Kagaroo method, Fortaleza 2014
N %
1st Stage
Adequate 5 6,4
Inadequate 73 93,6
2nd Stage
Adequate 10 12,8
Inadequate 68 87,2
3rd Stage
Adequate 35 44,9
During the second phase of the KM, although the NB remains hospitalized, improved growth velocity patterns were found in the present cohort (7.62±6.24 g/kg/day), since the NB is adapting to the stressed conditions expe-rienced during the ICU stay in the first phase and begins to have more contact with the mother, receiving greater stimulus (Freitas and Camargo2007).
Freitas and Camargo (2007) found a weight-gain velocity in the 1st stage of 9 g/Kg/day and in the 2nd stage of 13.2 g/Kg/day. Lamy Filho et al. (2008) found the same rate during the 2nd stage.
Anchieta et al. (2004b) studied preterm NB AGA not involved in the KM and found weight-gain velocity values ranging from 11.5 to 18 g/kg/day, higher the lower the birthweight and showing reduction over lifetime. Senterre and Rigo (2012) found over a period of 3 to 42 days of life, weight-gain velocity rate of 15.4 and 16.0 g/kg/day in extreme premature NB and very premature NB, respectively.
In the present study, the closest value to the adequate minimum stipulated by Jones et al. (2013) (15 g/kg/day) was only attained in the third phase of the method, when NBs showed a mean gain of 13.47±4.84 g/kg/day. A
gradual increase in the percentage adequate velocity was observed from phases 1 and 2 (hospital stay) to phase 3. The third phase took place outside the hospital setting, during which the infant was in a less critical setting, remaining in direct contact with the mother and the whole family.
With regard to associations and correlations of weight-gain velocity at each phase of the KM with maternal and NB variables, the results of phases 1 and 2 indicated that the lower the birthweight, the greater the weight-gain velocity. In addition, during the first phase of the KM, the likelihood of the NB having adequate weight-gain velocity was greater in NBs with birthweight\1500 g. According
to Olusanya and Renner (2011), greater velocity is strongly associated with low birthweight and IUGR, being indica-tive of the ‘‘catch-up’’ phase of growth. It was observed that in phase 3 of the method, where NB weighting less continued to show a higher weight-gain velocity than those with higher weight.
Sassa´ et al. (2011) observed an association between lower-than-expected weight gain and birthweightC2500 g and the non-occurrence of associated low weight and pre-maturity. The authors hypothesized, based on this finding, that prematurity and low weight have a positive effect on weight increase. This raises the possibility, according to the autors, that these NBs are submitted, owing to their clinical condition and maturity, to intensive and frequent care by the clinical team in a hospital setting, allowing early detection and intervention in the event of anomalies.
Anchieta et al. (2004b), observing preterm AGA NBs, found that infants with lower birthweight had higher weight-gain velocity than those with high birthweight, with the former tending to catch-up with the latter, revealing the ability to recover from the growth deficit. The authors observed faster growth rate in the first 4 weeks of life when NB growth velocity peaks, after which a normal rate of growth is maintained. From the sixth week, a tendency for slowing of growth rates was observed.
Table 3 Analysis of correlation of weight-gain velocity with maternal and newborns variables in the Kangaroo method, Fortaleza 2014
Weight-gain velocity phase 1 Weight-gain velocity phase 2 Weight-gain velocity phase 3
p RS p RS p RS
Maternal age 0.167 0.158 0.536 0.071 0.009 0.293
APGAR 1 0.095 -0.190 0.118 -0.178 0.282 0.123
APGAR 5 0.241 -0.134 0.046 -0.227 0.032 0.243
Gestational age at birth 0.000 -0.550 0.333 -0.111 0.013 0.279
Birthweight 0.000 -0.792 0.032 -0.243 0.492 0.079
Length of hospital stay phase 1 0.010 -0.291
Length of hospital stay phase 2 0.086 -0.195
Table 4 Multivariate regression analysis of weight-gain velocity according to maternal and newborns characteristics, Fortaleza 2014
bCoefficient p
Maternal age 0.248 0.001
Schooling -0.111 0.917
Parity -1.318 0.283
Gestational age at birth 0.603 0.004
Length of phase 3 -0.083 0.106
Weight on phase 3 -0.009 0.001
Apgar 5 0.674 0.260
In the present study, gestational age at birth showed a significant proportional inverse correlation with weight-gain velocity in phase 1. Akin to the variable birthweight, it is evident that under stress conditions such as low birth-weight or preterm birth, together with clinical complica-tions resulting from physiological immaturity, increased weight-gain velocity may reflect a compensation mecha-nism to make up for the growth deficit, constituting a catch-up phase (Olusanya and Renner2011; Anchieta et al.
2004b).
A proportional inverse correlation was also found between Apgar score at 5 min and growth velocity in phase 2 of the KM. Penalva and Schwartzman (2006) observed that lower birthweight was associated with poorer Apgar scores at first and fifth minutes.
Unlike in phase 1, during phase 3 of the KM, after hospital discharge, a significant directly proportional cor-relation was found between gestational age at birth and weight-gain velocity. It was also found that gestational age influenced in direct proportion weight-gain velocity in phase 3 of KM. At this juncture, NBs have better clinical and nutritional condition, which are prerequisites to advance to the 3rd phase (Brasil2013), and are no longer exposed to the stressors of the previous phases, including physiological immaturity, clinical complications, distance from the mother.
Also, a directly proportional correlation of Apgar at the fifth minute with growth velocity in phase 3 was observed. According to Penalva and Schwartzman (2006), birth-weight, gestational age and Apgar scores are determinants for better clinical, nutritional and motor evolution of pre-term NBs managed with KM.
With regard to weight for gestational age, a different pattern was found in which NBs classified as SGA at birth had a greater likelihood of having adequate weight in the third phase of the KM. According to Anchieta et al. (2004a), SGA NBs tend to lose less weight and recover more rapidly than AGA NBs, and also have larger head circumference measurements.
Growth velocity in phase three was proportionally inversely correlated with length of hospital stay in phase 1, during which the NB is more susceptible to clinical com-plications. Longer hospital stay may impact NB develop-ment, and therefore the shortest hospital stay possible is desirable, where the KM serves as a strategy to achieve this (Freitas and Camargo 2007).
Also in phase 3, weight-gain velocity was directly cor-related with maternal age and was influenced in direct proportion by this variable. During this phase of the KM, mothers are at home caring for their children on their own or with the help of relatives, returning to hospital only for regular scheduled visits until the infant reaches 2500 g.
Table 5 Newborns variables according to inadequate weight-gain velocity at each phase of the Kangaroo method, Fortaleza 2014
Weight-gain velocity phase 1 Weight-gain velocity phase 2 Weight-gain velocity phase 3
N (%) OR (95 % CI) N (%) OR (95 % CI) N OR (95 % CI)
Apgar 1st minute
B7 32 (91.4) 0.5 (0.08–3.30) 28 (80) 0.3 (0.07–1.26) 21 (60) 1.4 (0.58–3.53)
[7 41 (95.3) 40 (93) 22 (51.2)
Apgar 5th minute
B7 5 (83.3) 0.3 (0.03–3.15) 4 (66.7) 0.3 (0.04–1.58) 5 (83.3) 4.5 (0.49–40.22)
[7 68 (94.4) 64 (88.9) 38 (52.8)
Birthweight
\1500 g 18 (81.8) 0.1 (0.01–0.78) 18 (81.8) 0.5 (0.13–2.13) 16 (72.7) 2.9 (0.97–8.39)
C1500 g 55 (98.2) 50 (89.3) 27 (48.2)
Weight for age at birth
SGA 23 (88.5) 0.3 (0.05–1.96) 22 (84.6) 0.7 (0.18–2.80) 9 (34.6) 0.28 (0.10–0.75)
AGA 50 (96.2) 46 (88.5) 34 (65.4)
Gestational age at birth
Very preterm 15 (88.2) 0.4 (0.05–2.53) 14 (82.4) 0.6 (0.13–2.64) 13 (76.5) 3.4 (0.98–11.46)
Moderate 58 (95.1) 54 (88.5) 30 (49.2)
Length of hospital stay
17.5–50.5 13 (72.2) 2.6 (0.82–8.20)
3–17 30 (50)
Data reveals that pregnant adolescents tend to come from low-income households and have nutritional deficiency, being more likely to give birth to preterm and low weight babies that do not survive the first year of life (UNFPA
2013). In the study by Lakew and Worku (2014), following 110 NBs managed with KM, observed 100 % mortality among the four NB offspring of mothers aged under 18 years in the sample.
The present study had several limitations, such as the small sample size and absence of analysis of the influence of clinical variables and of nutritional status in terms of energy-protein intake. One of the factors contributing to the low number of NBs was the specificity of the sample, number of beds at the UCINCa (only five), and also the fact that the unit had been closed immediately prior to data collection, initially reducing the number of returners for the third phase.
Nonetheless, it is important to emphasize that the study involved NB who took part in a 3-phase treatment model not available in all city´s hospitals, rendering the group special and conferring greater relevance to the study.
Conclusions for Practice
The weight-gain velocity of newborn infants managed by the KM showed a higher percentage of adequacy in phase 3 than in phases 1 and 2. There was an inversely proportional correlation of weight-gain velocity with gestational age at birth and birthweight in phase 1; with Apgar score at 5 min and birthweight in phase 2; and with length of hospital stay in phase 3. Weight-gain velocity was also proportionally directly correlated with maternal age, Apgar at 5 min and gestational age at birth in phase 3. Being born SGA was found to be a protective factor against inadequate weight-gain velocity in phase 3. A birthweight of under 1500 g reduced the likelihood of the NB having inadequate weight-gain velocity in phase 1.
Knowledge of the factors influencing weight-gain velocity, and how this behaves at each phase of the method, can help guide conduct toward reducing the negative influences and potentializing factors that promote adequate weight-gain.
Acknowledgments We would like to thank the Assis Chateaubriand Maternity-School for providing the venue to conduct the study. We also thank the Conselho Nacional de Desenvolvimento Cientı´fico e Tecnolo´gico—CNPq, Edital Universal 14/2013—processo 484077/2013-9 (National Council for Scientific and Technological Development—Universal Notice 14/2013—Process: 484077/2013-9) and Fundac¸a˜o Cearense de Apoio ao Desenvolvimento Cientı´fico e Tecnolo´gico—FUNCAP (Foundation for the financial Support of Scientific and Technological Development from State of Ceara´), for the financial support given to this project.
Compliance with Ethical Standards
Conflict of interests The authors declare that they have no conflict of interests.
References
American Academy of Pediatrics, Committee on Fetus and Newborn, American College of Obstetricians and Gynecologists and Committee on Obstetric Practice. (2006). The Apgar score.
Pediatrics, 117, 1444–1447.
Anchieta, L.M., Xavier, C.C., Colosimo, E.A. (2004a). Growth of preterm newborns during the first 12 weeks of life. Jornal de
Pediatria, 80(4), 267–276.http://www.scielo.br/scielo.php?pid=
S0021-75572004000500005&script=sci_arttext. Accessed 30 Oct 2014.
Anchieta, L.M., Xavier, C.C., Colosimo, E.A. (2004b). Growth velocity of preterm appropriate for gestational age newborns.
Jornal de Pediatria, 80(5), 417–424. http://www.scielo.br/pdf/
jped/v80n5/v80n5a14.pdf. Acessed 12 Nov 2014.
Bera, A., Ghosh, J., Singh, A.K., Hazra, A., Mukherjee, S., Mukherjee, R. (2014). Effect of kangaroo mother care on growth and development of low birthweight babies up to 12 months of age: a controlled clinical trial.Acta Pædiatrica, 103,643–650. http://onlinelibrary.wiley.com/doi/10.1111/apa.12618/abstract;j sessionid=416B8BBC1A73E7119E5BEF3301CBBC4F.f01t02. Accessed 12 Nov 2014.
Brasil. Ministe´rio da Sau´de. Secretaria de Atenc¸a˜o a` Sau´de. Departamento de Ac¸o˜es Programa´ticas e Estrate´gicas. (2013).
Humanized care low birth weight: Kangaroo method: Technical
manual.2nd ed. 1a reimpr. Brası´lia: Editora do Ministe´rio da
Sau´de. http://bvsms.saude.gov.br/bvs/publicacoes/atencao_sau de_recem_nascido_profissionais_v4.pdf. Accessed 12 Nov 2014. Cardoso-Demartini, A.A., Bagatin, A.C., Silva, R.P.G.V.C., Bogus-zewski, M.C.S. (2013). Growth of preterm-born children.
Arquivos Brasileiros de Endocrinologia and Metabologia, 55(8), 534–540. http://www.scielo.br/scielo.php?script=sci_art text&pid=S0004-27302011000800006. Accessed 22 Sept 2013. Conde-Agudelo, A., Beliza´n, J.M., Diaz-Rossello J. (2011). Kangaroo mother care to reduce morbidity and mortality in low birthweight infants (Review).The Cochrane Library, 3rd ed.http://apps.who. int/rhl/reviews/CD002771.pdf. Accessed 20 Sept 2013. Fenton, T.R., Kim, J.H. (2013). A systematic review and
meta-analysis to revise the Fenton growth chart for preterm infants.
BMC Pediatrics, 13(59), 1–13.http://www.biomedcentral.com/
content/pdf/1471-2431-13-59.pdf. Accessed 20 Sept 2013. Fenton, T.R., Nasser, R., Eliasziw, M., Kim, J.H., Bilan, D., Sauve, R.
(2013). Validating the weight gain of preterm infants between the reference growth curve of the fetus and the term infant.BMC
Pediatrics, 13(92), 1–10. http://www.biomedcentral.com/con
tent/pdf/1471-2431-13-92.pdf. Accessed 20 Sept 2013. Freitas, J.O., Camargo, C.L. (2007). Kangaroo Mother Method:
newborn weight outcome.Acta Paulista de Enfermagem, 20(1), 75–81. http://www.scielo.br/scielo.php?pid=S0103-210020070 00100013&script=sci_arttext. Accessed 12 Nov 2014.
Goldenberg, R.L., McClure, E.M. (2015). Maternal, fetal and neonatal mortality: Lessons learned from historical changes in high income countries and their potential application to low-income countries.Maternal Health, Neonatology, and
Perina-tology, 1, 1–10. http://www.mhnpjournal.com/content/pdf/
s40748-014-0004-z.pdf. Accessed 22 Feb 2015.
Jones, E., Bell, S., Shankar, S. (2013). Managing slow growth in preterm infants fed on human Milk. Journal of Neonatal
com/article/S1355-1841(13)00066-5/pdf. Accessed 12 Nov 2014.
Lakew, W., Worku, B. (2014). Follow-up profile and outcome of preterms managed with kangaroo mother care.Open Journal of
Pediatrics, 4, 143–147.http://www.scirp.org/journal/PaperInfor
mation.aspx?PaperID=46142#.VOOdsfnF_w4. Accessed 12 Nov 2014.
Lamy Filho, F., Silva, A.A.M., Lamy, Z.C., Gomes, M.A.S.M., Moreira, M.E.L., Grupo de Avaliac¸a˜o do Me´todo Canguru, Rede Brasileira de Pesquisas Neonatais. (2008). Evaluation of the neonatal outcomes of the kangaroo mother method in Brazil.
Jornal de Pediatria, 84(5), 428–435. http://www.scielo.br/pdf/
jped/v84n5/v84n5a09.pdf. Accessed 21 Sept 2013.
Medronho, R.A. (2009). Epidemiologia. 2nd ed. Sa˜o Paulo: Ed. Atheneu.
Olusanya, B.O., Renner, J.K. (2011). Predictors of growth velocity in early infancy in a resource-poor setting.Early Human
Develop-ment, 87, 647–652. http://www.sciencedirect.com/science/arti
cle/pii/S037837821100185X. Accessed 30 Oct 2014.
Penalva, O., Schwartzman, J.S. (2006). Descriptive study of the clinical and nutritional profile and follow-up of premature babies in a Kangaroo Mother Care Program.Jornal de Pediatria, 82(1), 33–39. http://www.scielo.br/pdf/jped/v82n1/v82n1a08.pdf. Accessed 12 Nov 2014.
Rodgers, C. (2013). Why Kangaroo mother care should be standard for all newborns. Journal of midwifery and women’s health, 58(3), 249-252. http://onlinelibrary.wiley.com/doi/10.1111/ jmwh.12010/epdf. Accessed 30 Oct 2014.
Sassa´, A.H., Higarashi, I.H., Bercini, L.O., Arruda, D.C., Marcon, S.S. (2011). At-risk infants: monitoring children’s growth in the
first year of life.Acta Paulista de Enfermagem, 24(4), 541–549. http://www.scielo.br/pdf/ape/v24n4/a15v24n4.pdf. Accessed 20 Sept 2013.
Senterre, T., Rigo, J. (2012). Reduction in postnatal cumulative nutritional deficit and improvement of growth in extremely preterm infants.Acta Pædiatrica, 101, 64–70.http://www.ncbi. nlm.nih.gov/pubmed/21854447. Accessed 18 Dec 2014. Tudehope, D., Gibbons, K., Cormack, B., Bloomfield, F. (2012).
Growth monitoring of low birthweight infants: What references to use?Journal of Paediatrics and Child Health, 48, 759–767. http://www.ncbi.nlm.nih.gov/pubmed/22970670. Accessed 12 Nov 2014.
United Nations Population Fund—UNFPA. (2013). The State of
World Population 2013. Motherhood in Childhood: Facing the
challenge of adolescent pregnancy. UNFPA.http://www.unfpa. org/sites/default/files/pub-pdf/EN-SWOP2013-final.pdf. Acces-sed 5 May 2014.
World Health Organization—WHO. (2006). WHO child growth standards: Length/height-for-age, age, weight-for-length, weight-for-height and body mass index-for-age. Methods
and development. WHO (nonserial publication). Geneva: WHO.
World Health Organization—WHO. (2010).International statistical
classification of diseases and related health problems.
Instruc-tion Manual. v. 2. WHO.http://www.who.int/classifications/icd/ ICD10Volume2_en_2010.pdf. Accessed 10 Sept 2013. World Health Organization—WHO. (2012). Born too soon: The