Liliam Pereira de LimaI Julio da Motta SingerII Paulo Hilário do Nascimento SaldivaIII
I Logx Assessoria Financeira e Estatística. São Paulo, SP, Brasil
II Instituto de Matemática e Estatística. Universidade de São Paulo (USP). São Paulo, SP, Brasil
III Faculdade de Medicina. USP. São Paulo, SP, Brasil
Correspondence: Liliam Pereira de Lima R. Carlos Weber, 457 05303-000 São Paulo, SP, Brasil E-mail: [email protected] Received: 11/27/2007 Approved: 1/2/2008
Spatial analysis of urban
violence based on emergency
room data
Análise espacial da violência urbana
baseada em dados de pronto-socorro
ABSTRACT
OBJECTIVE: To estimate the spatial intensity of urban violence events using wavelet-based methods and emergency room data.
METHODS: Information on victims attended at the emergency room of a public hospital in the city of São Paulo, Southeastern Brazil, from January 1, 2002 to January 11, 2003 were obtained from hospital records. The spatial distribution of 3,540 events was recorded and a uniform random procedure was used to allocate records with incomplete addresses. Point processes and wavelet analysis technique were used to estimate the spatial intensity, defi ned as the expected number of events by unit area.
RESULTS: Of all georeferenced points, 59% were accidents and 40% were assaults. There is a non-homogeneous spatial distribution of the events with high concentration in two districts and three large avenues in the southern area of the city of São Paulo.
CONCLUSIONS: Hospital records combined with methodological tools to estimate intensity of events are useful to study urban violence. The wavelet analysis is useful in the computation of the expected number of events and their respective confi dence bands for any sub-region and, consequently, in the specifi cation of risk estimates that could be used in decision-making processes for public policies.
Urban violence is a public health problem associated to factors such as sex, age, socioeconomic conditions and cultural characteristics.4 Identifying and quantify-ing seasonal and spatial patterns of violence events is essential for better understanding its causes, and could provide input for the development of interventions and prevention policies to reduce health costs.
Most studies of external causesa that consider spatial analysis use lattice data, i.e., summary statistics aggre-gated by geographical areas. This data can be obtained from the Instituto Brasileiro de Geografi a e Estatística
(Brazilian Institute of Geography and Statistics, IBGE); Secretaria de Segurança Pública do Estado
de São Paulo (Public Safety Department of the state
of São Paulo) in the state of São Paulo; and Programa de Aprimoramento das Informações de Mortalidade
no Município de São Paulo (Mortality Information
RESUMO
OBJETIVO: Estimar a intensidade espacial de eventos violentos utilizando metodologia estatística baseada em ondaletas (wavelets) e em dados de pronto-socorro.
MÉTODOS: Foram analisados dados referentes a vítimas de causas externas atendidas em pronto-socorro municipal localizado na zona Sul da cidade de São Paulo (SP) no período de 1/1/2002 a 11/1/2003. As informações foram obtidas a partir dos registros hospitalares. As 3.540 ocorrências foram localizadas geografi camente e os casos com endereço incompleto foram alocados com base numa escolha aleatória uniforme. Processos pontuais e técnicas de ondaletas foram utilizados para estimar a intensidade espacial, defi nida como o número esperado de eventos por unidade de área.
RESULTADOS: Do total de ocorrências georreferenciadas, 59% foram acidentes e 40% agressões. A intensidade estimada indica que a distribuição espacial dos eventos não é homogênea, concentrando-se em dois distritos e três grandes avenidas localizados na zona Sul da cidade de São Paulo.
CONCLUSÕES: A utilização de ondaletas permite obter o número esperado de eventos e respectiva banda de confi ança para quaisquer sub-regiões e, conseqüentemente, calcular estimativas dos riscos de ocorrência dos eventos de interesse, fornecendo subsídios para a definição de políticas para o enfrentamento da violência urbana. Dados hospitalares combinados com a metodologia para estimação da intensidade de ocorrência provaram-se úteis para estudar a violência urbana.
DESCRITORES: Violência. Zonas Urbanas. Registros Médicos. Sistemas de Informação Geográfi ca. Métodos e Procedimentos Estatísticos. Intensidade de processos pontuais.
INTRODUCTION
a According to the International Classifi cation of Diseases, Tenth Revision, external causes comprise deaths or injuries resulting from intentional injuries and poisoning (homicides and suicides) and unintentional (transport, occupational accidents and others) causes. b De Miranda JCS. Sobre a estimação da intensidade dos processos pontuais via ondaletas [doctorate thesis]. São Paulo: Instituto de Matemática e Estatística da Universidade de São Paulo; 2003.
c De Miranda JCS, Morettin PA. Estimation of the density of point processes on Rm via wavelets. São Paulo: IME-USP; 2005. (RT-MAT-NS; 2005-09).
Enhancement Program of the city of São Paulo, PRO-AIM) in the city of São Paulo. They all provide data of external causes mortality based on police reports. Hospital records also constitute an excellent source of information on urban violence and provide details to allow an evaluation of spatial and temporal distribu-tions of such events, but their potential is still not fully explored. Moreover, emergency room data provide case event data for which location information is known for each individual.1,5 Case event data include detailed information and, in contrast with lattice data, are not subjected to the ecological fallacy.1,3
data, especially with respect to spatial or time-spatial distribution, for research and practical applications. It is also presented an allocation method for data georef-erencing with incomplete address information.
METHODS
The data set comprised information on victims attended in the emergency room of a public hospitalof the city of São Paulo, Southeastern Brazil, from January 1, 2002 to January 11, 2003. Data was provided by the
Núcleo de Atenção à Vítima de Violência (Violence
Victim Care Center, NAVV), a research group cre-ated in 2001 with the purpose of identifying potential violence causes and proposing actions for violence prevention. The hospital’s front desk staff was trained to identify injured victims (by traffi c accidents, falls, suicides, drowning, injuries caused by fi rearm, sharp or blunt objects, poisonings, burns and others) and to register the events in an appropriate fi le. This fi le includes personal information about the victim, home conditions, place and time where the event occurred, description of the event, how the victim arrived at the hospital (alone, brought by policemen, relatives, and others), psychological evaluation as well as signs of battered child syndrome, violence against women and violence against the elderly. The fi le also includes information about hospital discharge conditions and referral provided by NAVV. In the study period, 7,073 events were registered, of which 5,053 occurred within the boundaries of the city of São Paulo.
Each event was classifi ed according to its description and reason for emergency room visit. This procedure was manually conducted due to lack of standardization of reference variables. First, each event was indepen-dently classifi ed by two or three observers and then results were compared and inconsistent cases were discussed and classifi ed in a consensual way. The fol-lowing categories were considered:
• accidents: occupational accident; run-over ac-cident; motorcycle rider acac-cident; other transport accidents; accidental poisoning; animal bite; fall; other accidents;
• assaults: self-harm assault; sexual assault; assault by fi rearm, sharp or blunt objects; other assaults; • legal interventions: events where the victim was
brought to the hospital by policemen and that could not be classifi ed into any of the previous sub-items;
• events of undetermined intent: events that could not be classifi ed due to incomplete or incorrect information.
A fundamental step of spatial analysis is data georefer-encing, i.e., to associate events to points on the Earth's surface by means of the latitude and longitude of the sites where they occurred.
The location of events was georeferenced using the Mapinfo Professional software,version 7.0, based on a map where streets are subdivided into segments. Each segment corresponds to locations situated between two successive corners. The program’s automatic allocation procedure associates each event with the geographic coordinate of the centroid of the segment related to the address where the event occurred. This allocation procedure cannot be properly carried out when there is missing address information.An event is considered to have a complete address if it has both the street name and number of the location where it occurred. All events with street information but no numbers are assigned to the fi rst segment of the street (or, alternatively, the last one) or disregarded. This allocation mechanism for incomplete addresses may introduce information bias, which could be reduced by using an alternative random uniform choice procedure. This procedure is based on the following steps: i) the events are coded 0-3 according to the type of infor-mation available about location; ii) a georeferencing criterion for each code is defi ned.
Codes and the criterion are described in Table 1 which also includes the number of events by alloca-tion criterion. Only 2.3% of all 5,053 events studied had complete location information. Two main reasons might justify this small percentage: the data was not recorded with the purpose of being treated using spatial analysis tools and detailed information is usually inac-curately recalled in the case of sudden and traumatic events. There was no address information in 23.5% of the events and they could not be georeferenced. The remaining data (74%) were georeferenced using the random uniform choice procedure. If the usual proce-dure were used, the events classifi ed as code 2 (70%) would be all assigned to the fi rst street segment and those classifi ed as code 3 (4.7%) would be all assigned to the district centroid.
Count data occurring over time or at different points in space are usually modeled by point processes.2 This type of statistical technique is designed to estimate the intensity at which the events occur in fi xed periods of time and areas. The intensity is defi ned as the expected number of events by unit area or over time. The meth-odology proposed by de Mirandaa and de Miranda & Morettinb based on wavelet series expansion method was used to obtain unbiased estimators of the intensity
a De Miranda JCS. Sobre a estimação da intensidade dos processos pontuais via ondaletas [doctorate thesis]. São Paulo: Instituto de Matemática e Estatística da Universidade de São Paulo; 2003.
as well as of its variance. This is an alternative to loess, kernel and spline smoothers, commonly used to obtain an approximation of the intensity.5 A simulation study was conducted to show that the proposed method can generate more accurate results than other related ap-proaches. An additional advantage of this method is the choice of a smoothing parameter; in the kernel and loess methods, this choice is based on a trial and error strat-egy. The proposed methodology includes a threshold procedure for correcting potential overfi tting (in case of very large J1 or J2, as described in the “Estimation of the intensity” subsection).
The proposed methodology can be applied to a vast class of point processes since the required assump-tions are extremely mild. More specifi cally, it is only required that the density exists and is a locally square integrable function. It can also be applied to estimate confi dence bands for the desired intensities and to compare intensities associated to different sub-regions (or time periods). A non-internally correlated (NIC) process, where the covariance among the number of events occurring in any two disjoint regions is null is also required to estimate confi dence bands for the intensity. Point processes as such seem appropriate to model the study data since it is reasonable to consider that events occurring in one region are not related to the occurrence of events in a disjoint region. The existence of neighboring regions with many (or few) occurrences does not imply that the occurrences in these regions are correlated, but rather that these re-gions have certain characteristics that make them more (or less) prone to event occurrence. The methods are detailed in the Appendix.
RESULTS
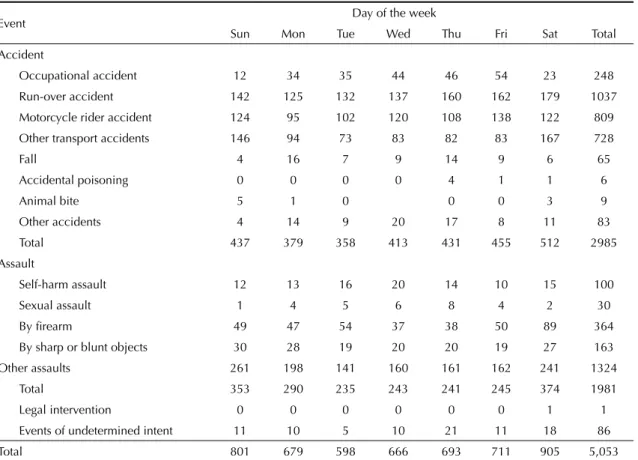
Victims’ age ranged between 0 to 89 years (mean=29.4 years, standard deviation=14.4 years). There was a higher proportion of male victims (68%) but age distributions were similar for both men and women. Of all events, 59% were accidents and 39% were as-saults. Traffi c accidents (run-over accident, motorcycle rider accidents and other transport accidents) were the most frequent, accounting for 86% of all accidents. The majority of assault cases (67%) were classifi ed as “other assaults”. The mean number of events was greater during weekends and lesser on Tuesdays, sug-gesting a possible seasonality. In general, this same pattern is also seen when assault and accident data are analyzed separately. Table 2 shows the number of observed events by type and day of the week. These data suggests varied occurrence of violence events throughout the week. For example, occupational ac-cidents occurred more frequently on Fridays while other accidents and assaults are mainly seen during the weekend.
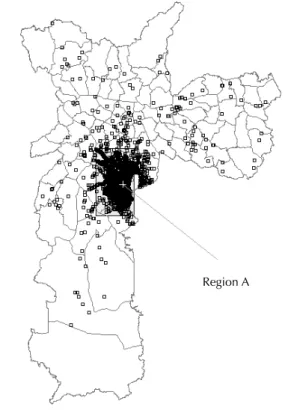
Figure 1 shows the spatial distribution of the 3,865 events georeferenced according to the criterion de-scribed in Table 1. Events were distributed throughout the city and showed higher concentration in the hos-pital vicinity. This is an expected fi nding since rescue services usually move the victims to the closer public hospital where there are vacancies and a medical team available prepared to assist the specifi c type of injury. Also bearing in mind that the hospital studied is a reference trauma center, the pattern depicted in Figure 1 is expected.
Intensity was estimated in a limited region, designated as A, close to the hospital (Figure 1). This region has 83.4 km2 (6.86 km in the East-West direction by 12.15 km in the North-South direction) and includes 3,430 georeferenced points, of which 59% are accidents and 40% assaults. Figure 2 shows the enlarged A region with events superimposed on a street map. It shows a concentration of events around the hospital area and also some clusters of events near main roads, such as Bandeirantes, Jabaquara and Cupecê avenues, in the southern area of the city.
For wavelet analysis, the rectangular region A was sub-divided into elementary (rectangular) regions (ER) with their size given by T1T2/2J1+J2+2, where T1 and T2 are of the width and length measures of region A and J1 and J2 are parameters controlling for estimation precision. The
Region A
greater J1 and J2, the smaller ER size and, consequently, the greater the estimation precision. It was assumed that J1=3 and J2=4 resulting in ER size = 6.86 km × 12.15 km/23+4+2 = 0.163 km2. The choice of elementary regions measuring 0.163 km2 each (379.7 m in the East-West direction by 428.9 m in the North-South direction) seems suitable since, in most cases, it is not expected that locations can be identifi ed at a precision greater than 380 m along street segments.
The minimum and maximum estimated intensities were zero and 376.8 events by km2,respectively (mean=41.8
events by km2). Estimated confi dence bands with at least 75% confi dence coeffi cients (not shown) were applied to identify regions with a signifi cantly different num-ber of events. To facilitate visualization, the estimated intensities were grouped into 10 categories as shown in Figure 3. It shows a non-homogeneous spatial distribu-tion of events. Regions with more than 128 expected events by km2 are mostly in the vicinity of the hospital. Two sequences of elementary regions with more than 32 expected events by km2, located at Bandeirantes and Jabaquara Avenues were also observed.
Table 1. Georeferencing codes and criterion for event allocation. City of São Paulo, Southeastern Brazil, 2002–2003.
Random uniform choice procedure Case
Code Available information Allocation criterion n %
0 No information about event address (missing
street or district) Georeferencing is not feasible 1,188 23.5
1 Complete address (street name and number) Georeferencing using the usual procedure 117 2.3
2 Incomplete address (missing number)
Georeferencing by street segment selected ran-domly among all possible street segments into which the street of occurrence was subdivided.
3,514 69.5
3 Only information about district of occurrence
Georeferencing by street segment selected uniformly among all possible street segments
within the district of occurrence.
234 4.7
Total 5,053 100%
Table 2. Number of events by type and day of the week. City of São Paulo, Southeastern Brazil, 2002–2003.
Event Day of the week
Sun Mon Tue Wed Thu Fri Sat Total
Accident
Occupational accident 12 34 35 44 46 54 23 248
Run-over accident 142 125 132 137 160 162 179 1037
Motorcycle rider accident 124 95 102 120 108 138 122 809
Other transport accidents 146 94 73 83 82 83 167 728
Fall 4 16 7 9 14 9 6 65
Accidental poisoning 0 0 0 0 4 1 1 6
Animal bite 5 1 0 0 0 3 9
Other accidents 4 14 9 20 17 8 11 83
Total 437 379 358 413 431 455 512 2985
Assault
Self-harm assault 12 13 16 20 14 10 15 100
Sexual assault 1 4 5 6 8 4 2 30
By fi rearm 49 47 54 37 38 50 89 364
By sharp or blunt objects 30 28 19 20 20 19 27 163
Other assaults 261 198 141 160 161 162 241 1324
Total 353 290 235 243 241 245 374 1981
Legal intervention 0 0 0 0 0 0 1 1
Events of undetermined intent 11 10 5 10 21 11 18 86
DISCUSSION
Hospital records combined with methodological tools, e.g. wavelet series expansion method, to estimate the intensity are a valuable source of information on urban violence. However, the present study showed that more attention should be given to the quality of hospital re-cords and database with special concern to information about location and time of event occurrence.
The estimated intensity function provides the expected number of events for any subregion and may be used to calculate spatial relative risk estimates that could contribute to decision-making processes for public policies. These risk estimates could be calculated considering many possibilities. For example, Limaa presents spatial relative risks between assault against males versus assault against females and also between transport accident events occurring along different days of the week.
Data from a single hospital is not representative of the spatial distribution of events occurring in other non-neighboring regions. In the present study, intensity was estimated only in a selected area close to the hospital
under investigation (region A). The reasons for the pos-sible underestimation of the intensity are the unknown number of violent events referred to other hospitals and the lack of georeferencing for some events. Yet the purpose of the present study was to illustrate how well wavelet method can be applied in hospital record analysis. Other larger and more carefully designed studies can further the knowledge on urban violence in the city of São Paulo.
Figure 3. Categories of the estimated intensity (number of events by km2). City of São Paulo, Southeastern Brazil,
2002–2003.
Legend Category Number of
elementary regions %
0 to 1 103 20.1
1 to 2 21 4.1
2 to 4 36 7.0
4 to 8 53 10.4
8 to 16 68 13.3
16 to 32 58 11.3
32 to 64 45 8.8
64 to 128 75 14.6
128 to 256 48 9.4
256 or more 5 1.0
Total 512 100
Figure 2. Distribution of events in region A. City of São Paulo, Southeastern Brazil, 2002–2003.
APPENDIX
Wavelets are simple functions, of which linear combinations are used to approximate other more complicated functions. The approximation involves linear combinations of functions (wavelets). The most suitable set of functions for this purpose is the L2 ( ) space, that is, the space of all measurable square inte-grable function on the real line . The basic idea is to consider dilations and translations of one function ψ, called the mother wavelet, and form a set of functions {ψi,j│i, j∈ }obtained from dilations and transla-tions of ψ as:
(A.1) ψi,j (t) = 2j/2ψ (2j t – iT), t∈ , T is a known constant.
The function ψ0,0 is obtained from another function, ψ0 (t), known as the father wavelet. In this study, func-tions of the Haar family were considered for such pur-poses. They are defi ned by (A.1) with ψ0,0 given by
and with the associated father wavelet given by
For practical purposes it is suffi cient to work with wave-lets defi ned on [0,T] ⊂ . In this case, it is convenient to use an orthonormal wavelet base formed by
B= {ψ0 , ψi,j│i, j∈ , j≥ 0,0 ≤i≤ (2j –1)}, where the integer i is associated with location and the inte-ger j with scale. The indices i and j are related to the translation and dilation levels of the mother wavelet, respectively.
Considering a function f that belongs to the L2( ) space with support on [0,T], the wavelet series expan-sion is given by
(A.2)
where αη ∈ and Z represents the set of all indices
{0, (0, 0), (0, 1), (0, 2),...} =
{0, (i,j) │i, j∈ , j≥ 0, 0 ≤i≤ (2j –1)}
in the base B; under this notation, the base can be rep-resented by B = {ψη│η ∈ Z}.
Assuming that N is a point process with unknown den-sity function υ and A is either the geographical region
or the time period under study, the expected number of
events that occur in A is defi ned as . The one-dimensional case (temporal). Taking 0 ≤j≤J and 0 ≤i≤ (2j –1)the set of wavelets considered in the expansion (A.2) is limited so that an approxima-tion of υ via wavelets up to J -th scale is given by
(A.3) .
For example, if J=2 then ZJ = {0, (0,0), (0,1), (1,1), (0,2), (1,2), (2,2), (3,2)} where the fi rst element refers to the father wavelet, ψ0 , and the other ones refer to the ψ(i,j) = ψi,j wavelets.
An unbiased estimator of (A.3) is given by
(A.4)
with denoting an unbiased
esti-mator of βη, where ti is the instant of occurrence of the
i-th event and N(dti) represents the number of events occurred in an infi nitesimal region which contains the point ti∈ [0,T].
An unbiased estimator of the variance of is
(A.5)
and an unbiased estimator of the variance of is
(A.6)
with η, ξ ∈ ZJ.
Note that (A.4) and (A.6) are also asymptotically, in relation to J, unbiased for υ and , respectively. The magnitude of the bias measured in the L2 norm for exponentially decreases with J . A detailed study of
the convergence rate and bounds for the bias of these estimators is presented in de Miranda.a
The two-dimensional case (spatial). For spatial densities, two coordinates must be considered. The
estimators for υJ (x) and βη assume similar forms to those presented in the one-dimensional case. Now, η belongs to the set ZJ = ZJ1×ZJ2 , where Ji corre-sponds to the maximum scale for the i-th coordinate. Since ψη(x, y) = ψ(η1,η2) (x, y) = ψ(η1)(x) ψ(η2)(y)
is also an orthonormal base6 it can be written as
and
where η1 ∈Z1, η2∈ Z2
and η = (η1, η2) ∈ (Z1 ×Z2). Note that now ti = (xi, yi) represents a point in A.
1. Bailey TC. Spatial statistical methods in health. Cad Saude Publica. 2001;17(5):1083-98. doi:10.1590/
S0102-311X2001000500011
2. Diggle PJ. Statistical analysis of spatial point patterns. New York: Academic Press; 1983.
3. Elliott P, Wakefi eld J. Bias and confounding in spatial epidemiology. In: Elliott P, Wakefi eld J, Best N, Briggs D, editors. Spatial epidemiology. New York: Oxford University Press; 2000. p.68-84.
4. Jorge MHPM, Yunes J. Violência e saúde no Brasil. Rev USP. 2001;51:114-27.
5. Kaluzny SP, Vega SC, Cardoso TP, Shelly AA. S+ spatial stats. User´s manual for Windows and UNIX. New York: Springer; 1998.
6. Meyer Y. Ondelettes et algorithmes concurrents. Paris: Hermann; 1992.
7. Morettin PA. Ondas e ondaletas: da análise de Fourier à análise de ondaletas. São Paulo: Edusp; 1999.
REFERENCES
Article based on the doctorate thesis by LP Lima presented to Faculdade de Medicina of Universidade de São Paulo in 2005. LP Lima was partially supported by Conselho de Desenvolvimento Científi co e Tecnológico (CNPq – doctorate scholarship). Research partially funded by Fapesp (n.01/12913-3; n.04/15304-6) and CNPq (n.306180/88-0 RN).
Estimators of the variance of and are
obtained as presented in (A.5) and (A.6).
Threshold procedure. A threshold procedure can be used to evaluate the signifi cance of the wavelet
coef-fi cients based on Chebyshev’s inequality. The procedure is equivalent to rejecting H0: βη = 0 versus H1: βη≠ 0
for all η∈ZJ when . Taking λ = 2
the confi dence level is 75%.
This procedure provides a threshold estimated intensity which is computed using only those wavelet coeffi cients
that signifi cantly differ from zero. It corrects potential overfi tting due to large Ji values.
ACKNOWLEDGMENTS