David C. Wyld et al. (Eds) : CCSIT, SIPP, AISC, PDCTA, NLP - 2014
pp. 37–51, 2014. © CS & IT-CSCP 2014 DOI : 10.5121/csit.2014.4204
Noureddine Bouhmala
Department of Maritime Technology and Innovation,
Vestfold University College , Norway
noureddine.bouhmala@hive.no
A
BSTRACTData Mining is concerned with the discovery of interesting patterns and knowledge in data repositories. Cluster Analysis which belongs to the core methods of data mining is the process of discovering homogeneous groups called clusters. Given a data-set and some measure of similarity between data objects, the goal in most clustering algorithms is maximizing both the homogeneity within each cluster and the heterogeneity between different clusters. In this work, two multilevel algorithms for the clustering problem are introduced. The multilevel paradigm suggests looking at the clustering problem as a hierarchical optimization process going through different levels evolving from a coarse grain to fine grain strategy. The clustering problem is solved by first reducing the problem level by level to a coarser problem where an initial clustering is computed. The clustering of the coarser problem is mapped back level-by-level to obtain a better clustering of the original problem by refining the intermediate different clustering obtained at various levels. A benchmark using a number of data sets collected from a variety of domains is used to compare the effectiveness of the hierarchical approach against its single-level counterpart.
K
EYWORDSClustering Problem, Genetic Algorithm, Multilevel Paradigm, K-Means.
1. I
NTRODUCTION
and challenging problems due to its unsupervised nature. It is important to make a distinction between supervised classification and unsupervised clustering.
In supervised classification, the analyst has available sufficient knowledge to generate representative parameters for each class of interest. This phase is referred to as training. Once trained, a chosen classifier is then used to attach labels to all objects according to the trained parameters. In the case of clustering analysis, a clustering algorithm is used to build a knowledge structure by using some measure of cluster quality to group objects in classes. The primary goal is to discover concepts structure in data objects. The paper is organized as follows: Section 2 presents a short survey of techniques for the clustering problem. Section 3 explains the clustering problem while Section 4 describes the genetic algorithm and the K-Means algorithm. Section 5 introduces the multilevel paradigm , while section 6 presents the experimental results. Finally, Section 7 presents a summary and possible future work.
2. A S
HORT
S
URVEY
OF
A
LGORITHM
3. T
HE
C
LUSTERING
P
ROBLEM
The clustering Problem can be defined as follows: Given a finite set of N data objects where each object is a finite set of attributes or feature from which it can be identified. A relation defining the constraints on the resulting clusters. The relation to be respected by all the formed clusters is that no pairs of clusters should have a data object in common. A solution to the clustering problem requires the partitioning of the N data objects into a set of K clusters such that objects in the same cluster are more similar to each other than to those in other clusters. Searching all possible clustering alternatives would not be possible. Because of this reason, there is a considerable interest in the design of heuristics to solve the clustering problems using a cost function that quantifies the goodness of the clusters on the basis of the similarity or dissimilarity measures of the data objects. A commonly used cost function is the sum of squared distances of the data objects to their cluster representatives. Euclidean distance is the most widely used distance function in the clustering context.
4. A
LGORITHMS
4.1 Genetic Algorithms
Genetic Algorithms [13] are stochastic methods for global search and optimization and belong to the group of Evolutionary Algorithms. They simultaneously examines and manipulates a set of possible solution. Given a specific problem to solve, the input to GAs is an initial population of solutions called individuals or chromosomes. A gene is part of a chromosome, which is the smallest unit of genetic information. Every gene is able to assume different values called allele. All genes of an organism form a genome which affects the appearance of an organism called phenotype. The chromosomes are encoded using a chosen representation and each can be thought of as a point in the search space of candidate solutions. Each individual is assigned a score (fitness) value that allows assessing its quality. The members of the initial population may be randomly generated or by using sophisticated mechanisms by means of which an initial population of high quality chromosomes is produced. The reproduction operator selects (randomly or based on the individual's fitness) chromosomes from the population to be parents and enters them in a mating pool. Parent individuals are drawn from the mating pool and combined so that information is exchanged and passed to off-springs depending on the probability of the cross-over operator. The new population is then subjected to mutation and enters into an intermediate population. The mutation operator acts as an element of diversity into the population and is generally applied with a low probability to avoid disrupting cross-over results. Finally, a selection scheme is used to update the population giving rise to a new generation. The individuals from the set of solutions which is called population will evolve from generation to generation by repeated applications of an evaluation procedure that is based on genetic operators. Over many generations, the population becomes increasingly uniform until it ultimately converges to optimal or near-optimal solutions. Below are the various steps used in the proposed genetic algorithm.
4.1.1Fitness function
be compared. The fitness function used by the genetic algorithm is simply the Euclidean distance.
4.1.2 Representation
A representation is a mapping from the state space of possible solutions to a state of encoded solutions within a particular data structure. The encoding scheme used in this work is based on integer encoding. An individual or chromosome is represented using a vector of n positions, where n is the set of data objects. Each position corresponds to a particular data object, i.e, he ith position (gene) represents the ith data object. Each gene has a value over the set {1,2,....k}. These values define the set of cluster labels.
4.1.3 Initial population
The initial population consists of individuals generated randomly in which each gene's allele is assigned randomly a label from the set of cluster labels.
4.1.4 Cross-over
The task of the cross-over operator is to reach regions of the search space with higher average quality. New solutions are created by combining pairs of individuals in the population and then applying a crossover operator to each chosen pair. The individuals are visited in random order. An unmatched individual i_l is matched randomly with an unmatched individual i_m. Thereafter, the two-point crossover operator is applied using a cross-over probability to each matched pair of individuals. The two-point crossover selects two randomly points within a chromosome and then interchanges the two parent chromosomes between these points to generate two new offspring. Recombination can be defined as a process in which a set of configurations (solutions referred as parents) undergoes a transformation to create a set of configurations (referred as off-springs). The creation of these descendants involves the location and combinations of features extracted from the parents. The reason behind choosing the two point crossover are the results presented in \cite{crossover} where the difference between the different crossovers are not significant when the problem to be solved is hard. In addition, the work conducted in [14] shows that the two-point crossover is more effective when the problem at hand is difficult to solve.
4.1.5 Mutation
4.1.6 Selection
The selection operator acts on individuals in the current population. During this phase, the search for the global solution gets a clearer direction, whereby the optimization process is gradually focused on the relevant areas of the search space. Based on each individual fitness, it determines the next population. In the roulette method , the selection is stochastic and biased towards the best individuals. The first step is to calculate the cumulative fitness of the whole population through the sum of the fitness of all individuals. After that, the probability of selection is calculated for each individual.
4.2
K-Means Algorithm
The K-means [15] is a simple and well known algorithm used for solving the clustering problem. The goal of the algorithm is to find the best partitioning of N objects into K clusters , so that the total distance between the cluster's members and its corresponding centroid, representative of the cluster is minimized. The algorithm uses an iterative refinement strategy using the following steps:
1) This step determines the starting cluster's centroids. A very common used strategy is to
assign random k different objects as being the centroids.
2) Assign each object to the cluster that has the closest centroid. In order to find the cluster
with the most similar centroid, the algorithm must calculate the distance between all the objects and each centroid.
3) Recalculate the values of the centroids. The values of the centroid are updated by taking
as the average of the values of the object's attributes that are part of the cluster.
4) Repeat steps 2 and 3 iteratively until objects can no longer change clusters.
5. T
HE
M
ULTILEVEL
P
ARADIGM
The multilevel paradigm [16] is a simple technique which at its core involves recursive coarsening to produce smaller and smaller problems that are easier to solve than the original one. The multilevel paradigm consists of four phases: coarsening, initial solution, projection and refinement. The coarsening phase aims at merging the variables associated with the problem to form clusters. The clusters are used in a recursive manner to construct a hierarchy of problems each representing the original problem but with fewer degrees of freedom. This phase is repeated until the size of the smallest problem falls below a specified reduction threshold. Then, a solution for the problem at the coarsest level is generated, and then successively projected back onto each of the intermediate levels in reverse order. The solution at each child level is improved before moving to the parent level. A common feature that characterizes multilevel algorithms, is that any solution in any of the coarsened problems is a legitimate solution to the original problem. The multilevel paradigm comprises the following steps:
5.1 Reduction Phase:
is selected, and a new data objects O_k (a cluster) consisting of the two data objects O_i and O_j is created. The set of attributes of the new data object O_k is calculated by taking the average of each attribute from O_i and its corresponding one from O_j. Unmerged data objects are simply copied to the next level. The second coarsening algorithm distance coarsening (MC) exploits a measure of the connection strength between the data object which relies on the notion of distance. The data objects are visited in a random order. However, instead of merging a data object O_i with a random object O_j, the data object O_i is merged with O_m such that Euclidean distance function is minimized. The new formed data objects are used to define a new and smaller problem and recursively iterate the reduction process until the size of the problem reaches some desired threshold .
5.2 Initial Clustering
The reduction phase ceases when the problem size shrinks to a desired threshold. Initialization is then trivial and consists of generating an initial clustering ( S_m) for the problem using a random procedure. The clusters of every individual in the population are assigned a random label from the set of cluster labels.
5.3 Projection Phase
The projection phase refers to the inverse process followed during the reduction phase. Having improved the quality of the clustering on level S_{m+1}, this clustering must be extended on is parent level S_m. The extension algorithm is simple; if a data object O_i in S_{m+1} is assigned the cluster label c_l, then the merged pair of data objects that it represents, O_l, O_m in S_m are also assigned the cluster label c_l .
5.4
Improvement or Refinement Phase
The idea behind the improvement phase is to use the projected clustering at level S_{m+1} as the initial clustering for the level S_m for further refinement using GA or K-Means described in the previous section. Even though the clustering at the level S_{m+1} is at a local minimum, the projected clustering may not be at a local optimum with respect to S_m. The projected clustering is already a good solution and contains individuals with low function value, GA and K-means will converge quicker to a better clustering. As soon as the population tends to loose its diversity, premature convergence occurs and all individuals in the population tend to be identical with almost the same fitness value. During each level, the genetic algorithm is assumed to reach convergence when no further improvement of the best solution has not been made during five consecutive generations.
6. E
XPERIMENTAL
R
ESULTS
6.1 Benchmark Instances and Parameter Settings
the GNU C compiler version 4.6. The following parameters have been fixed experimentally and are listed below:
-Crossover probability = 0.85
-Mutation probability = 0.01
-Population size = 50
-Stopping criteria for the reduction phase: The reduction process stops as soon as the size of the coarsest problem reaches 10 % the size of the original problem.
-Convergence during the refinement phase: If there is no observable improvement of the cost Euclidean distance cost function during 5 consecutive generations (GA) or iterations (for K-Means), both algorithms are assumed to have reached convergence and the improvement phase is moved to a higher level
6.2 Analysis of Results
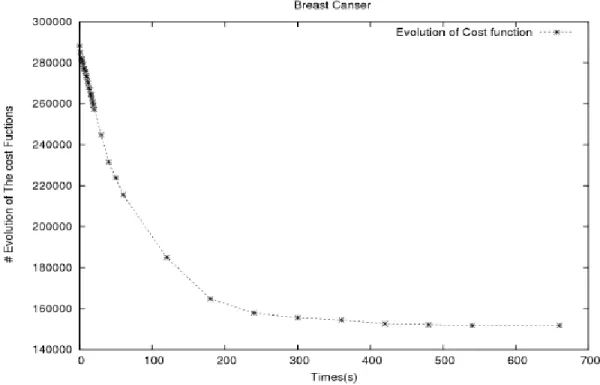
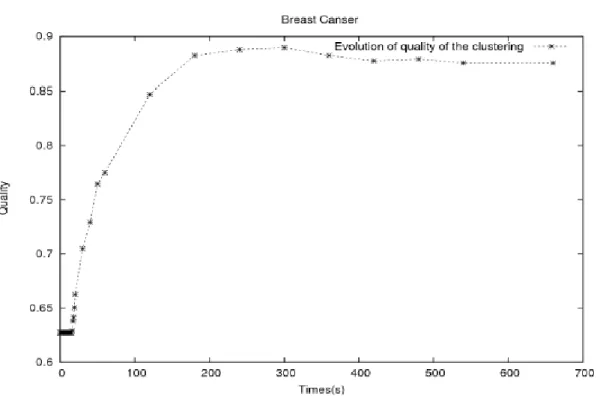
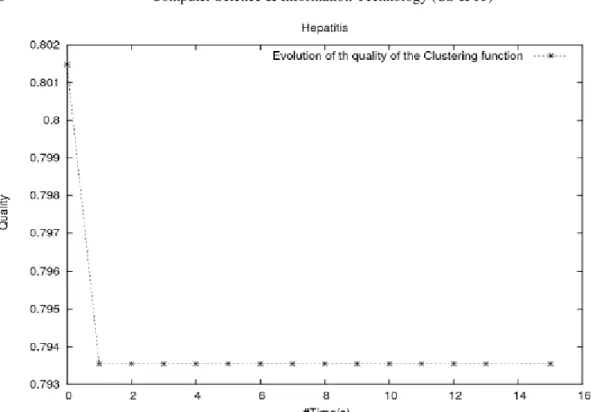
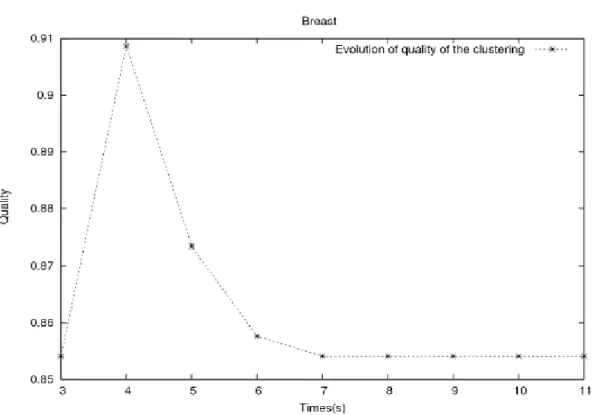
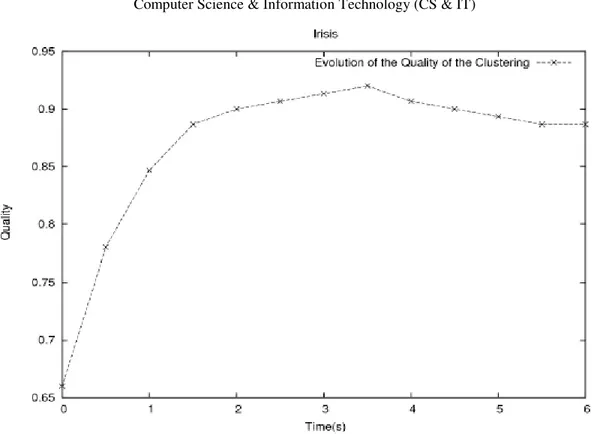
The plot in Figures [1]-[8] show the evolution of the cost function versus the quality of the clustering. The plots suggest that cluster problem solving with GA happens in two phases. In the first phase, the cost function decreases rapidly and then flattens off as we reach the plateau region, marking the start of the second phase. The plateau region spans a region in the search space where the best value of the cost function remains unchanged. The plateau region may be of a short length depending on whether the algorithm possesses some sort of mechanisms capable of escaping from it, otherwise the algorithm stagnates and a premature convergence of the algorithm is detected. A closer look at Figures 1-2 show that the quality of the clustering reaches its highest value at 0.88% and continues to get marginally worse (0.87%) while the value of cost function is slightly decreasing. The plots depicted in Figures 3-4 show that the quality of the clustering drops from 0.80% to 0.79% before GA enters a premature convergence state. On the other hand, the curve of the cost function continues to decrease showing some improvement. An improvement of
37% in the cost function led to no improvement in the quality of the clustering. The same
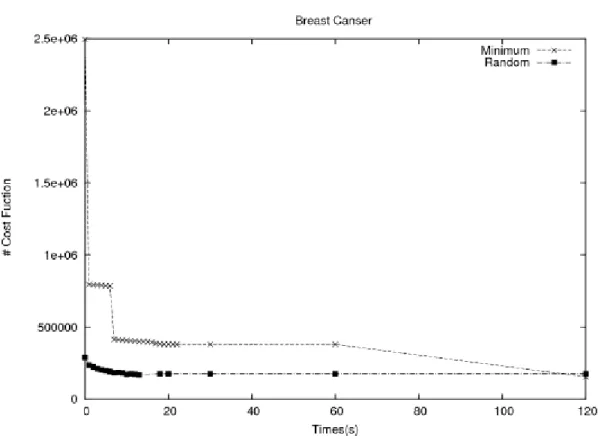
Comparing the two multilevel algorithms using MC as the chosen coarsening scheme, MLVL-GA produces better quality in 3 out of 8 cases and the difference in quality ranges from 2% to 24%. For the remaining 3 cases where MLVL-K-Means does better, the improvement is only marginally better (between 0.9% and 2%). Looking at the time spent MLVL-K-Means, in all the cases requires the least amount of time (up to 99% faster).With regard to the multilevel paradigm, it is somewhat unsatisfactory that its ability to enhance the convergence behavior of the two algorithms is not conclusive. However, This does not seem to be in line with with the general success established in other combinatorial optimization problems such as the graph partitioning problem [16] and the satisfiability problem [17]. The reason behind this sort of convergence behaviour observed in the multilevel paradigm is not obvious but we can speculate. As pointed earlier, the multilevel paradigm requires that any solution in any of the coarsened problems should induce a legitimate solution on the original problem. Thus at any stage after initialisation the current solution could simply be extended through all the problem levels to achieve a solution of the original problem. This requirement is violated in our case. The attributes of each object formed during each child level are calculated by taking the average of the attributes of two different objects from the parent level. The consequence of this procedure is that the optimization is carried out on different levels each having its own space. The clustering obtained at the coarse space and the original space do not have have the same cost with respect to the objective function.
Figure 2. Average Development for 100 Runs Evolution of the Quality of the Clustering for BreastCancer
Figure 4. Average Development for 100 Runs. Evolution of the Quality of the Clutering for Hepatitis
Figure 6. Average Development for 100 Runs. Evolution of the Quality of the Clustering for Breast.
Figure 8. Average Development for 100 Runs. Evolution of the Quality of the Clustering for IRISIS.
Figure 10. Comparison of Coarsening Schemes for Breastcancer
7. C
ONCLUSIONS
This paper introduces a multilevel scheme combined with the popular K-Means and genetic algorithm for the clustering problem. The first conclusion drawn from the results at least for the instances tested in this work generally indicate that the Euclidean Distance cost function widely used in literature does not capture the quality of the clustering making it an unsuitable metric to apply for maximizing both the homogeneity within each cluster and the heterogeneity between different clusters. The coarsening methods used during the coarsening phase have a great impact on the quality of the clustering. The quality of the clustering provided by MC is at least as good or better compared to RC regardless of which algorithm is used during the refinement phase. To summarise then, the multilevel paradigm can improve the asymptotic convergence of the original algorithms. An obvious subject for further work would be the use of different cost functions and better coarsening schemes so that the algorithms used during the refinement phase work on identical search spaces. A better coarsening strategy would be to let the merged objects during each level be used to create coarser problems so that each entity of a coarse problem P_k is composed of 2^k objects. The adopted strategy will provide K-Means and GA to work on identical search spaces during the refinement phase.
R
EFERENCES[1] B.S Everitt, S. Landau, M. Leese (2001) Cluster Analysis, Arnold Publishers.
[2] M.R. Garey, D.S. Jhonson, H.S. Witsenhausen (1982). "The complexity of the generalized Llyod-Max problem". IEEE Trans Info Theory 28 (2), pp255-256.
[3] J.P. Bigus ( 1996) Data Mining with Neural Networks, McGraw-Hill. [4] A.K. Jain, R.C. Dubes. (1988) Algorithms for Clustering Data. Prentice Hall.
[5] G. Mecca, S. Raunich, A. Pappalardo. ( 2007) “A New Algorithm for Clustering Search Results. Data and Knowledge Engineering”, Vol. 62, pp504-522.
[6] P.M. BertoneGerstein (2001) " Integrative Data Mining: The New Direction in Bioinformatics- Machine Learning for Analzing Genome-Wide Expression Profiles" , IEEE Engineering in Medicine and Biology, Vol. 20, pp33-40.
[7] Y. Zhao and G. Karypis ( 2002) "Evaluation of hierarchical clustering algorithms for document datasets ", In Proc. of Int’l.Conf. on Information and Knowledge Management, pp515–524.2002. [8] S. Zhong,J.Ghosh (2003) "A comparative study of generative models for document clustering", In
SIAM Int. Conf. Data Mining Workshop on Clustering High Dimensional Data and Its Applications, San Francisco, CA.
[9] D.P.F. Alckmin, F.M.Varejao (2012) " Hybrid Genetic Algorithm Applied to the Clustering problem", Revista Investigacion Operational, Vol.33, NO. 2, pp141-151.
[10] B. Juans, S.U. Guan (2012) "Genetic Algorithm Based Split-Fusion Clustering", International Journal of Machine Learning and Computing, Vol. 2, No. 6.
[11] K. Adnan, A. Salwani, N.M.Z. Ahmad. (2011) "A Modified Tabu Search Approach for The Clustering Problem. Journal of Applied Sciences ", Vol. 11 Issue 19.
[12] D.O.V. Matos, J.E.C. Arroyo, A.G. dos Santos, L.B. Goncalves (2012) " A GRASP based algorithm for efficient cluster formation in wireless sensor networks. Wireless and Mobile Computing, Networking and Communications (WiMob) ", 2012 IEEE 8th International Conference on , vol., no., pp187-194.
[13] D.E. Goldberg ( 1989) Genetic Algorithms in Search, Optimization, and Machine Learning , Addison-Wesley, New York.
[15] J.B. MacQueen ( 1967 ) "Some methods for classification and analysis of multi- variate observation" , In: In Le Cam, L.M and Neyman, J., editor, 5 Berkeley Symposium on Mathematical Statistics and Probability. Univ. of California Press
[16] C. Walshaw ( 2008) "Multilevel Refinement for Combinatorial Optimization: BoostingMetaheuristic Performance”, in C. Blum et al., pp261-289, Springer, Berlin.
[17] N. Bouhmala. (2012) "A Multilevel Memetic Algorithm for Large Sat-Encoded Problems ", Evolutionary Computation, Vol.20 (4) , pp641-664.