HETEROGENEITY IN THE LABOR MARKET:
UNEMPLOYMENT AND NON-PARTICIPATION IN
BRAZIL
Marina Ferreira Fortes Aguas*
Valéria Lucia Pero†
Eduardo Pontual Ribeiro‡
Abstract
This article examines the criteria for classification between unemploy-ment and non-participation in the labor force. We analyze the behavior of a non-employed subgroup, called marginally attached to the labor market (those who are not working or searching for a job in the reference week, but are willing to work), to test whether the transitions are similar to ei-ther the unemployed or to those non attached to the labor market. We ob-served that this group is behaviorally distinct and could be considered an intermediate state between the unemployed and those non-participating in the labor force, although closer to the unemployed.
Keywords:Unemployment; Non-participation; Transition matrix; Labor market.
Resumo
O trabalho tem como objetivo analisar a validade dos métodos corren-tes de distinção entre o desemprego e a inatividade. Para isso, aplica-se uma abordagem empírica baseada no comportamento de uma categoria dos inativos denominados marginalmente ativos, isto é, indivíduos que não estão ocupados e não procuram trabalho, porém têm o desejo de tra-balhar. Buscou-se testar se os fluxos entre os estados de atividade e inati-vidade dos marginalmente ativos são comportamentalmente idênticos aos dos desempregados ou “realmente” inativos. Como resultado, verificou-se que as pessoas inativas que deverificou-sejam trabalhar têm claramente um com-portamento distinto daqueles que não procuram e nem desejam trabalhar, estando mais próximas do estado de desemprego.
Palavras-chave:Desemprego; Inatividade: Matriz de transição; Mercado de trabalho.
JEL classification:J60.
DOI:http://dx.doi.org/10.1590/1413-8050/ea471
*Economics Institute, UFF, Brazil. E-mail: mari[email protected]
†Economics Institute (IE), UFRJ, Brazil. E-mail: [email protected]
‡Economics Institute (IE), UFRJ, and CNPq researcher, Brazil. E-mail: [email protected]
1
Introduction
A central issue for Statistical Agencies in the world is the definition of unem-ployment. Determining which members of the non-employed population will be defined as unemployed is of paramount importance in an economy because labor market diagnostics and public policies are based on such definition.
Most countries, including Brazil, make a distinction between unemployed and out-of-the-labor-force individuals based on the job-search criterion. Job searching effort reveals how close individuals are to the labor market.
How-ever, this criterion does not highlight the differences observed within each
group, especially those not actively searching for a job. Given this scenario, the purpose of this study is to assess the validity of current methods used to distinguish between unemployment and out of the labor force activity in Brazil.
Even though the basic definition of unemployment encompasses job search, there are people who are available for work, but who have not actively looked for a job in the reference week. According to the International Labor Organi-zation (ILO) and the new Brazilian Monthly Employment Survey (PME), con-ducted by the Brazilian Institute of Geography and Statistics (IBGE), these are classified as “discouraged,” also known as marginally attached to the la-bor market. There exists great controversy in the literature on how to classify these workers, whether they draw nearer those regarded as out of the labor force (those who do not work and have not actively looked for a job) or unem-ployed (those who do not work but have actively looked for a job).
The empirical analysis follows the seminal work by Jones & Riddell (1999) and Flinn & Heckman (1982, 1983). These authors propose to assess the simi-larity between individuals marginally attached, non-participating and unem-ployed ones through their dynamics. Therefore, the marginally attached are labeled as non-participating if their mobility between labor market states (em-ployed, unemployed and out of the labor force) is similar to the later group. On the other hand, the marginally attached should be considered as unem-ployed if their dynamics is similar to that of unemunem-ployed individuals.
To appraise such similarity, statistical tests will be run on unconditional and conditional transition matrices. Conditional analysis is required to distin-guish the dynamics of the marginally attached and of the non-participating from demographic or educational characteristics composition effects between
the groups. For example, suppose that the transition into employment is lower for older people. Should the marginally attached have a different age
structure than those of the non-participating group, but similar conditional into employment dynamics within age groups, the unconditional dynamics would differ solely due to the age structure. The analysis was carried out for
Brazil between 2003 and 2008, based on longitudinal data from the PME/IBGE. Advancing the main results, we conclude that the marginally attached have different labor market dynamics from other non-employment groups.
Their dynamics, as estimated in the transition matrices between labor market states (employed, unemployed, non-attached and marginally attached indi-viduals) are statistically different from both unemployed and non-participating
Portu-gal, Trinidad and Tobago, Canada and the USA. Our results indicate that a sharper view of a three state labor market requires classifying the marginally attached group as an intermediate category between unemployment and non-participation.
2
Definition of unemployed and non-participation: A brief
summary
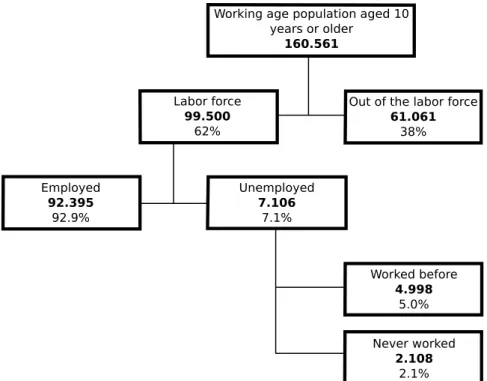
Brazil has ratified and adapted the ILO resolutions to its reality. In the Brazil-ian labor market, the working-age population (WAP) includes individuals aged 10 years or older and is divided into: 1) economically active popula-tion (EAP) or labor force, which includes both employed and unemployed in-dividuals; and 2) out-of-the-labor-force or non-participating or economically inactive population (EIP).
According to the IBGE, the term labor force refers to people who are em-ployed or unemem-ployed, or who have been temporarily laid offand have been
waiting to be hired again. Employed (EP) are those who held a paid job (paid in kind, goods or benefits) or an unpaid job as a way to help a working house-hold member, either self-employed or as an employee, for at least one hour, in the reference week. Unemployed people (UP) are those who did not work in the reference week, but who actively searched for a job on the last 30 days and who were available for work in that week. Those people who are not employed or unemployed are referred to as out of the labor force.
For example, in 2008, the Brazilian National Household Survey (PNAD), conducted by IBGE, revealed that there were around 160.5 million working age Brazilians. Approximately 92.4 million of these were employed, 7.1 mil-lion were unemployed and 61 milmil-lion were economically inactive. These fig-ures and the identities of the people in each labor market state are in constant change. Between 2007 and 2008, labor force increased to slightly over 1,600 million people. According to (Ehrenberg & Smith 2000, p.27-28), one can identify four large labor market flows across labor market states:
1. Employed workers who become unemployed by voluntary withdrawal or due to temporary or permanent layoff;
2. Unemployed workers who get a new job contract or who were laid off
temporarily and are hired again;
3. Those in the labor force who, being employed or unemployed, can vol-untarily withdraw from their job;
4. Those who have never worked or never looked for a job and who expand the labor force by way of rehirings, or those who had withdrawn from the labor market and return to it.
The chart above shows the breakdown of the Brazilian WAP for 2008 and the four large labor market flows, based on PNAD data obtained by the IBGE.
2.1 Debate on unemployment classification methods
Working age population aged 10 years or older
160.561
Out of the labor force
61.061
38% Labor force
99.500
62%
Employed
92.395
92.9%
Unemployed
7.106
7.1%
Worked before
4.998
5.0%
Never worked
2.108
2.1%
Source: Author’s estimates based on data from the 2008 Brazilian National Household Survey (PNAD).
Figure 1: Working-age population in 2008 in the reference week per 1,000 people.
describe the current situation, the statistical method used to select the nec-essary information must be based on definitions that are consistent with the country’s reality, and these can be different from those used as guidelines by
other countries.
The definition of standard (or open) unemployment adopted by the ILO and in Brazil is based on three criteria that should occur simultaneously: (a) the person is not working; (b) the person is currently available for work; and (c) the person is looking for a job. These criteria concern the activities of people during a specific reference period. A person should be classified as unemployed only if it has been established that he/she is not employed. The aim of this criterion is to warrant that employment and unemployment be mutually exclusive, but employment should take precedence. Thus, people who hold a transient job will be classified as employed even if they are looking for a job.
Individuals who are not employed or unemployed in the reference period will be classified as out of the labor force. It should be underscored that this category includes those individuals that actively looked for a job prior to the reference period and also those who feel discouraged, but who would like to be working.
Nevertheless, in several countries, job search can include not only the so-called “active” methods, but “passive” ones as well. In the United States, for instance, people who passively look for a job, such as searching for a job in newspaper ads, are classified as belonging to the economically inactive pop-ulation (EIP), whereas in Canada and in many other OECD countries, active and passive job search leads to the classification of an individual as unem-ployed (Zagorsky 1996). On the other hand, “discouraged” workers, that is, those who would like to be working, but who do not look for a job because they believe a job vacancy is not available, were regarded as unemployed in the USA up to 1967 and in Canada up to 1975, but have been subsequently included among out-of-the-labor-force individuals.
By basing the definition of unemployment upon job search in a given ref-erence period, the search effort reveals how close individuals are to the labor
market. Thus, those who do not look for a job, but who want to work or who stopped seeking for a job, do not show a sufficiently close proximity to market
activity so as to be classified as unemployed.
In an attempt to have a better understanding of the labor market states and of their heterogeneity, new definitions of unemployment in the mid 1990’s in Brazil were implemented. Seade/Dieese1 statistics introduced other ways to
measure unemployment using the definition of “hidden” unemployment and of discouraged workers. Latter, in 2002, IBGE adopted a similar measure, by introducing a new version of their monthly working survey (PME).
The difference between those who look for a job and those who do not is
of utmost importance to labor market analysis, especially for those studies based on flows between different labor market states (employed, unemployed
or out of the labor force). The idea concerning job search is often replaced with the notion of productive “waiting” for new jobs, according to Blanchard & Diamond (1992). The distinction is no longer based on the activities that non-working individuals undertake to look for a job, but rather on the “pro-ductivity” of out-of-the-labor-force periods, assessed by the rates of transition to employment. According to these authors, the hiring decisions made by the firms are based on the “ranking” of job candidates. A worker who has been unemployed for a shorter time will be hired. Therefore, duration of unem-ployment is assumed to be the only criterion for hiring decisions. The longer the duration of unemployment, the less likely an individual will be hired.
This view of labor market operation is supported by the importance of transitions between non-participation and employment. The behavior of cer-tain individuals who do not look for a job, but who are available for work should not be considered too far away from labor market activity, and they could even be included in the group of unemployed or in a different group.
Therefore, it is crucial that each country adopt criteria for the classification of individuals in the labor market that do suit its reality. Capturing a country’s actual situation is extremely important for implementing public policies and enhancing their efficacy.
1SEADE (Sistema Estadual de Análise de Dados) is a foundation attached to the
3
Empirical framework and international experience
The empirical analysis for an appropriate definition of unemployment can be described as a Markov model for transitions between labor market states. The first step is to assess heterogeneity in a four-state model: employed (E), unem-ployed (U), marginally attached (M) and those non-attached (non-participating) to the labor market (N). The first two states correspond to those convention-ally measured by labor market surveys (in Brazil, PME and PNAD), whereas the latter two are concerned with the categorization of out-of-the labor-force individuals (O) into two components, M and N.
Despite the large number of possible definitions for the marginally at-tached, we focus on those individuals who were considered economically in-active in the reference week (may or may not have searching for employment or even worked in the reference period of 1 year), but had the desire for work. Individuals classified as N are those who do not look for a job neither want to work, i.e., the ones non-attached to the labor force.
Labor market dynamics is represented by a 4x4 transition matrix P, where Pijis the probability of an individual being in statejin the subsequent period
given that she is currently in statei, i.e., the transition rate from statei toj. This matrix can be represented by:
P=
PEE PEU PEM PEN
PU E PU U PU M PU N
PME PMU PMM PMN
PN E PN U PN M PN N
where,Pij=dij/ri.dijstands for the number of individuals in state i in the
ini-tial period who move to state j in the subsequent period;riis the number of
in-dividuals in state i in the initial period, i.e.,ri=Σjdij; andi, j=E, U, M, N, are
the labor market states, employed (E), unemployed (U), marginally attached (M) and non-attached to the labor force (N). Longitudinal data is required to calculate the transition rates.
The methodology used in this paper to test whether two states of non-employment have an identical behavior, was originally developed by Flinn & Heckman (1982, 1983) and made popular by Jones & Riddell (1999). Ac-cording to these authors, by conveniently controlling the characteristics of individuals, if the transition rate from state x to z is identical to the transition rate from state y to z, the origin state (x or y) should be considered irrelevant in terms of determination of the transition rate of individuals to state z.
Based on this formulation, the necessary and sufficient condition for the
marginally attached and the non-attached individuals to have the same behav-ior is that the transition probability from M to E equals to that from N to E and that the transition probability from M to U equals to that from N to U, i.e.:
PME=PN E
PMU =PN U
Under these circumstances, the four-state Markov model becomes a three-state (E,U and O) model, The desire to work does not differentiate individuals
Alternatively, the conventional job search requirement for characterizing unemployment is likely to be quite restrictive, and those individuals regarded as marginally attached may have a similar behavior than those unemployed, i.e.:
PME=PU E
PMN =PU N
In this case, unemployment assessment should be based on the desire to work and not on job search only. The desire to work itself can distinguish unemployed from those inactive, and the job search criteria would not yield any additional information.
If these two conditions are rejected, Jones & Riddell (1999) suggest that one should expect:
PU E> PME> PN E
PU U> PMU> PN U
PU N< PMN < PN N
Here, the four-state model for the labor market turns out to be the most appropriate one. Marginally attached individuals should not be included in the non-participating or unemployed groups, for their behavior differs from
the latter. These individuals should be placed in a new category. Therefore, it would be rational for statistical agencies to regularly provide statistics with such category.
The empirical analysis developed herein consists in testing the restrictions identified above for Brazil, thus building a more realistic depiction of labor market dynamics in this country. The analysis is based on likelihood ratio tests. The probabilities above are calculated unconditionally and conditional on observable characteristics, because observable characteristics such as age, gender and schooling levels should not be independent of the labor market states. The conditional probabilities are calculated using a multinomial logit model.
The proposal by Jones and Riddle for the USA was applied to several devel-oped countries, such as Portugal (Centeno & Fernandes 2004), Canada (Jones & Ridell 2002) and developing countries, such as Trinidad and Tobago (Byrne & Strobol 2004).
For Portugal, Centeno & Fernandes (2004) used the individuals dataset of the Employment Survey (ES) for the period between the second quarter of 1992 and the fourth quarter of 2003, for individuals aged 16 to 64 years. Although statistically different from other states, the transition rate of the
marginally inactive to employment was similar to the one from unemploy-ment, and clearly higher than those non-participating. These results support the adoption of one more labor market state, given the high probability of future participation in the labor market of individuals who want to work al-though they do not look for a job.
unemployed individuals. Transition flows to employment show that there are stark differences between the unemployed and the marginally attached, since
the transition UE (unemployment to employment) amounts to approximately 23%, almost twice as high as that of ME (marginally attached to employment). In addition, the transition NE (non-participation to employment) is close to 3.5%, numerically inferior to that of ME, which also demonstrates a different
behavior between M and N.
For Trinidad and Tobago, Byrne & Strobol (2004) obtained a similar result to that of Portugal, in which the group of those marginally attached to the labor market has a closer dynamics to that of the unemployed than to those who do not take part in the labor force.
4
Analysis of results for Brazil
The analysis starts with the estimation of mean transition rates between the four labor market states (E, U, M, N) and the behavior of transition probabili-ties throughout the analyzed period. To calculate these transition rates, PME microdata, conducted by the IBGE, for years 2003 to 2008, were used. The PME is a representative monthly rotating panel household survey that inves-tigates the labor market and characteristics of the population living in the urban areas of the largest Brazilian metropolitan regions (Recife, Salvador, Belo Horizonte, Rio de Janeiro, São Paulo and Porto Alegre).
The PME data is collected through interviews with all household dwellers aged 10 years or older. The sample of household units is distributed according to the four reference weeks of the month. Monthly results are obtained by the average of these four reference weeks. The data collection follows a method in which each selected household unit is surveyed during four consecutive months, ignored for eight months and then surveyed again for four months, and finally eliminated from the sample. If during the period (16 months) in which the household unit remains in the sample, the family moves away and another family moves in, the information will be obtained from the new family during the remaining period. The PME is subdivided into eight rota-tion groups. Every month, 25% of the sample of household units is replaced, following rotation and panel schemes. Therefore, 50% of the sample from a given month appears in the same month the following year.
In addition to measuring employment, unemployment and non-participa-tion, the survey allows identifying marginally attached individuals. This is done through a combination of several questions from the questionnaire sur-vey to identify if the individual considered inactive in the reference week would get a job and be available for this.
4.1 Estimates and time variation of transition rates
The composition of the working-age household heads in metropolitan areas by labor market states considering the period average is 65.09% employed, 3.67% unemployed, 29.57% out of the labor force and 1.67% of marginally attached. It is interesting to underscore, however, that the marginally attached account for approximately 5.4% of the individuals classified as out of the labor force by the PME, but correspond to about 45,5% of the unemployed.
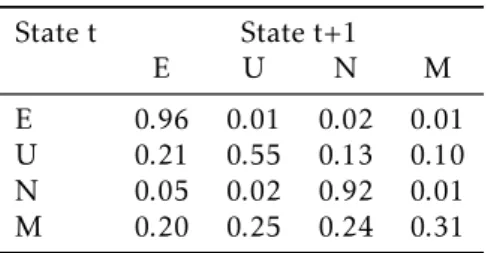
Table 1 shows the mean transition rate estimates for the period. We ob-serve that the strongest labor market state persistence rate is found for em-ployment (EE), followed by out-of-the-labor-market activity (NN). The persis-tence of the marginally attached (MM) is the lowest. Note that this group is more likely to move to any labor market state, a markedly different pattern
from others, perhaps except for the unemployed, who are also more likely to leave the state (UE, UN, UM) than to stay in it (UU).
Table 1: Average Monthly Transition matrix, 2003-2008 — Metropolitan regions — Brazil
State t State t+1
E U N M
E 0.96 0.01 0.02 0.01 U 0.21 0.55 0.13 0.10 N 0.05 0.02 0.92 0.01 M 0.20 0.25 0.24 0.31
Source: Elaborated by the authors based on PME microdata for 2003 to 2008.
The above table obscures the dynamics over the cycle. GDP growth rates varied over the period (1.15% in 2003, 5.71% in 2004, from 3 to 4% in 2005-6 and above 5% in 2007-8). The following graphs show the quarterly mean tran-sition rates for 2003 through 2008 for the selected sample of household heads into employment, unemployment and inactivity.2 Each quarterly transition
rate corresponds to the weighted average of the monthly rates in the quarter. Interestingly, the transition rates are relatively stable over time. With re-gard to exit into employment (Figure 2), the UE and ME rates are close to each other, but the former is slightly higher than the latter. They range be-tween within 18 and 25%. On the other hand, the NE rate is away from the others, always below 6%.
Figure 3 shows the transitions into unemployment. As seen in Table 1, the persistence in unemployment is at a much higher level than the other transi-tions into unemployment. The mobility into unemployment of the marginally attached is more volatile, while the other form of non-participation presents itself on a stable and low level in any period.
As shown in Figure 4, most individuals who were previously non-participa-ting stayed as such (NN). The proportion of people who came from unemploy-ment is relatively small and constant. Conversely, the transition MN has a greater variability, increasing at the end of the period.
0 5 10 15 20 25 30
1st 2nd 3rd 4th 1st 2nd 3rd 4th 1st 2nd 3rd 4th 1st 2nd 3rd 4th 1st 2nd 3rd 4th 1st 2nd 3rd 4th
2003 2004 2005 2006 2007 2008
%
UE NE ME
Source: Elaborated by the authors based on the PME microdata for 2003 to 2008.
Figure 2: Quarterly transition rates to employment.
0 10 20 30 40 50 60 70
1st 2nd 3rd 4th 1st 2nd 3rd 4th 1st 2nd 3rd 4th 1st 2nd 3rd 4th 1st 2nd 3rd 4th 1st 2nd
2003 2004 2005 2006 2007 200
%
UU NU MU
Source: Elaborated by the authors based on the PME microdata for 2003 to 2008.
0 10 20 30 40 50 60 70 80
90 100
1st 2nd 3rd 4th 1st 2nd 3rd 4th 1st 2nd 3rd 4th 1st 2nd 3rd 4th 1st 2nd 3rd 4th 1st 2nd
2003 2004 2005 2006 2007 200
%
UN NN MN
Source: Elaborated by the authors based on the PME microdata for 2003 to 2008.
Figure 4: Quarterly transition rates to non-participation.
This analysis can also be made for the interviewed population, split ac-cording to gender.3 It suffices to say that the transitions by gender are quite
similar to that for the population as a whole. One of the reasons is certainly the restriction in the sample, which takes only the household heads into ac-count. Female household heads have participation rates closer to male house-hold heads. Looking at the migration into employment, the high volatility of ME can be seen for both sexes, as well as its proximity to EU. Men, however, have mobility rates higher than women, regardless of the state of origin.
Transitions into unemployment from inactivity (NU) for both men and women remain at less than 3% throughout the study period. Persistence into unemployment is more volatile, where the rates for women are higher than those for men. This also occurs on UN and MN transitions.
Tables 2 and 3 show the mean transition matrices according to gender. Note that the exit from unemployment differ between men and women: men
tend to move into employment whereas women are more likely to drop out of the labor force or become marginally attached.
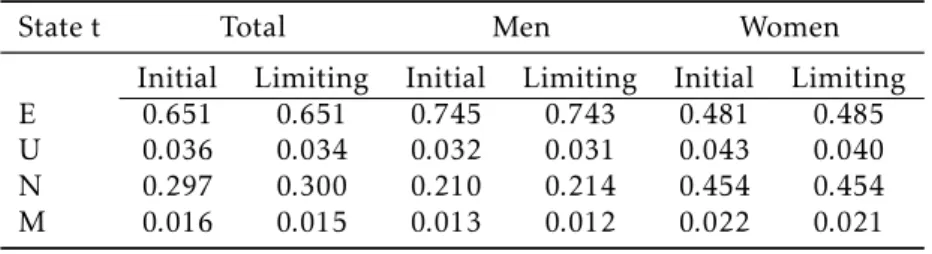
To illustrate the dynamic properties of the transition matrix, we estimated the limiting distribution of labor market states, implied by the transition ma-trix above. The Markov assumption implies that:
Π Pt−1=Pt
whereΠ represents the transition matrix,Pt−1is the vector of marginal prob-abilities in states (E,M,N,U) in quartert−1 andPt is the vector of marginal
probabilities in states (E,M,N,U) in quartert. In the long run, a stationary distribution is assumed such thatPt−1 =Pt =P. We can write Π P=P, i.e.,
3The graphs demonstrate the evolutionary behavior of transition rates between men and
Table 2: Average Monthly Transi-tion matrix for men, 2003-2008 — Metropolitan regions — Brazil
State t State t+1
E U N M
E 0.97 0.01 0.02 0 U 0.26 0.55 0.10 0.09 N 0.06 0.02 0.91 0.01 M 0.25 0.26 0.20 0.29
Source: Elaborated by the authors based on PME microdata for 2003 to 2008.
Table 3: Average Monthly Transi-tion matrix for women, 2003-2008 — Metropolitan regions — Brazil
State t State t+1
E U N M
E 0.94 0.01 0.04 0.01 U 0.15 0.55 0.17 0.12 N 0.04 0.02 0.93 0.01 M 0.15 0.23 0.29 0.33
Source: Elaborated by the authors based on PME microdata for 2003 to 2008.
P= (Π−I)−1. Table 4 shows the average 2003-2008 sample distribution and
the limiting distribution for the whole population and for men and women.
Table 4: Initial and limiting distribution of the population in the labor market states
State t Total Men Women
Initial Limiting Initial Limiting Initial Limiting E 0.651 0.651 0.745 0.743 0.481 0.485 U 0.036 0.034 0.032 0.031 0.043 0.040 N 0.297 0.300 0.210 0.214 0.454 0.454 M 0.016 0.015 0.013 0.012 0.022 0.021
Source: Elaborated by the authors based on PME microdata for 2003 to 2008.
4.2 Behavioral equivalence tests
After presenting the evolution of transition rates, one should evaluate their similarity using the method developed by Flinn & Heckman (1982, 1983). The authors indicate two equivalence conditions for the marginally attached group to be considered similar, from a behavioral standpoint, with the unem-ployed group. That is,PME=PU EePMN=PU N.
Based on table 1, these conditions should be rejected. Despite the fact that the transition probability from unemployment to employment is quite close to the transition probability from marginally attached to employment, the transitions from M or U to N are not similar. The chance of a marginally attached individual to drop out of the labor force is higher than the odds of an unemployed move into non-participation. The result does not change if we segregate by gender (tables 2 and 3).
The second condition concerns the behavioral equivalence between M and N, which would occur if: PME =PN E ePMU =PN U. This condition is clearly
rejected for the Brazilian data. BothPME andPMU are greater thanPN E and
PN U¸ respectively.
As previously pointed out in Section 2, when these two conditions are re-jected, one may expect that:
PU E> PME> PN E
PU U> PMU> PN U
PU N< PMN < PN N
This is exactly what happens in Brazil. Note also that the difference
be-tween PME and PN E is larger than the difference between PU E andPME for
both sexes throughout the analyzed period, suggesting that the marginally attached state is closer to unemployment than to the non-attached group.
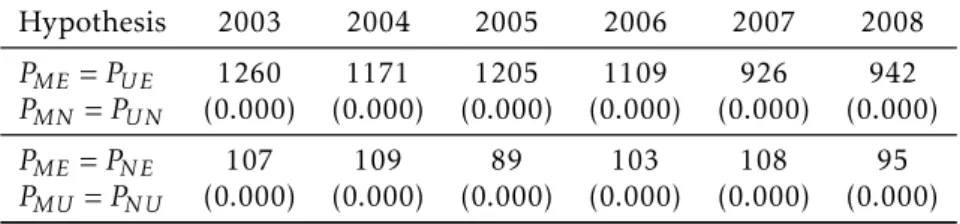
A formal test can be run using asymptotic results for transition matrix probabilities (Formby et al. 2004). The authors generalize the basic results of standard deviations for proportions, available in statistics books, such as, V(PME) =PME(1−PME)/nPM. In Table 5, we present the chi-square statistics
and the p-values for the above hypotheses. The results reject the hypothesis that transitions of people originally in the marginally attached state have a similar behavior to that of unemployed and out-of-the-labor-force individu-als in all of the surveyed years, respectively. Note that the test statistics are higher for the hypothesis of similarity between the marginally attached and out-of-the-labor-force individuals than for the equality hypothesis between marginally attached and unemployed, confirming the evidence above that the marginally attached are a different category, but closer to the unemployed
than to the out-of-the-labor-force individuals.
The analysis of the previous table is complemented by testing the equality of the probabilities conditional on the observable characteristics. This avoids the problem of rejecting transition equality due to composition effects, i.e.,
from the possibility that people in the UE transition have different observable
characteristics from those in the ME transition.
Table 5: Equivalence tests for transition probabilities
Hypothesis 2003 2004 2005 2006 2007 2008
PME=PU E 1260 1171 1205 1109 926 942
PMN =PU N (0.000) (0.000) (0.000) (0.000) (0.000) (0.000)
PME=PN E 107 109 89 103 108 95
PMU=PN U (0.000) (0.000) (0.000) (0.000) (0.000) (0.000) Source: Elaborated by the authors based on PME microdata for 2003 to 2008. Note: p value statistics in brackets. Test statistics x 10−4. Total weighted sample size:
from 105 million (2003) to 122 million (2008) transitions per year.
to compare the behavior of individuals originally in the marginally attached state with the unemployed and out-of-the-labor-force ones. An unrestricted model was estimated, which includes the dummy variable for marginally at-tached (M) people and the interactions of covariates with this dummy, allow-ing for the identification of distinct behaviors of the transitions, first from M and U (Table A.4 in the Appendix) and later from M and N (Table A.5 in the Appendix). Note that if the (conditional) transition probabilities between ME and UE, for instance, are the same, the restricted and unrestricted models should yield the same results. Thus the test of similarity between transition probabilities based on the marginally attached and unemployed, conditional on the characteristics, is implemented as a likelihood ratio significance test on the coefficients associated with the origin in M (in relation to the origin in U).
To save space, we relegate the underlying multinomial logit tests to the ap-pendix. We point out that the observable characteristics (gender, whether self declared white or not, and age and age squared) are significant in all models.
Table 6: Likelihood ratio test
Hypothesis Total Men Women
PME=PU E 439.41 246.9 193.36
PMN =PU N (0.000) (0.000) (0.000)
PME=PN E 2,165.51 1,116.11 1,044.94
PMU =PN U (0.000) (0.000) (0.000) Source: Elaborated by the authors based on PME microdata for 2003 to 2008.
Note: statistics p-value in brackets. Test results are based on Tables A.4 and A.5 in the Appendix. Sample sizes: Men: 24311; Women: 22525.
The likelihood ratio test of the restricted versus the unrestricted model al-lows Checking whether the behavior of transitions of the marginally attached is similar to that of the unemployed or to that of the non-participants. Ac-cording to the likelihood ratio test results and associated p-values shown in Table 6, the no difference between transitions null hypothesis is rejected,
In brief, M is an intermediate state, with some proximity to labor market activity superior to out of the labor force, but still different from
unemploy-ment. Therefore, the use of four labor market states is more adequate to real-ity.
5
Conclusion
The purpose of this study was to assess the validity of the current methods used to distinguish between unemployment and inactivity in Brazil. In par-ticular, the aim was to investigate whether those individuals not searching for a job in the reference week, but desiring to work (the marginally attached) have a distinct behavior from job searchers (the unemployment captured in a conventional way) and from those who do not look for a job and do not want to work (non-participants in the labor force). Longitudinal data were used for this analysis because they allowed observing movements across labor market states. We exploit the information in PME/IBGE microdata that allows us to distinguish between three non-working states (unemployment, non-attached and marginally attached — U, N, M, respectively). Our sample covers from 2003 to 2008. The methodology follows Flinn & Heckman (1982, 1983) and made popular by Jones & Riddell (1999). Here, labor market states are con-sidered different if their dynamics differ.
The major finding was that the marginally attached and the non-participants can be considered different labor market categories, as well as different from
unemployment. Both hypotheses of behavioral equivalence, between U and M, and, N and M were rejected for Brazil, making it clear that there are dif-ferences within the out-of-the-labor-force group. Availability for work repre-sents more than a simple desire; it implies the existence of some proximity to the labor market and significantly increases the probability of transition to employment in the future. The results did not differ by gender and appear
both on unconditional and unconditional transition probability tests.
Another result of the study shows that the marginally attached are closer to unemployment than to out of the labor force. This occurs because the diff
er-ence betweenPMEandPN Eis larger than the difference betweenPME andPU E
for both sexes throughout the analyzed period. Therefore, M may be seen as an intermediate category, whose behavior lies between the unemployed and those remaining out of the labor force.
These results are similar to the ones obtained for countries such as Portu-gal, Canada and the USA, but in the latter two, states U and M do not have the level of proximity found for Brazil and Portugal. On the other hand, in Trinidad and Tobago, the results revealed a different behavior of transitions
in terms of sex, according to which the equivalence test with the unemployed could not be rejected for men.
So, it would be important that the statistics differentiate the three
Bibliography
Blanchard, O. J. & Diamond, P. (1992), ‘The flow approach to labor markets’, American Economic Review82(2), 354–9.
Byrne, D. & Strobol, E. (2004), ‘Defining unemployment in developing coun-tries: evidence from trinidad and tobago’,Journal of Development Economics 73(1), 465–476.
Centeno, M. & Fernandes, P. A. (2004), ‘Heterogeneidade no mercado de tra-balho: o que distingue desemprego e inactividade’,Boletim Econômico. Banco de Portugal. Lisboapp. 63–71.
Ehrenberg, R. G. & Smith, R. S. (2000),Modern Labor Economics: Theory and Public Policy, 7 edn, United States of America.
Flinn, C. J. & Heckman, J. J. (1982), ‘New methods for analyzing structural models of labor force dynamics’,Journal of Econometrics(18), 115–68.
Flinn, C. J. & Heckman, J. J. (1983), ‘Are unemployment and out of the labor market behaviorally distinct labor force states?’,Journal of Labor Economics 1(1).
Formby, J., Smith, J. & Zheng, B. (2004), ‘Mobility measurement, transition matrices and statistical inference’,Journal of Econometrics120(1), 181–205.
Gonzaga, G. (2003), ‘Labor turnover and labor legislation in brazil’,Journal Of The Latin America And Caribbean Association4(1), 165–221.
Jones, S. R. G. & Ridell, W. C. (2002), Unemployment and non-employment: Heterogeneities in labour market states, Working paper series., Department of Economics, McMaster University, Hamilton, Ontario, Canadá.
Jones, S. & Riddell, W. (1999), ‘The measurement of unemployment: An em-pirical approach’,Econometrica67(1), 147–62.
Zagorsky, J. L. (1996), ‘The effect of definitional differences on us and
cana-dian unemployment rates’,Canadian Business Economics4, 13–21.
H
et
er
og
en
ei
ty
in
th
e
L
ab
or
M
ar
ke
t
3
7
1
2003 2004 2005 2006 2007 2008
1st 2nd 3rd 4th 1st 2nd 3rd 4th 1st 2nd 3rd 4th 1st 2nd 3rd 4th 1st 2nd 3rd 4th 1st 2nd 3rd 4th
Transitions to employment
E E 95.3 95.3 95.6 95.9 95.6 95.9 95.8 96.2 96.2 96.3 96.6 96.6 96.2 95.8 96.1 96.2 96.3 96.4 96.3 96.3 96.0 96.2 96.1 96.1
U E 23.1 23.0 24.8 21.8 23.4 23.1 22.7 19.0 19.9 20.1 19.1 17.9 20.6 21.0 21.6 20.9 19.5 19.8 22.0 18.9 25.0 21.9 22.4 20.1
N E 5.9 5.7 5.6 4.9 5.3 5.4 5.3 4.8 4.8 4.9 4.8 4.3 4.6 5.4 5.1 4.8 4.5 4.9 5.1 4.7 5.3 5.3 5.2 4.9
M E 20.0 22.1 21.9 21.6 22.0 21.6 22.5 19.1 22.7 18.3 20.4 18.3 18.7 20.6 21.1 18.7 20.5 18.7 19.4 17.6 24.5 21.8 23.6 17.6
Transitions to unmployment
E U 1.5 1.6 1.5 1.2 1.5 1.4 1.3 0.9 1.1 0.9 0.8 0.8 1.0 1.1 1.0 0.8 0.9 0.8 0.8 0.7 0.8 0.8 0.9 0.8
U U 53.6 56.1 54.3 55.8 55.9 53.2 54.9 54.0 56.3 54.5 57.1 55.1 54.8 54.7 57.4 56.6 56.8 56.3 55.0 52.5 50.3 49.5 54.4 52.1
N U 2.2 2.5 2.4 1.8 2.1 2.0 1.9 1.5 1.8 1.5 1.5 1.3 1.5 1.9 1.5 1.2 1.5 1.4 1.6 1.2 1.4 1.4 1.3 1.3
M U 28.6 27.5 27.6 26.8 28.4 23.9 24.3 22.9 24.4 26.4 26.3 23.0 27.2 23.4 24.2 21.6 22.1 24.4 22.5 19.4 23.3 21.2 20.8 24.2
Transitions to no attachment
E N 2.6 2.5 2.3 2.2 2.3 2.1 2.3 2.1 2.2 2.3 2.0 2.0 2.3 2.5 2.3 2.5 2.3 2.3 2.5 2.5 2.7 2.6 2.6 2.5
U N 14.2 12.3 11.6 12.8 12.2 14.0 11.3 15.1 14.1 14.4 11.9 14.0 13.8 13.7 11.2 12.7 14.0 13.3 13.2 16.7 15.3 16.4 12.4 16.2
N N 90.3 90.4 90.5 91.9 91.1 90.9 91.2 92.4 92.5 92.3 92.5 93.2 92.7 91.3 92.3 92.8 92.8 92.7 92.2 92.9 92.2 92.3 92.6 92.9
M N 22.2 24.5 24.8 24.6 23.5 23.6 24.5 25.8 22.9 24.3 22.3 24.1 23.9 25.5 21.1 24.8 26.5 24.7 28.0 26.0 26.5 27.9 25.4 27.8
Transitions to marginally attachment
E M 0.6 0.6 0.5 0.8 0.6 0.5 0.7 0.5 0.7 0.5 0.6 0.8 0.7 0.5 0.7 0.6 0.7 0.7 0.7 0.5 0.6 0.6 0.7 0.8
U M 9.2 8.5 9.2 9.7 8.5 9.7 11.2 11.9 9.8 11.1 11.9 13.0 10.8 10.7 9.8 9.7 9.7 10.6 9.8 11.9 9.4 12.2 10.8 11.6
N M 1.6 1.4 1.5 1.3 1.4 1.6 1.6 1.3 1.0 1.3 1.2 1.3 1.1 1.5 1.1 1.2 1.2 1.0 1.2 1.1 1.1 1.0 0.9 0.9
M M 29.2 25.9 25.7 27.0 26.0 30.9 28.7 32.2 30.0 31.0 31.1 34.6 30.2 30.5 33.6 34.8 30.9 32.2 30.1 37.0 25.7 29.1 30.3 30.5
A
gu
as
,
P
er
o
an
d
R
ib
ei
ro
E
co
n
om
ia
A
p
lic
ad
a,
v.1
8
,
n
.3
Table A.2: Transition rates for men (%) between employment (E), unemployment (U), non attachment (N) and marginal attachment (M) from the 1st quarter of 2003 to the 4th quarter of 2008.
2003 2004 2005 2006 2007 2008
1st 2nd 3rd 4th 1st 2nd 3rd 4th 1st 2nd 3rd 4th 1st 2nd 3rd 4th 1st 2nd 3rd 4th 1st 2nd 3rd 4th
Transitions to employment
E E 96.1 95.9 96.1 96.4 96.2 96.5 96.3 96.9 96.9 96.9 97.2 97.3 96.9 96.6 96.8 96.9 97.0 97.2 97.2 97.1 97.0 96.9 96.9 97.1
U E 26.7 26.6 29.5 27.1 27.7 28.1 28.8 23.7 24.2 25.0 22.7 21.1 23.7 24.7 24.8 24.4 22.2 24.1 25.5 23.4 29.2 26.8 27.4 26.1
N E 7.6 6.8 7.0 6.2 6.5 7.0 6.7 5.9 5.6 5.9 5.9 4.8 5.7 6.6 5.9 6.0 5.4 5.7 5.8 5.5 6.1 6.0 6.1 5.3
M E 24.9 27.2 27.0 26.0 26.9 25.7 31.0 23.6 27.7 23.4 23.5 23.5 23.8 25.9 28.2 22.0 28.1 22.9 25.1 21.1 30.2 26.5 29.9 23.7
Transitions to unmployment
E U 1.4 1.6 1.5 1.2 1.5 1.3 1.2 0.9 1.0 0.8 0.7 0.7 1.0 1.1 0.9 0.8 0.9 0.7 0.7 0.6 0.7 0.7 0.8 0.7
U U 53.9 55.7 52.6 55.1 55.2 52.9 52.6 54.9 55.6 53.9 57.3 56.9 55.9 55.7 58.4 56.9 57.7 55.2 54.5 54.5 49.1 49.2 55.0 53.3
N U 2.7 2.7 2.4 1.7 2.0 1.9 1.8 1.5 1.8 1.6 1.4 1.3 1.5 1.9 1.3 1.1 1.5 1.6 1.3 1.2 1.2 1.4 1.4 1.2
M U 30.6 29.6 28.2 29.8 29.2 23.4 23.7 25.9 25.1 26.5 29.1 24.4 29.8 26.6 22.3 24.6 22.9 26.2 23.2 20.3 25.2 25.4 19.1 21.7
Transitions to no attachment
E N 2.0 1.9 1.7 1.8 1.7 1.6 1.9 1.6 1.7 1.8 1.6 1.4 1.7 1.8 1.9 1.8 1.7 1.7 1.8 1.9 1.9 1.9 1.9 1.8
U N 11.7 10.0 8.9 10.0 9.9 11.0 8.5 10.7 11.1 11.3 9.4 10.9 10.5 10.9 8.7 10.2 11.7 11.0 10.9 11.5 12.9 11.9 8.3 12.2
N N 88.0 89.1 89.1 90.7 89.9 89.4 90.2 91.5 91.6 91.2 91.5 92.7 91.7 90.0 91.9 91.8 92.2 91.8 92.0 92.5 91.7 91.8 91.7 92.8
M N 19.6 20.4 21.0 19.0 20.7 20.3 20.1 21.3 16.8 21.3 18.1 23.1 21.6 19.4 17.4 21.2 20.3 21.0 23.7 20.6 21.9 20.8 19.9 23.5
Transitions to marginally attachment
E M 0.5 0.5 0.5 0.7 0.6 0.4 0.7 0.5 0.6 0.5 0.6 0.6 0.6 0.5 0.7 0.5 0.5 0.7 0.6 0.4 0.6 0.5 0.7 0.7
U M 7.7 7.7 9.0 7.8 7.2 8.0 10.1 10.8 9.0 9.7 10.6 11.0 9.9 8.7 8.1 8.6 8.4 9.6 9.1 10.6 8.8 12.1 9.2 8.4
N M 1.7 1.4 1.5 1.4 1.6 1.7 1.3 1.1 1.0 1.3 1.1 1.3 1.1 1.4 0.9 1.0 0.9 0.9 0.9 0.9 0.9 0.8 0.7 0.7
M M 24.9 22.9 23.8 25.2 23.3 30.6 25.2 29.2 30.3 28.8 29.3 29.1 24.7 28.2 32.0 32.2 28.7 29.9 28.0 38.1 22.7 27.3 31.0 31.5
H
et
er
og
en
ei
ty
in
th
e
L
ab
or
M
ar
ke
t
3
7
3
2003 2004 2005 2006 2007 2008
1st 2nd 3rd 4th 1st 2nd 3rd 4th 1st 2nd 3rd 4th 1st 2nd 3rd 4th 1st 2nd 3rd 4th 1st 2nd 3rd 4th
Transitions to employment
E E 92.9 93.4 93.8 94.4 93.7 94.2 94.2 94.3 94.1 94.7 95.0 94.8 94.1 93.8 94.4 94.2 94.6 94.3 93.9 94.2 93.3 94.2 94.0 93.8
U E 16.3 16.0 16.4 13.0 16.6 15.4 13.8 12.8 13.8 13.7 14.4 13.9 16.8 15.9 17.3 16.1 16.0 14.4 18.4 13.9 20.3 16.4 17.4 14.6
N E 4.5 4.6 4.4 3.8 4.3 4.0 4.1 3.9 4.0 4.0 3.9 3.8 3.8 4.3 4.5 3.9 3.9 4.3 4.5 4.1 4.6 4.7 4.4 4.5
M E 14.1 15.5 15.4 15.7 16.9 16.5 13.7 13.9 17.0 13.0 17.0 13.5 14.4 16.0 14.3 15.3 14.1 14.4 14.4 14.4 19.8 17.8 17.5 12.2
Transitions to unmployment
E U 1.7 1.3 1.6 1.2 1.5 1.5 1.4 0.1 1.4 1.0 1.0 0.9 1.1 1.1 1.2 0.9 1.0 1.1 1.1 1.0 1.1 1.0 1.1 1.1
U U 52.9 56.9 57.4 56.8 57.1 53.7 58.1 52.7 57.3 55.2 56.8 52.9 53.4 53.3 56.1 56.3 55.6 57.7 55.6 50.4 51.5 49.8 53.7 51.1
N U 1.8 2.2 2.5 2.0 2.2 2.0 2.0 1.6 1.7 1.5 1.6 1.4 1.5 1.9 1.6 1.3 1.6 1.2 1.8 1.3 1.5 1.4 1.3 1.4
M U 26.3 24.7 26.8 22.9 27.6 24.6 24.9 19.5 23.5 26.4 23.1 21.7 25.0 20.5 25.9 18.4 21.5 22.6 21.9 18.7 21.7 17.5 22.3 26.3
Transitions to no attachment
E N 4.7 4.4 4.0 3.6 3.9 3.4 3.7 3.7 3.7 3.5 3.2 3.4 4.0 4.3 3.6 4.2 3.7 3.9 4.4 4.2 4.8 4.2 4.3 4.3
U N 18.9 16.8 16.6 17.4 15.9 18.5 15.3 21.0 18.1 18.3 15.1 17.7 17.9 17.4 14.4 16.2 17.0 16.0 15.6 22.5 17.9 21.5 16.5 19.8
N N 92.2 91.7 91.7 93.0 92.2 92.4 92.0 93.1 93.2 93.3 93.4 93.6 93.5 92.3 92.6 93.5 93.2 93.5 92.3 93.2 92.6 92.7 93.2 93.0
M N 25.3 29.9 29.7 31.9 26.6 27.7 29.0 31.0 29.8 27.4 26.8 25.1 25.8 31.0 24.7 28.6 31.6 28.4 31.7 30.9 30.3 34.2 30.7 31.5
Transitions to marginally attachment
E M 0.9 0.9 0.5 1.1 0.7 0.9 0.7 0.6 0.7 0.6 0.6 1.1 0.9 0.8 0.7 0.7 1.0 0.8 0.8 0.7 0.7 0.8 0.7 1.1
U M 11.9 10.3 9.6 12.9 10.4 12.4 12.8 13.5 10.9 12.8 13.7 15.5 11.9 13.4 12.1 11.4 11.4 11.9 10.5 13.2 10.2 12.3 12.4 14.5
N M 1.5 1.4 1.4 1.3 1.3 1.6 1.9 1.4 1.0 1.2 1.2 1.3 1.2 1.5 1.3 1.3 1.4 1.0 1.4 1.4 1.2 1.2 1.1 1.1
M M 34.3 29.9 28.1 29.4 28.9 31.2 32.4 35.6 29.6 33.2 33.0 39.8 34.9 32.5 35.1 37.6 32.8 34.6 31.9 36.0 28.3 30.6 29.5 29.9
3 7 4 A gu as , P er o an d R ib ei ro E co n om ia A p lic ad a, v.1 8 , n .3 Variables
Total Men Women
Unrestricted Restricted Unrestricted Restricted Unrestricted Restricted
Model Model Model Model Model Model
Years of Schooling:
Between 1 and 3 years 0.0784
(0.08) (0.06)0.0682 (0.11)0.203 (0.09)0.228 0.113(0.13) (0.10)0.172
Between 4 and 7 years 0.0137
(0.07) (0.06)0.0278 (0.10)0.223 (0.08)0.24 0.322(0.12) (0.09)0.303
Between 8 and 10 years 0.0275
(0.08) (0.06)0.0718 (0.11)0.265 (0.08)0.316 0.339(0.12) (0.09)0.287
11 or more years 0.195
(0.07) (0.06)0.232 (0.10)0.621 (0.08)0.647 0.385(0.12) (0.09)0.308
Female 1.177
(0.03) (0.02)1.159 - - -
-White −0.0318
(0.03) −(0.02)0.0163 −(0.04)0.0496 −(0.03)0.0129 −(0.04)0.000362 −(0.03)0.0106
Age −0.113
(0.01) −(0.01)0.101 −(0.01)0.0814 −(0.01)0.0746 −(0.01)0.105 −(0.01)0.0914
Age Squared 0.00185
(0.00) (0.00)0.00169 (0.00)0.00163 (0.00)0.00153 −(0.00)0.00153 −(0.00)0.00137
Marginally Attached −0.0422
(0.30) - (0.44)0.171 - -
-Interactions with the Marginally Attached:
Between 1 and 3 years −0.0531
(0.13) - (0.18)0.0165 - 0.144(0.20)
-Between 4 and 7 years 0.00771
(0.11) - (0.16)0.00686 - −(0.18)0.0331
-Between 8 and 10 years 0.0878
(0.12) - (0.17)0.11 - −(0.18)1.105
-11 or more years 0.123
(0.12) - (0.16)0.0998 - −(0.18)0.22
-Female −0.128
(0.05) - - - 0.346(0.43)
-White 0.0793
(0.05) - (0.07)0.137 - −(0.07)0.0122
-Age 0.0342
(0.01) - (0.02)0.0225 - −(0.02)0.0386
-Age Squared −0.000492
(0.00) - −0.000366(0.00) - 0.000482(0.00)
-Constant 0.256
(0.19) (0.15)0.21 −(0.28)0.917 −(0.21)0.876 −(0.28)2.041 −(0.21)1.907
Observations 33557 33557 18595 18595 14962 14962
Log Likelihood −20676 −20895 −10717 −10841 −9870 −9967
H
et
er
og
en
ei
ty
in
th
e
L
ab
or
M
ar
ke
t
3
7
5
Variables
Total Men Women
Unrestricted Restricted Unrestricted Restricted Unrestricted Restricted
Model Model Model Model Model Model
Years of Schooling:
Between 1 and 3 years −0.12
(0.07) −(0.05)0.0456 −0.25(0.09) −(0.08)0.166 −0.00572(0.09) (0.08)0.0812
Between 4 and 7 years −0.0889
(0.06) −(0.05)0.0315 −0.24(0.09) −(0.07)0.158 0.0347(0.09) (0.07)0.0924
Between 8 and 10 years 0.0442
(0.06) (0.05)0.142 −0.0563(0.09) (0.07)0.0785 0.12(0.09) (0.07)0.198
11 or more years 0.138
(0.06) (0.05)0.286 0.0477(0.08) (0.07)0.214 0.198(0.08) (0.07)0.343
Female 0.14
(0.03) (0.02)0.121 - - -
-White −0.186
(0.03) −(0.02)0.192 −0.145(0.04) −(0.03)0.169 −(0.04)0.223 −(0.03)0.215
Age −0.00145
(0.01) (0.01)0.0281 0.0158(0.01) (0.01)0.0414 0.000818(0.01) (0.01)0.0289
Age Squared −0.000547
(0.00) −0.000857(0.00) −0.000651(0.00) −0.000928(0.00) −0.000658(0.00) −(0.00)0.00096
Marginally Attached −0.204
(0.27) - 0.161(0.38) - -
-Interactions with the Marginally Attached:
Between 1 and 3 years 0.15
(0.12) - 0.229(0.16) - 0.117(0.19)
-Between 4 and 7 years 0.161
(0.11) - 0.303(0.14) - 0.0422(0.17)
-Between 8 and 10 years 0.23
(0.11) - 0.42(0.15) - 0.0205(0.18)
-11 or more years 0.392
(0.11) - 0.578(0.14) - 0.192(0.18)
-Female 0.231
(0.05) - - - −0.0414(0.40)
-White 0.113
(0.05) - 0.0625(0.06) - 0.172(0.07)
-Age −0.00504
(0.01) - −0.0232(0.02) - 0.00426(0.02)
-Age Squared 0.000534
(0.00) - 0.000704(0.00) - 0.000411(0.00)
-Constant 0.294
(0.15) −(0.12)0.146 −0.184(0.23) −(0.17)0.511 0.489(0.21) (0.17)0.0657
Observations 46836 46836 24311 24311 22525 22525
Log Likelihood −25913 −26996 −13108 −13666 −12786 −13309
0 5 10 15 20 25 30 35
1st 2nd 3rd 4th 1st 2nd 3rd 4th 1st 2nd 3rd 4th 1st 2nd 3rd 4th 1st 2nd 3rd 4th 1st 2nd
2003 2004 2005 2006 2007 200
%
UE NE ME
Source: Elaborated by the authors based on the PME microdata for 2003 to 2008.
Figure A.1: Quarterly transition rates to unemployment for men
0 10 20 30 40 50 60 70
1st 2nd 3rd 4th 1st 2nd 3rd 4th 1st 2nd 3rd 4th 1st 2nd 3rd 4th 1st 2nd 3rd 4th 1st 2nd
2003 2004 2005 2006 2007 200
%
UU NU MU
Source: Elaborated by the authors based on the PME microdata for 2003 to 2008.
0 10 20 30 40 50 60 70 80
90 100
1st 2nd 3rd 4th 1st 2nd 3rd 4th 1st 2nd 3rd 4th 1st 2nd 3rd 4th 1st 2nd 3rd 4th 1st 2nd
2003 2004 2005 2006 2007 200
%
UN NN MN
Source: Elaborated by the authors based on the PME microdata for 2003 to 2008.
Figure A.3: Quarterly transition rates to unemployment for men
0 5 10 15 20 25
1st 2nd 3rd 4th 1st 2nd 3rd 4th 1st 2nd 3rd 4th 1st 2nd 3rd 4th 1st 2nd 3rd 4th 1st 2nd
2003 2004 2005 2006 2007 200
%
UE NE ME
Source: Elaborated by the authors based on the PME microdata for 2003 to 2008.
0 10 20 30 40 50 60 70
1st 2nd 3rd 4th 1st 2nd 3rd 4th 1st 2nd 3rd 4th 1st 2nd 3rd 4th 1st 2nd 3rd 4th 1st 2nd
2003 2004 2005 2006 2007 200
%
UU NU MU
Source: Elaborated by the authors based on the PME microdata for 2003 to 2008.
Figure A.5: Quarterly transition rates to unemployment for women
0 10 20 30 40 50 60 70 80
90 100
1st 2nd 3rd 4th 1st 2nd 3rd 4th 1st 2nd 3rd 4th 1st 2nd 3rd 4th 1st 2nd 3rd 4th 1st 2nd
2003 2004 2005 2006 2007 200
%
UN NN MN
Source: Elaborated by the authors based on the PME microdata for 2003 to 2008.