SOCIAL INTERACTIONS OF MIGRANTS AND TRADE
OUTCOMES
Silvio H. T. Tai*
Resumo
Esse artigo analisa o impacto das interações sociais desenvolvidas por imigrantes no comércio bilateral das regiões francesas. Utiliza-se dados da distribuição dos imigrantes nas 95 microrregiões francesas (“départe-ment” em francês) em cinco anos para a implementação de uma medida direta do impacto das interações sociais na economia. Comparações di-retas confirmam que essa medida é mais completa e robusta do que as medidas usadas na literatura de comércio internacional.
Palavras-chave:Interação social; Comércio internacional; Migração.
Abstract
This paper investigates the impact of social interactions with immi-grants on bilateral trade in French regions. Applying data on the distribu-tion of immigrants in 95 French counties (“départment” in French) during 5 years, a measure of formation of networks is proposed and its impact is tested on international trade, providing a direct measure of the impact of social interactions on the economy. Direct comparisons confirm this mea-sure as more complete and robust than meamea-sures used in international trade literature.
Keywords:Social Interaction; International Trade; Migration. JEL classification:F10, F22.
DOI:http://dx.doi.org/10.1590/1413-8050/ea495
*RITM - University Paris XI Sud, France and Pontifical Catholic University of Rio Grande do Sul,
Brazil. E-mail: [email protected]
1
Introduction
Social networks provide a major explanation for the impact immigrants have on international trade.1 This mechanism relies on two fundamental concepts. Firstly, immigrant communities have the potential to deter violations of infor-mal contracts. Secondly, immigrants benefit from privileged information on home-country and host-country markets.
These interactions are better understood if one considers that newly ar-rived immigrants benefit from a settled compatriot’s community, since they face barriers of language, habits and culture. Work, loans, associates and re-lationships can be found in such community. Specifically, business opportu-nities can rise in this context, since market information from both home and host countries is available within the community.
Rauch (1999) points out to the importance for proximity on network con-tacts. Herander & Saavedra (2005) verify if proximity matters for interactions between community’s members residing in the same host country. By analyz-ing exports in American states, they found that both local immigrants (those living in the exporting state) and nonlocal immigrants (those living in other states) have an impact on exports. Nonetheless, local populations of immi-grants have stronger impact on state exports than do nonlocal immiimmi-grants, indicating that network effects decrease with distance.
The nature of those interactions, depending in the proximity, is observed in the geographical concentration of foreigners, compared to natives (Bartel 1989). Such interdependence factors are reflected in the distribution of peo-ple. Immigrants have a tendency to cluster at higher densities relative to local population. Figure 1 shows the overconcentration of immigrants in France, in comparison with the French population as a whole: 70% of the foreign pop-ulation2 more concentrated than the French population. While there may be specific reasons for that locally, in the region, they do not provide a complete explanation for the overconcentration of immigrants.
This paper investigates the effect between social interactions of immigrants
on international trade. Considering the international trade in a certain French region (with a given country), a network’s functional form is proposed by counting all immigrants (from this given country) living in France, but taking into account that these effects are a decreasing function of the distance. For
instance, it is assumed that a Portuguese in Lyon can contribute to the trade between Portugal and Paris, even if to a lesser extent than could a Portuguese in Paris.
This paper is structured as follows. Section 2 describes the dataset and the variables used. Section 3 reports on the findings before some tentative conclusions are drawn in section 4.
1See Rauch (2001) and Wagner et al. (2002) for a synthesis of literature on the impact of
immigration on trade
1 2 3 4 5 6 7 8 9 10 11 12 13 14 15 16 17
18 19 20 21 22 23 24 25 26 27 28 29 30 31 32 33 34 35 36 37 38
39 4041
42 43 44 45 46 47
48 50 49
51 52 53 54 55 56 57 58 59 60 61 62 63 64 65 66 67 68 69 70 71 72 73 74 75 76 77 78 79 80 81 82 83 84 85 86 8788 89 90 91 92 93 94 95 0 .02 .04 .06 .08
Share of Foreigners in France
0 .01 .02 .03 .04 .05 Share of Overall French Population
This graph compares the total population of foreigners in France to the total French population. Data is from the 1999 census. Eg: 8% of all the foreigners living in France resided in Paris (coded 75) compared to only 3% of the French population, in this year
Figure 1: Foreigners share versus French share, by French ”département”
2
Data and Variables Conception
The migration data used herein derives from the 1968, 1975, 1982, 1990 and 1999 French census. These provide information on the stock of immigrants living in each of the 95 French metropolitan “départements” in those particu-lar years. Total French populations are obtained from Insee (Institut National de la Statistique et des Etudes Economiques).3
Figures 1, 2 and 3 detail, in order, the spatial distribution of the total pop-ulation in each French “département”, the total poppop-ulation of immigrants, immigrants from Portugal, Morocco, Algeria, Italy, Spain, Germany, United Kingdom, and Senegal.4
Focusing on economic factors, two types of behavior may be expected from immigrants. Typically, they may target places with intense economic activities and, in that case, present a distribution similar to the whole population in the country; or they may form a population cluster in richer places. However, several other factors can determine the distribution of these immigrants, such as historical factors, amenities and proximity to home country. For example, Spanish immigrants settle closer to Spain, as do Italians to Italy. German people settle close to Alsace and Lorraine, following historical ties. These evaluations are clear cut in the econometric analysis.
Nonetheless, it is interesting to notice that immigrants present very un-even distribution not only when compared to the total population but also between immigrant populations themselves. On the one hand, regions with
3French institute of statistics. Source: http://www.insee.fr/fr/themes/tableau.
asp?ref_id=NATnon02145®_id=0
(a) All Immigrants - 1968 (b) All Immigrants - 1999
3 921 240 people 5 617 193 people
(c) Portugal - 1968 (d) Portugal - 1999
313 372 people 788 737 people
(e) Morocco - 1968 (f) Morocco - 1999
96 728 people 725782 people
Figure 2: Geographical Distribution of Immigrants in France - All
(a) Algeria - 1968 (b) Algeria - 1999
473 812 people 685 558 people
(c) Italy - 1968 (d) Italy - 1999
1 049 620 people 573 161 people
(e) Spain - 1968 (f)Spain - 1999
843 436 people 435 828 people
Figure 3: Geographical Distribution of Immigrants in France - Algeria, Italy
(a) Germany - 1968 (b) Germany - 1999
107 960 people 435 738 people
(c) United Kingdom - 1968 (d) United Kingdom - 1999
27 956 people 93 459 people
(e) Senegal - 1968 (f) Senegal - 1999
6 472 people 59 301 people
intensive economic activities or rich regions seem to be preferred. On the other hand, immigrants seem to agglomerate and the first enclaves appear, over time, to determine the compatriots’ location in a very robust way, even in areas that do not present economic attractiveness.
The maps in figures 1, 2 and 3 provide graphic evidence of the over-concen-tration phenomenon approached in the introduction and addressed by the literature (Chiswick & Miller 2004, Chiswick et al. 2002, Funkhouser 2000, Gonzalez 1998, Carrington et al. 1996). Immigrants do not pursue exclusively economic opportunities, as they also form communities.
For example immigrants from Senegal settled mainly in Paris and in the Seine-Maritime (North West of Paris) in 1968. Thirty-one years later other communities were formed, but those two agglomerations gave origin to a large network of compatriots. It is impressive how many new immigrants are set-tled in this region when we compare to all other distributions.
Data on French trade on regional level is available5from the French Min-istry of Ecology, Energy, Sustainable Development and Town and Country Planning.6 The data is available online for a restricted sample of countries from 2003 to 2004. Namely, these countries are Australia, Austria, Belgium, Cyprus, Czech Republic, Denmark, Estonia, Finland, Germany, Greece, Hun-gary, Ireland, Lithuania, Latvia, Malta, The Netherlands, Poland, Portugal, Slovakia, Spain, Sweden, Switzerland and the United Kingdom. The year 2004 is chosen for this study as it is close to the year 1999, which is the last year that migration data is available for France and it is also a more complete dataset compared to 2003.
Geographical variables such as “common border” (a dummy variable set to 1 for pairs of countries that share a border) and “common language” (dum-mies equal to one if both partners share a language) are extracted from the CEPII database.7
The data on Gross Domestic Product and national population are taken from the World Bank’s “World Development Indicators”.
3
Results
The potential social interaction of an individual of nationalityk living in re-gioni can be defined by:
Sik=ln
J X
j
skj
dij
(1)
where:
dijis the distance between region i and region j, and I assumedij=1, sjis the share of immigrants of nationalitykliving in regionj.
For the sake of clarity time subscripts are omitted. This section combines trade data (available on regional level) and immigration data (available on “department” level); therefore geographic location is referred to by the word “region”, responding to either a French “département” or region.
5http://www.statistiques.equipement.gouv.fr/rubrique.php3?
id_rubrique=402
6Ministère de I’Écologie, de l’Energie, du Développement durable et de l’Aménagement du
territoire
This social component is based on the actual share of resident compatri-ots in French regions at a specific point in time. Assuming the inverse rela-tionship between distance and social interaction, each region’s share of im-migrants in France is counted in this variable weighting the inverse of the distance between the trading region and the region where he or she lives. Im-migrants living the trading region are weighted by distance equals to one. The choice to use the inverted distance follows the same functional form of many applications in economics that decreases with the distance, such as the market potential.
The estimate gravity equation of trade between countryk and French re-gioni is:
ln(T radekt) =α0+α1Sik+α2ln(distki) +α3FEk+α4FEi (2)
where
distkjis the distance between countrykand French regioni FEare fixed effects for countrykand French regioni
Table 1 reports results from a trade analysis. These regressions follow the last advancements in trade literature. The Poisson Pseudo Maximum Likeli-hood estimator is applied (Santos Silva & Tenreyro 2006, Anderson & Win-coop 2003) and specific country and region effects are controlled by fixed
ef-fects. Exports and imports are regressed separately.
Regression (1) and (2) estimates the impact of the Compatriot’s Network on exports and imports, respectively. In these regressions, the distance shows an expected coefficient (Disdier & Head 2008). The immigrants’ network
presents a positive impact on trade. Its coefficient is significant at 1%
sig-nificance level. The impact of migration on imports is higher than the impact on exports. An increase by 10% in the national stock of immigrants raises exports by 6.7% and imports by 11.2%.
Literature does not converge in this qualitative result. While Head & Ries (1998) and Wagner et al. (2002) find a more important impact of migration on imports than on exports, Gould (1994) and Girma & Yu (2002) find the opposite.8
Two explanations are commonly presented for higher effects of migration
on imports. Firstly, immigrants may prefer consuming products from their home country (Head & Ries 1998), thus, besides the network effect
(impact-ing both flows), this “preference” effect would only impact imports. Yet, it is
assumed the network effect is both symmetric for imports and exports.9
Secondly, imports and exports are composed differently, according to the
degree of differentiation of goods (Rauch & Trindade 2002, Tai 2009) and the
effect of networks is sensitive to this variation. Yet, this bias can be inverted
and also justify higher effects of migration on exports than on imports.10
A third explanation can be added to this study. A firm can somehow cen-tralize its imports in a given county in France and then redistribute them to other counties. In this case the network variable would also capture direct
8See Tai (2009), pp 228-229 for a discussion of these different results.
9For supporting higher effects of migration on imports through preference channel, the im-pact of networks may also be smaller to imports than to exports.
consumption. In the three cases above, results can be upward biased for im-port regressions, and a measuring cannot be provided for the bias influence. Nonetheless, the effect of migration is also very significant on exports, which
provides evidence of the existence of the network effect on trade.
Regressions (3) and (4) apply the instrumental variable method. They cor-rect for a potential endogeneity between trade flows and migration. The bias is already mitigated by the use of Immigrant’s stock instead of flows. How-ever, the instrumental variable with lag of 8 years can offer a more accurate
result. Coefficients are positive and significant at the 99% confidence level.
Magnitudes rarely change and the coefficient for imports remains higher than
the coefficient for exports. A 10% growth in the national stock of immigrants
increases exports by 8.5% and imports by 16.6%.
Regressions (5) to (10) provide a comparison to other studies on the im-pact of migration on trade. Regressions (5) to (8) introduce the quantity of compatriots living in the reference region. It is exactly the approach typically used in this kind of literature: the total quantity of immigrants living in a country determines the bilateral trade of the country. From this estimation it is clear that this kind of procedure is missing a key part. In columns (5) and (6) the stock of migrants presents a non-significant coefficient when the
Com-patriot’s Network is controlled. This means the network variable incorporates more information than the stock variable. Regressions (7) and (8) do not con-trol the Compatriot’s Network. Even in this case, coefficients are smaller than
the network ones.
Regressions (9) and (10) apply the quantity of compatriots living in regions that share a common border. This approach is very close to that of Herander & Saavedra (2005).11 It is possible to see this variable is only significant to imports at a 5% significance level. In contrast, the Compatriot’s Network vari-able remains significant at 1% significance level for exports and imports. Yet again, the method for counting immigrants’ network proposed in this study seems to give better explanation of the impact of these networks on trade.
3.1 Discussion
These results seem to confirm the strength of social interdependences and the existence of interactions even at distance. If new immigrants counted on set-tled compatriots’ community for their installation in a host country, then net-works would also have an impact on the location of foreigners. The remainder of this subsection corroborates this effect.
A first issue in the empirical analysis is the control of agglomeration forces other than social interactions. For example, Paris is a very centralizing city in France, as confirmed by many studies cited in section 2. Exogenous economic factors or some amenities could explain the massive concentration of immi-grants in this region. The control featured herein considers origin country fixed effects interacting with years of fixed effect.
Discrete choices as those of immigrants for any French region are fre-quently estimated with a multinomial logit estimator. Instead, this work agrees with Guimarães et al. (2003), which shows that the Poisson estimator
11Unlike Herander & Saavedra (2005) all out-of-region immigrants were not considered, but
T ai E co n om ia A p lic ad a, v.1 8 , n .4
Table 1: Trade Regressions
Regression Dependent
Variable (1) Exports (2) Imports (3) Exports (4) Imports (5) Exports (6) Imports (7) Exports (8) Imports (9) Exports (10) Imports
Specification PPML PPML-IV
Ln Compatriots’ Net 0.67∗∗∗
(0.14) 1.12
∗∗∗
(0.19) 0.85
∗∗∗
(0.24) 1.66
∗∗∗
(0.40) 0.97
∗∗
(0.40) 1.96
∗∗∗
(0.72) 0.81
∗∗∗
(0.28) 1.28
∗∗∗
(0.46) Ln Immig Stk within
Region −
0.06
(0.13) −(00..24)15 0.17
∗∗
(0.07) 0.39
∗∗∗
(0.13)
Ln Immig Stk
Neigh-boring Regions (00..15)04 0.68
∗∗
(0.29)
Ln Distance −0.46∗∗∗
(0.08) −0.47
∗∗∗
(0.16) −0.77
∗∗∗
(0.12) −0.49
∗∗
(0.19) −0.79
∗∗∗
(0.12) −0.54
∗∗∗
(0.19) −0.86
∗∗∗
(0.12) −0.64
∗∗∗
(0.18) −0.76
∗∗∗
(0.13) −(00.25).129 Constant 11.46∗∗∗
(0.76) 14.34
∗∗∗
(1.00) 14.78
∗∗∗
(1.39) 18.22
∗∗∗
(3.13) 15.73
∗∗∗
(2.81) 20.66
∗∗∗
(4.98) 10.24
∗∗∗
(1.39) 6.18
∗∗∗
(2.23) 6.77
∗∗∗
(1.87) 14.36
∗∗∗
(2.69)
Observations 525 523 525 523 525 523 525 523 525 523
provides the same coefficient and log-likelihood of multinomial logit,
avoid-ing problems with non-linearity. Then the estimate equation is:
qtij=exp
β1
J X
j,r
ln
qt−1
ir djr
+β2ln(distanceij) +
Ωjt+Ωit+Mills+cte
(3) where:
qijt is the quantity of immigrants from countryisettling in French “départ-ment”jin timet,
PJ
j,rln
qt−1
ir djr
is the sum of settled immigrants in the previous period, weighted
by the inverse of the distance (excluding those living in regionj),
distanceijis the distance between countryiand French “départment”j,
Ωjt andΩitare fixed effects for region-time and country-time.
This section uses only immigration data (available at “departément” level), therefore geographic location is referred to by the word “département”.
While country of origini may be any country in the world, estinations
“département” j are all restricted to one country, in this case France. This
implies a selection bias since each immigrant who had chosen region j had previously chosen France as a destination country. This bias is corrected by a probit estimator. The variable Mills is the inverse of the Mills ratio which has been estimated from the first stage probit12estimator, following the Heckman (1979) method.
The compatriot’s network is hypothesized to capture the structure that res-ident immigrants can offer to a new one, such as assistance with bureaucracy,
language, housing, employment and business opportunities, access to home produce and leisure. This phenomenon can operate at a distance from one region to another, assuming that the new location is either deemed to be more attractive or less saturated.
Regression (1) verifies the positive impact of the Compatriot’s Network on the immigrant’s location. Even controlling for all specific geographic effects
over time, the quantity and the proximity of pre-existing people from the same nationality determine the distribution of immigrants. This sort of ag-glomeration offers benefits to communication, housing, job and business
pos-sibilities, access to home produce, and leisure. These effects were analyzed by
some recent studies (eg. Chiswick & Miller 2004), pointing to the evidence of a more intense concentration of immigrants, in contrast to concentration of the national population.
Regression (2) introduces country-“département” fixed effects. This method
controls for all effects that are specific to each pairing of a country and
“dé-partement”. Geographical fixed effects are not interacted with time fixed
ef-fects in this regression because of technical limitation. The coefficient of the
network measures the impact within each geographical pair considering just
12The selection variable is the distance between the countries of origin and France. Other
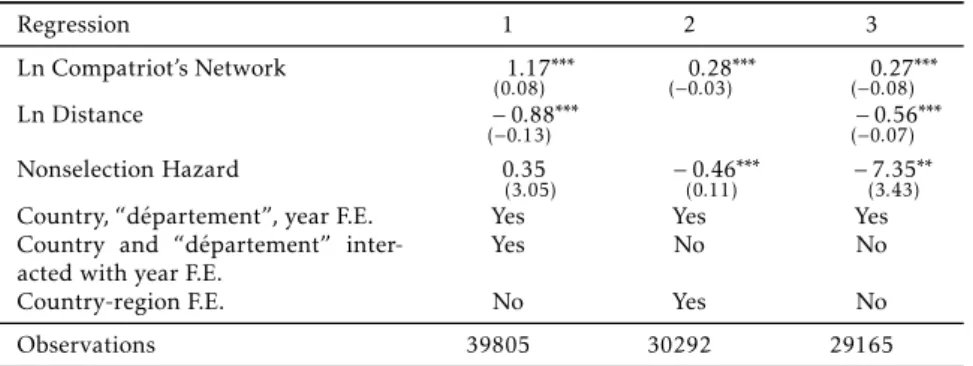
Table 2: Choice of Location by Immigrants
Regression 1 2 3
Ln Compatriot’s Network 1.17∗∗∗
(0.08) 0.28
∗∗∗
(−0.03)
0.27∗∗∗
(−0.08)
Ln Distance −0.88∗∗∗
(−0.13)
−0.56∗∗∗
(−0.07)
Nonselection Hazard 0.35
(3.05) −0.46
∗∗∗
(0.11) −7.35
∗∗
(3.43)
Country, “département”, year F.E. Yes Yes Yes Country and “département”
inter-acted with year F.E.
Yes No No
Country-region F.E. No Yes No
Observations 39805 30292 29165
Note: Robust standard errors in parentheses with∗,∗∗and∗∗∗respectively denoting
significance at the 1%, 5% and 10% levels.
the time variation of the network variable. If the quantity of resident immi-grants of a given nationality, living close to a reference “département”, raise by 10% each year, or if the same quantity concentrates 39.8 km each year (if each immigrant moves 39.8 km closer to the reference “département”), the quantity of immigrants living in the reference “département” raises by 2.8% .
Regression (3) corrects for endogeneity13 applying lagged14 variables for networks with two steps IV method. This regression includes the 16 years lagged variable, which is in fact 24 years lagged to the dependent variable. This period of time is more than enough to control endogeneity, as discussed in the appendix. The coefficient is smaller than before, though still positive
and significant.
Taking column (5), a 10% increase in the network close to a reference partement” implies an increase by 2.7% in the stock of immigrants of this “dé-partement”. These regressions confirm the existence of social interactions of migrants above any specific effect or endogeneity. Immigrants count on
com-patriots’ network when deciding a location in the host country. This natural choice implies economic consequences, since the network assistance includes not only help in the moving process, but also business and job developments.
4
Conclusion
This paper investigates the extent to which social interactions impact inter-national trade, applying data from French census distinguishing immigrants by their nationality, on the “département” level (95 “départements”), for five years.15
These interactions provide business opportunities that are verified by a very significant impact of networks on international trade. Trade of a certain region is determined not only by the social interactions of immigrants within the region, but also by the social interactions of the whole network of immi-grants living in the country. This network measuring is more robust than the measuring drawn from previous research.
13See the appendix to details about the instrumental variable.
14Because data are provided by 1968, 1975, 1982, 1990 and 1990 census, one lag represents 8
years in average.
A function for the role of the distance on social interactions is presented and empirical outputs show that such interactions diminish following the in-verse of the distance between two immigrants. Therefore, an immigrant bene-fits from the compatriot’s network in the destination region and also from the network installed in other regions of the country.
Results also show that the choice of location by an immigrant depends heavily on the residing network from which he or she can benefit, even when destination region, origin country, and time specific factors are controlled.
Agradecimentos
I would like to acknowledge the helpful comments of Amy Bisno, Fabrice De-fever, Frédéric Docquier, Christopher Hearle, Arastou Khatibi, Tobias Müller, Marcelo Olarreaga, Nicolas Maystre, Alissa Petee, Roberta Piermartini, Michele Ruta and the participants of the “Jeunes Chercheurs” Seminar of University of Geneva
Bibliography
Anderson, J. E. & Wincoop, E. V. (2003), ‘Gravity with gravitas: A solution to the border puzzle’,American Economic Review93(1), 170–192.
Bartel, E. P. (1989), ‘Where do the new u.s. immigrants live?’,Journal of Labor
Economics7(4), 371–391.
Carrington, W. J., Detragiache, E. & Vishwanath (1996), ‘Migration with en-dogenous moving costs’,American Economic Review86(4), 909–930.
Chiswick, B. R., Lee, Y. L. & Miller, P. W. (2002), The determinants of the geo-graphic concentration among immigrants: Application to australia. Institute for the Study of Labor (IZA), discussion paper 462.
Chiswick, B. R. & Miller, P. W. (2004), Where immigrants settle in the united states. Institute for the Study of Labor (IZA), discussion paper 1231.
Disdier, A. C. & Head, K. (2008), ‘The puzzling persistence of the distance effect on bilateral trade’,Review of Economics and Statistics90(1), 37–41.
Funkhouser, E. (2000), ‘Changes in the geographic concentration and loca-tion of residence of immigrants’,International Migration Review34(2), 489–
510.
Girma, S. & Yu, Z. (2002), ‘The link between immigration and trade:
Evidence from the united kingdom’, Review of World Economics /
Weltwirtschaftliches Archiv138(1), pp. 115–130.
URL:http://www.jstor.org/stable/40440885
Gonzalez, A. (1998), ‘Mexican enclaves and the price of culture’,Journal of
Urban Economics43, 273–291.
Gould, D. M. (1994), ‘Immigrant links to the home country: Empirical impli-cations for u.s. bilateral trade flows’,The Review of Economics and Statistics 76(2), pp. 302–316.
Guimarães, P., Figueirdo, O. & Woodward, D. (2003), ‘A tractable approach to the firm location decision problem’, Review of Economics and Statistics 85(1), 201–204.
Head, K. & Ries, J. (1998), ‘Immigration and trade creation: Econometric evidence from canada’,The Canadian Journal of Economics / Revue canadienne
d’Economique31(1), pp. 47–62.
URL:http://www.jstor.org/stable/136376
Heckman, J. J. (1979), ‘Sample selection bias as a specification error’,
Econo-metrica: Journal of the econometric societypp. 153–161.
Herander, M. G. & Saavedra, L. A. (2005), ‘Exports and the structure of immigrant-based networks: The role of geographic proximity’,Review of
Eco-nomics and Statistics87(2), 323–335.
Rauch, J. (1999), ‘Network versus markets in international trade’,Journal of
International Economics48, 7–35.
Rauch, J. (2001), ‘Business and social networks in international trade’,
Jour-nal of Economic Literature39, 1177–1203.
Rauch, J. E. & Trindade, V. (2002), ‘Ethnic chinese networks in international trade’,The Review of Economics and Statistics84(1), pp. 116–130.
URL:http://www.jstor.org/stable/3211742
Santos Silva, J. M. C. & Tenreyro, S. (2006), ‘The log of gravity’,Review of
Economics and Statistics88(4), 641–658.
Tai, S. H. T. (2009), ‘Market structure and the link between migration and trade’, Review of World Economics / Weltwirtschaftliches Archiv 145(2), pp. 225–249.
URL:http://www.jstor.org/stable/40441179
Appendix A
A Description of the Instrumental Variables for
determining immigrants’ location
There are two main problems concerning endogeneity. The first one is due to the use of "stocks of immigrants" as a dependent variable. As Figure 4 shows, part of this stock (square in gray) is already present at period t. Thus, the
network variable based on the stocks of neighbor “départements” at t has a reverse causality relationship with the dependent vector. This would lead to over-estimated coefficients for the network variable. Such endogeneity is
cor-rected by the instrumental variable method with the two lags of the network variable. This corresponds to 16 years16and, based on the data, there is no in-tersection between the stock of immigrants att+1 and the stock of immigrants
att−2.17
The second issue is that the network variable does not take into account the stock of immigrants for the reference “départements”. In Figure 4, the network variable does not sum the immigrants living in Paris at the period
t, which could cause an over-estimation by a missing agent. However, since the reverse causality is controlled for, this effect captures the impact of
im-migrants living in the reference “départements” at period t who do not live there at the next period (white square below grey square). Instead, these im-migrants are part of the resident network and should thus be counted. This second issue allows an improvement of the estimation as it partially considers the network within the region.
Another downside related to endogeneity derives from not considering explanatory variables that may have a significant effect. However, this is
mit-igated by using origin and destination fixed effects, which can be interacted
with time fixed effects.
16Migration data is obtained from the French census of 1968, 1975, 1982, 1990 and 1999. Each
lagged variable corresponds to 8 years difference on average.
17This conclusion is made based on data from the Institut National d’Etudes Démographiques,