ISSN 0104-6632 Printed in Brazil
www.abeq.org.br/bjche
Vol. 34, No. 01, pp. 131 - 141, January - March, 2017 dx.doi.org/10.1590/0104-6632.20170341s20150427
Brazilian Journal
of Chemical
Engineering
USE OF A GRIFFITH TUBE TO EVALUATE THE
ANAEROBIC SLUDGE SEDIMENTATION IN A
UASB REACTOR TREATING AN EFFLUENT WITH
LONG-CHAIN FATTY ACIDS
L. A. S. Miranda
1*, A. L. O. Borges
2and L. O. Monteggia
21University of the Sinos Valley, Unisinos, Environmental Sanitation Laboratory, Av. Unisinos, 950, Zip Code: 93022-000, São Leopoldo - RS, Brazil.
Phone/Fax: + 55 (51) 3590 8464 *E-mail:[email protected]
2Institute of Hydraulic Research, Federal University of Rio Grande do Sul, Av. Bento Gonçalves, 9500, Zip Code: 91501-970, Porto Alegre - RS, Brazil.
Phone/Fax: + 55 (51) 3308 6660
E-mail: [email protected]; [email protected]
(Submitted: July 6, 2015 ; Revised: December 29, 2015 ; Accepted: December 30, 2015)
Abstract - This paper proposes to study the sedimentation characteristics of anaerobic sludge, by determining the settling velocity of sludge granules with the Griffith Tube. This is a simple, low-cost method, suitable for use in full-scale treatment plants. The settling characteristics of sludge from two laboratory-scale UASB reactors fed with saccharose and different concentrations of sodium oleate and sodium stereate were evaluated. Addition of fatty acids caused a gradual destabilization of the system, affecting overall performance. The sedimentation profile changed after addition of fatty acids to the synthetic substrate, decreased sedimentation velocity and increased granule diameter. This behaviour was attributed to the adsorption of fatty acids onto the granules, modifying the diameter, shape and density of these bioparticles.
Keywords: Anaerobic process; UASB reactor; Long chain fatty acids; Griffith tube; Sludge settleability.
INTRODUCTION
Anaerobic wastewater treatment biotechnology has been greatly advanced by the development of the upflow sludge bed reactor concept, such as the up-flow anaerobic sludge bed (UASB) (Kim et al., 2001). The success of anaerobic systems is related to their ability to accumulate good settling biomass without the need for a biomass carrier, allowing high solids retention time and process stability with sim-ple and low-cost equipment (Ahn and Speece, 2003), high organic carbon removal and a small footprint (Batstone et al., 2004).
Bacterial aggregation, known as granulation, is one of the important operational factors in anaerobic
strength and settling velocity is necessary for optimal operation of UASB reactors (Hickey et al., 1991). Benefits include high liquid flow and gas upflow rates together with high settling rates (Lettinga and Hulshoff Pol, 1991) and decreased fines generation due to higher strength compared to flocs (Pereboom, 1997).
Numerous studies report the physical, chemical and biological characteristics and factors that affect de-velopment, maintenance and settling of granules during start-up in anaerobic sludge bed reactors (Yu
et al., 2013; Batstone et al., 2004; Li and Yuan, 2002; Quarmby and Forster, 1995; Andras et al., 1989; Hamoda and van den Berg, 1984), comparing granules from full-scale reactors with similar waste-waters (Bhatti et al., 1995), or examining specific properties such as strength (Pereboom, 1997). The temperature and salt concentration dependent density and viscosity changes of water have great impact on the settling velocity of granular sludge, and can be an important reason for the reported troublesome start-up of granular sludge reactors (Winkler et al., 2012). Oleate (C18:1), stearate (C18:0) and palmitate (C16:0) are the major long chain fatty acids (LCFA) constituents in lipid-rich wastes and wastewaters (Battimelli et al., 2010; Valladão et al., 2011). Palatsi
et al. (2012) evaluated the impact of LCFA adsorp-tion on the methanogenic activity in batch assays for two anaerobic granular sludges in the presence and absence of bentonite as synthetic adsorbent. A clear inhibitory effect was observed at an oleate concentra-tion of 0.5 g.L-1. According to Zonta et al. (2013), the cell-membrane seems to be the prime common target for most of the LCFA inhibitory effects on anaerobic biomass described. According to Kim and Gadd (2008), cell-membrane exposure to high concentra-tions of LCFA promotes macromolecular crowding and disruption of mechanisms such as protonmotive-force, DNA-docking and ATP-chemosynthesis. Im-pairment of nutrient uptake or inhibition of specific enzyme activity were also reported (Desbois and Smith, 2010).
According to Thaveesri et al. (1995), the LCFA have an amphiphilic structure composed of a hydro-phobic aliphatic tail and a hydrophilic carboxylic head. In reactors operating with a pH higher than 7, the sludge granules may disintegrate, since the LCFA begin to act as surfactants, lowering the surface ten-sion. In this case, the adhesion of hydrophilic cells appeared to be enhanced at a low liquid surface ten-sion, while the adhesion of hydrophobic cells was favoured at a high surface tension. Daffonchio et al. (1995) observed changes in the hydrophobic charac-teristics of the biomass in anaerobic reactors when
subjected to the presence of surfactants, showing that under operating conditions with low surface tension it may cause a sloughing-off from granular sludge and the selective washout of these microorganisms.
Direct granular particle size analysis has been performed manually with a graticule ruler or by wet sieving (Laguna et al., 1999), by automatic image analysis and computerised data processing (Dudley
et al., 1993; Ahn and Speece, 2003) and by particle size analysis using laser (Yan and Tay, 1997). Indi-rect granular sludge density analysis has been per-formed by measuring settling velocity and extrapola-tion of the corresponding granule diameters (Gro-thenhus et al., 1991) or sludge volume index (Andras
et al., 1989; Ahn, 2000). Studies on UASB reactors have shown that sludge settling may affect the rate of start-up and maximum reactor loading rate (Hamoda and van den Berg, 1984).
The Griffith tube (Hairsine and McTainsh, 1986) is an adaptation of the siltometer and is designed to provide accurate information on the settling velocity distribution of sediment outside the size range cov-ered by Stoke’s Law. It provides information on set-tling in clear water, without the interactions which could occur in natural systems (Hairsine and McTainsh, 1986). The majority of the sediment from soil, as well as anaerobic sludge granules, commonly exists in the form of aggregates which settle at a rate dependent upon the aggregate’s size, shape, rough-ness and density relative to the fluid. However, Childs (1969) in his review of the assumptions be-hind Stoke’s Law suggests that significant surface and form drag effects limit the use of Stoke’s Law to particles of less than 60 μm diameter, while for sedi-ment greater than 60 μm the relationship between size and settling rate is complex and depends on the particular variations found in aggregate shape and density (Gibbs et al, 1971).
In anaerobic reactors treating effluents with high LCFA contents, small sludge granules may undergo an aggregation process which is potentiated by LCFA adsorption on the surface of the granules, so that sludge flocs appear and therefore Stoke’s law is not applicable.
The settling velocity depends not only on the size, shape and density of the particles and the density and viscosity of the fluid, but also on the number or con-centration of the particles (Cheng, 1997b; Li and Yuan, 2002).
as an operational parameter in laboratory-scale UASB reactors. This protocol was easy to apply, allowing visual observation of the sludge granules during sedi-mentation, separation and particle size distribution according to the settling time in Griffith Tube. This method also allowed separate analysis of the granules collected in each fraction according to the observed settling time, allowing several evaluations to be per-formed regarding the characteristics of the biomass.
MATERIALS AND METHODS
UASB Reactors
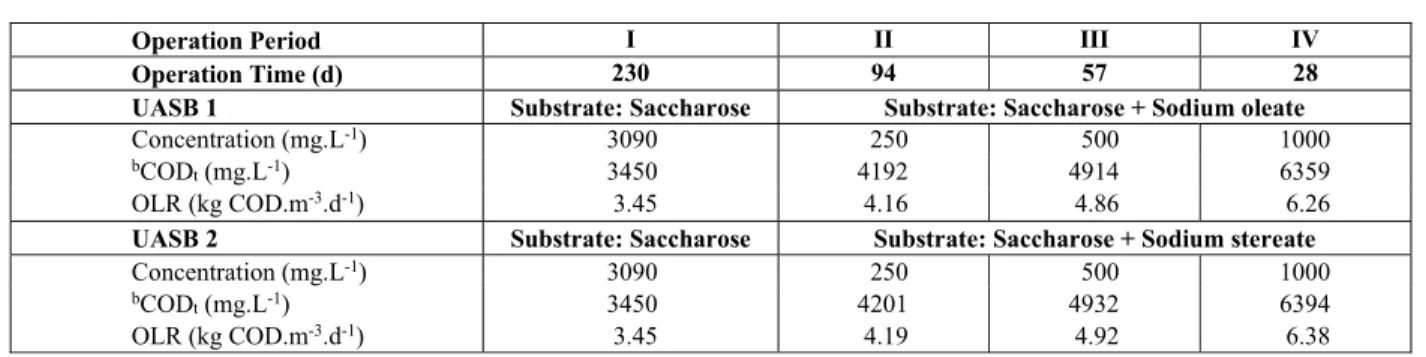
Two UASB reactors (17.0 L), designated UASB 1 and 2, were set up and were used as the laboratory reactors. The reactors were inoculated with anaerobic sludge obtained from a UASB reactor treating the effluent from a gelatin factory. The sludge was char-acterized with respect to total volatile solids (TVS), volatile fatty acids (VFA): acetic, n-butyric, i-butyric, valeric and i-valeric acid according to the 5560D method (APHA, 2012). Specific methanogenic activ-ity (SMA) was determined according to Monteggia (1991) and Miranda et al. (2005), using sodium ace-tate as substrate. The hydraulic retention time (HRT) was 24 h at all periods. The operational conditions of the UASB reactors are shown in Table 1, where it can be observed that the affluent organic load rate in-creased in the UASB 1 reactor to 4.16, 4.86 and 6.26 kg COD m3 d-1 with the addition of sodium oleate to the saccharose substrate during the periods of opera-tion II (94 days), III (57 days) and IV (28 days), re-spectively. The same can be observed for the UASB 2 reactors, with an affluent organic load rate of 4.19, 4.92 and 6.38 kg COD.m-3.d-1 by adding sodium stearate to the saccharose substrate during the same operational periods.
The sludge inoculum was adapted for 230 days to a synthetic wastewater containing saccharose (3.1 g.L-1),
sodium bicarbonate (3.1 g.L-1), ammonium chloride (0.6 g.L-1), trisodium phosphate (0.12 g.L-1) and yeast extract (0.091 g.L-1), equivalent to a chemical oxygen demand (COD) of 3.450 mg.L-1. Operating temperature was 35.0 0.5 ºC.
Settleability Assessment Protocol
The sedimentation of the sludge granules was measured using the Griffith tube. Measurements taken in the inoculum and the sludge from each reactor at the end of periods I, II, III and IV are summarized in Tables 2 and 3.
Settling Test Apparatus
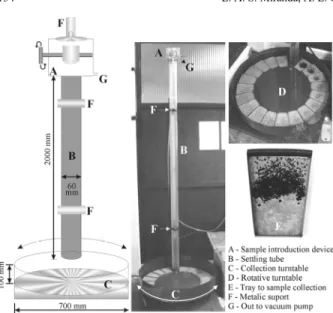
Sedimentation was measured in the Griffith tube, which determines settling velocity in clean water. It was measured at the end of each operational period. The equipment is similar to that used by Hairsine and McTainsh (1986), and is an adaptation of the Siltometer. The Griffith tube, as shown in Figure 1, has three basic components: the settling tube, the sample introduction device and the collection turnta-ble on which settled samples are collected.
The Sample Introduction Device
The sample input chamber is in the upper part of the tube and is composed of an acrylic chamber con-taining a stainless steel cup into which the sludge is placed. The cup is held in a metal device that allows it to be rotated from without, allowing the sample to fall into the sedimentation tube. This chamber has a conical acrylic lid that allows it to be completely sealed. The lower part of the lid is glued to the sedi-mentation tube. At the back of the sample introduction device there is an exit (Figure 1G) linked to a vacuum pump that allows the water to be transferred from the turntable to the upper part of the sedimentation tube, maintaining the water column pressure at -2 m.
Table 1: Operational conditions of UASB reactors, according to the added substrate.
Operation Period I II III IV Operation Time (d) 230 94 57 28 UASB 1 Substrate: Saccharose Substrate: Saccharose + Sodium oleate
Concentration (mg.L-1) 3090 250 500 1000
bCOD
t (mg.L-1) 3450 4192 4914 6359
OLR (kg COD.m-3.d-1) 3.45 4.16 4.86 6.26
UASB 2 Substrate: Saccharose Substrate: Saccharose + Sodium stereate
Concentration (mg.L-1) 3090 250 500 1000
bCOD
t (mg.L-1) 3450 4201 4932 6394
Figure 1: Griffith tube. Adapted from Hairsine and McTainsh (1986).
The Settling Tube
The semi-fixed acrylic tube is 2000 mm in length and 60 mm in internal diameter, and is held by 3 arms in an aluminium track. This can be advanced a few centimetres vertically, thus moving the lower portion of the sedimentation tube towards or away from the collection point.
The Sample Collection Turntable
The sample collection system consists of a rotat-ing circular table, like a turntable in the form of a tray, 700 mm in external diameter and 100 mm deep. The base of the turntable is coupled to a central axis attached to a metal base, allowing the system (turn-table and trays for sample collection - Figure 1, de-tail “D” and “E”) to turn on its own axis. In Figure 1D, the 19 sample receiving points (Figure 1E) are seen inside the largest tray (turntable). Each of these 19 trays corresponds to a sample; these are sub-mersed in water at the base of the tray. Each receiv-ing point (Figure 1E) is 10 mm in depth and the ta-pered shape shown in Figure 1D allows them to fit closely together such that all settling granules are collected. Water in the collection tray seals the tube to prevent air from entering and displacing the hang-ing column of water in the settlhang-ing tube.
Griffith Tube - Principle of Operation
The method is based on maintaining a water col-umn inside the tube under a negative pressure of
approximately 2 m. The sludge sample is placed in the cup in the sample introduction device. The lever is turned, releasing the sample into the tube and be-ginning the sedimentation process. The first fraction of the sample is collected in the first collecting tray (Figure 1D-E). After a given interval, the turntable is moved and positioned in the lower part of the sedi-mentation tube. This is repeated up to the 19th tray. The time during which the bottom of the sedimenta-tion tube remains over each tray is determined in advance using a sludge sample which is released into the sedimentation tube and allowed to deposit com-pletely within a single tray. The time between the beginning of this process, and when the last particles settle, is divided by the number of trays (Figure 1E), giving the time interval during which the bottom of the sedimentation tube should remain over each tray. Thus 19 samples will be collected for equal time intervals. At the end of the collection, 10 min is al-lowed with the point of the tube over the final tray to ensure the collection of the final few particles.
Particle Size Analysis
The mean diameter of the sludge granules col-lected in each tray of the sample collection turntable was determined with a laser particle size analyzer (CILAS 1180) with a range of 0.04 m to 2.500 m in 100 divisions.
Analytical Methods
RESULTS AND DISCUSSION
Characterization of the Inoculum
The VS concentration was 62.53 g.L-1 and the SMA was 0.0066g CODCH4.g VS-1.d-1. The SMA test showed that the sludge had a good activity, with more than 80% methane in the biogas. The sedimen-tation characteristics of inoculum sludge granules are
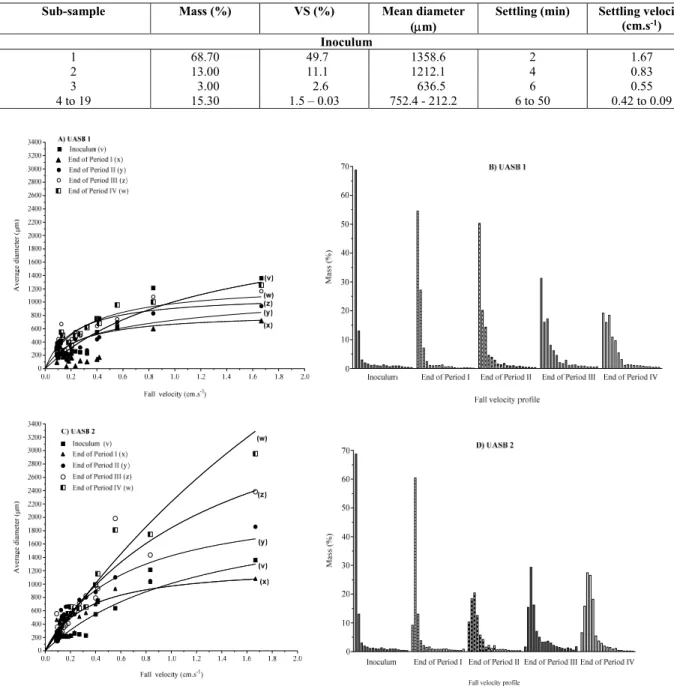
shown in Table 2, where it can be observed that about 81.7% of the mass of the particles sedimented within the first 2 min, with settling velocities be-tween 0.83 and 1.67 cm.s-1. The particles were con-sidered spheres and had a mean diameter of 1212.1 to 1358.6 m (Figure 2A).
This frequency distribution indicates that the sludge is homogeneous (unimodal profile), with good sedimentation properties. In general, sludges with
Table 2: Sedimentation characteristics of UASB sludge inoculum using Griffith Tube.
Sub-sample Mass (%) VS (%) Mean diameter (m)
Settling (min) Settling velocity (cm.s-1)
Inoculum
1 68.70 49.7 1358.6 2 1.67
2 13.00 11.1 1212.1 4 0.83
3 3.00 2.6 636.5 6 0.55
4 to 19 15.30 1.5 – 0.03 752.4 - 212.2 6 to 50 0.42 to 0.09
high ST50 sediment slowly. The sludge settling char-acteristics influence the rate of start-up and maxi-mum reactor loading rate. The UASB process per-formance is limited by the ability of the settler to retain sludge in the system in order to attain a high solids retention time at a low hydraulic retention time. Settling velocity is a critical factor that regu-lates biosolids-liquid separation and effluent quality in UASB reactors. The changes in the permeability of the sludge granules, due to LCFA adsorption may also have affected the characteristics of sludge sedi-mentation. At the end of period I, there was a change in the sedimentation profile of the sludge granules. The sludge in UASB 1 retained a homogeneous
sedimentation (Figure 2B and Table 3), with more than 80% of the granule mass settling between 0-4 min. This behaviour is taken to be unimodal, with a defined sedimentation profile. UASB 2 showed a similar behaviour at the end of the same period, with 73.4% of the granule mass settling within 2-6 min (Table 3), and the greater fraction settling between 0-4 min, increasing the TS50 with respect to the inocu-lum (Figure 3). This was also seen at the end of peri-od III in UASB 2, while UASB 1 only showed a decrease in percent mass for those granules that sedi-mented between 0-6 min, leading to an increase in mass of the granules that sedimented at lower veloci-ties than the inoculum (Table 3 and Figure 2).
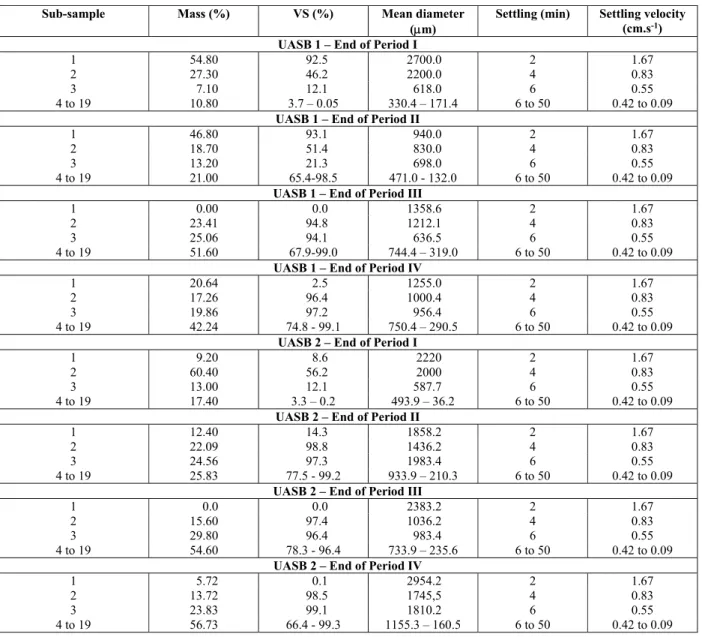
Table 3: Summary of sedimentation test results from UASB reactors using a Griffith Tube.
Sub-sample Mass (%) VS (%) Mean diameter (m)
Settling (min) Settling velocity (cm.s-1)
UASB 1 – End of Period I
1 54.80 92.5 2700.0 2 1.67
2 27.30 46.2 2200.0 4 0.83
3 7.10 12.1 618.0 6 0.55
4 to 19 10.80 3.7 – 0.05 330.4 – 171.4 6 to 50 0.42 to 0.09
UASB 1 – End of Period II
1 46.80 93.1 940.0 2 1.67
2 18.70 51.4 830.0 4 0.83
3 13.20 21.3 698.0 6 0.55
4 to 19 21.00 65.4-98.5 471.0 - 132.0 6 to 50 0.42 to 0.09
UASB 1 – End of Period III
1 0.00 0.0 1358.6 2 1.67
2 23.41 94.8 1212.1 4 0.83
3 25.06 94.1 636.5 6 0.55
4 to 19 51.60 67.9-99.0 744.4 – 319.0 6 to 50 0.42 to 0.09
UASB 1 – End of Period IV
1 20.64 2.5 1255.0 2 1.67
2 17.26 96.4 1000.4 4 0.83
3 19.86 97.2 956.4 6 0.55
4 to 19 42.24 74.8 - 99.1 750.4 – 290.5 6 to 50 0.42 to 0.09
UASB 2 – End of Period I
1 9.20 8.6 2220 2 1.67
2 60.40 56.2 2000 4 0.83
3 13.00 12.1 587.7 6 0.55
4 to 19 17.40 3.3 – 0.2 493.9 – 36.2 6 to 50 0.42 to 0.09
UASB 2 – End of Period II
1 12.40 14.3 1858.2 2 1.67
2 22.09 98.8 1436.2 4 0.83
3 24.56 97.3 1983.4 6 0.55
4 to 19 25.83 77.5 - 99.2 933.9 – 210.3 6 to 50 0.42 to 0.09
UASB 2 – End of Period III
1 0.0 0.0 2383.2 2 1.67
2 15.60 97.4 1036.2 4 0.83
3 29.80 96.4 983.4 6 0.55
4 to 19 54.60 78.3 - 96.4 733.9 – 235.6 6 to 50 0.42 to 0.09
UASB 2 – End of Period IV
1 5.72 0.1 2954.2 2 1.67
2 13.72 98.5 1745,5 4 0.83
3 23.83 99.1 1810.2 6 0.55
Settling Characteristics
The sedimentation profile of the sludge granules is shown in Figure 2 where the sedimentation veloci-ty (cm.s-1) of granules in each sub-sample is plotted versus mean diameter (m) (Fig. 2A and C) and profile of sedimentation of the sludge collected in each sub-sample in the Griffith tube (mass (%) x sedimentation velocity (cm.s-1)) (Fig. 2B and D).
The sedimentation test results for the inoculum and samples from the UASB reactors at each interval analysed are summarized in Table 3. The aliquots collected in each of the 19 trays (sub-sample) were grouped based on the sedimented mass of sludge and the particle diameter. Trays 1, 2 and 3 received the largest sludge mass percentage, culminating in greater settling velocity compared to the other sub-samples, except during periods III and IV, when the addition of LCFA changed the profile of sludge settleability.
The difference between the sedimentation profile of the granules in UASB 1 and 2 at the end of period I may reflect the inhomogeneous nature of the sludge collected at the site before inoculating the reactors; a large volume was collected in order to avoid ruptur-ing the granules and to reduce contact with oxygen.
There was also an increase in mean diameter of the granules after the addition of LCFA (Table 3 and Figure 2A and 2C); this was not accompanied by an increase in sedimentation velocity.
At the end of periods I and III several changes were noted. For granules with a settling velocity less than 0.8 cm.s-1 there was a reversal in relation to diameter. In this case granules with a greater diame-ter sedimented at velocities lower than those in the inoculum and than those granules sedimenting at 0.8 and 1.67 cm.s-1. This behaviour was seen in all reac-tors and probably occurred because of alterations in the shape and density of the granules, since the mean granule diameter increased after LCFA addition. According to Rinzema et al., (1993), LCFA are ad-sorbed onto the granules inhibiting the release of biogas from their interior. A similar effect was re-ported by Hwu, (1997), Petruy (1999) and Alves et al., (2001), who studied the biodegradation of differ-ent LCFA.
According to Pietsch et al. (2003), biological ac-tivity has a crucial influence on settling velocity because the rising bubbles hinder the downward movement of the sludge particles. Hence, lower gas production rates mean higher settling rates. It was found that anaerobic sludge particles contain gas bubbles, and the compressibility of the bubbles which are entrapped in the sludge agglomerates was mathe-matically described; pressure dependent
sedimenta-tion characteristics of the sludge particles were found.
Much experimental and analytical information on the settling velocity of a single particle or biogranule is available to guide practical applications, though the problem is far from being completely solved. However, the case most frequently encountered in analyses and predictions on sediment or bio-granule transport is one where more than a solitary particle falls through a fluid. The presence of the other gran-ules will modify the settling velocity of an individual granule in the fluid, due to mutual interference among granules. For example, a few closely spaced particles in a fluid will fall faster than a single cle. On the other hand, the settling velocity of parti-cles uniformly dispersed throughout a fluid will be less than that of an identical isolated particle in a clear fluid (Cheng, 1997b).
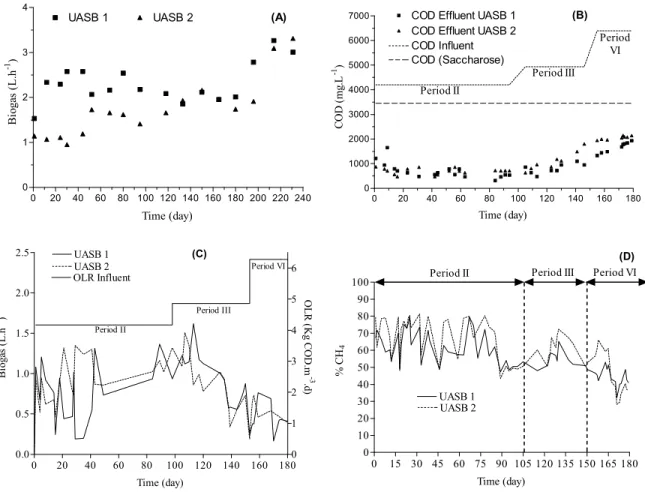
Figure 3A shows biogas production during period I, where the gradual increase of biogas production was seen as the sludge adapted to the substrate. Figure 3B shows the evolution of the concentration of inflow-ing and outflowinflow-ing COD concentration, with in-creased addition of sodium stereate and sodium ole-ate to the reactors, while Figures 3C and D show re-lations between organic loads applied in each period in the reactors, and the variation in the concentration of methane in biogas during the experimental period. The decrease of biogas production and methane con-centration clearly reflects the influence of the in-creased LCFA concentration on the influent.
UASB Reactors 1 and 2 – Period I – Substrate: Saccharose
0 20 40 60 80 100 120 140 160 180 0 1000 2000 3000 4000 5000 6000
7000 COD Effluent UASB 1
COD Effluent UASB 2 COD Influent COD (Saccharose) Period II Period III Period VI (B) Time (day) CO D ( m g .L -1 )
0 20 40 60 80 100 120 140 160 180 200 220 240 0
1 2 3 4
UASB 1 UASB 2 (A)
Time (day) B ioga s ( L .h -1 )
0 20 40 60 80 100 120 140 160 180
0.0 0.5 1.0 1.5 2.0
2.5 UASB 1
UASB 2 OLR Influent 0 1 2 3 4 5 6 Period II Period III Period VI (C) Time (day) Bi o g as ( L .h -1) O L R ( K g CO D .m -3 .d )
0 15 30 45 60 75 90 105 120 135 150 165 180 0 10 20 30 40 50 60 70 80 90 100 UASB 1 UASB 2
Period II Period III Period VI (D)
Time (day)
% CH
4
Figure 3: Biogas production vs time (A); COD effluent in UASB 1 and 2, during period I (fed only with saccharose); COD effluent of UASB 1 and 2 (fed with saccharose plus sodium oleate (UASB 1) and saccharose plus sodium stereate (UASB 2) (B); Biogas production in UASB 1 and 2 during periods II, III and IV (C); methane percentage in the biogas vs time in UASB 1 and 2, during periods II, III and IV (D).
adapted to the synthetic substrate at the end of 230 days of operation, since during this period there was an increase in the biogas production rate (Figure 3A) and in methane concentration in the biogas (Table 4). VS concentration in the anaerobic sludge decreased at the end of period I from 62.53 g.L-1 (inoculum) to 30.58 g.L-1 and 26.60 g.L-1 in UASB 1 and 2, respec-tively. After starting the inoculation, the disaggrega-tion of the sludge granules began and it was lost through the effluent because of the new operational conditions to which the anaerobic sludge was sub-mitted.
UASB 1 and 2 – Periods II, III and IV – Substrate: Saccharose + LCFA
The COD of the influent applied during period I was increased in the subsequent periods by the added LCFA according Table 1, while the HDT was
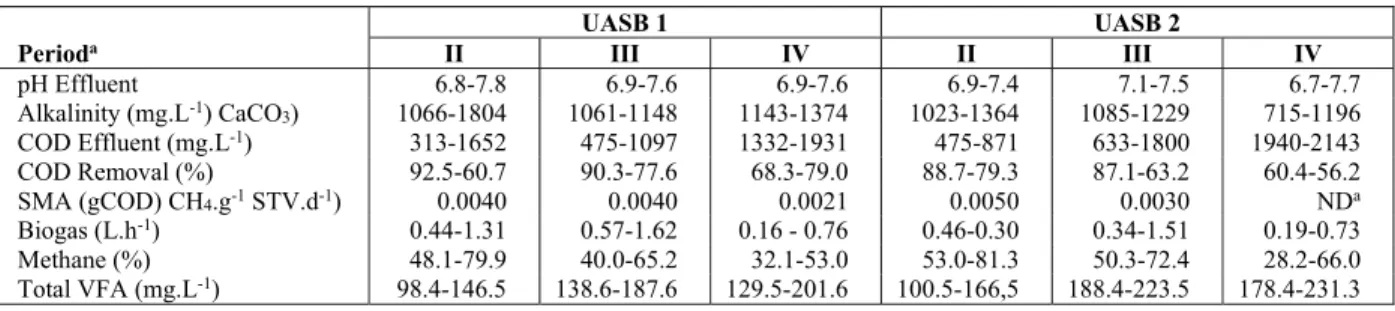
maintained at 24 h. Table 5 shows the results during steps II, III and IV. The lowest values of effluent alkalinity were observed in UASB 2, during period IV. The percent removal of COD, production of biogas (L.h-1) and percent CH4 in the biogas decreased considerably in all reactors with the increase in LCFA concentration (Figure 3. (A-D) and Table 4). SMA also declined at the end of each period, while the biomass in reactor UASB 2 had undetectable levels of SMA at the end of period IV (Table 5).
Table 4: Performance of the UASB reactors during period I using saccharose with substrate.
UASB 1 UASB 2
COD Effluent (mg.L-1) 400 - 1.319 300 - 1.264
Mean COD removal (%) 81.1 78.3
Biogas Production (L.h-1) 1.53 - 3.26 0.95 - 3.31
Table 5: Performance of the UASB reactors during periods II, III and IV.
UASB 1 UASB 2
Perioda II III IV II III IV
pH Effluent 6.8-7.8 6.9-7.6 6.9-7.6 6.9-7.4 7.1-7.5 6.7-7.7
Alkalinity (mg.L-1) CaCO
3) 1066-1804 1061-1148 1143-1374 1023-1364 1085-1229 715-1196
COD Effluent (mg.L-1) 313-1652 475-1097 1332-1931 475-871 633-1800 1940-2143
COD Removal (%) 92.5-60.7 90.3-77.6 68.3-79.0 88.7-79.3 87.1-63.2 60.4-56.2
SMA (gCOD) CH4.g-1 STV.d-1) 0.0040 0.0040 0.0021 0.0050 0.0030 NDa
Biogas (L.h-1) 0.44-1.31 0.57-1.62 0.16 - 0.76 0.46-0.30 0.34-1.51 0.19-0.73
Methane (%) 48.1-79.9 40.0-65.2 32.1-53.0 53.0-81.3 50.3-72.4 28.2-66.0
Total VFA (mg.L-1) 98.4-146.5 138.6-187.6 129.5-201.6 100.5-166,5 188.4-223.5 178.4-231.3
The COD removal when the reactors operated on-ly with saccharose (Period I) averaged 80% (Table 4). Alkalinity and pH remained stable. The alkalinity observed was associated with alkalinity-generating substances from synthetic substrate used. In the fol-lowing period (II) the OLR was increased to 4.16 kg COD. m-3.d-1 by addition of 250 mg.L-1 sodium ole-ate (UASB 1) and 4.19 kg COD. m-3.d-1 by addition of 250 mg.L-1 sodium stereate (UASB 2). Beginning in this period there was a decrease in effluent quality in the reactors, even though no solids loss was seen. After 24 h of operation, precipitates formed at the base of UASB 2.
In percentage terms, COD removal was similar to period I, although effluent quality decreased consid-erably in all the reactors (Figure 2B). Gas production was also found to be affected by added LCFA (Figure 2D) and the percent of CH4 in the biogas decreased gradually in all the reactors. COD removal decreased progressively as the concentration of LCFA was in-creased to 500 mg.L-1 (Period III) and 1000 mg.L-1 (Period IV). This effect was more pronounced from period III because of the inhibition of the acetogenic bacteria involved in -oxidation of fatty acids, af-fecting the overall performance.
The effect of COD removal was in part due to ad-sorption on the granules of the sludge. The pH was stable during the experiment, but the alkalinity de-creased with the inde-creased addition of LCFA, and the concentration of total VFA increased (Table 5). However, there was no acidification in the reactors, probably because of the neutralization of the VFA by the alkalinity of LCFA salts; hence the alkalinity observed was not associated with alkalinity-generating substances (mainly sodium acetate) in the substrate, but was generated from a source in the synthetic substrate. Our results suggest that the alka-linity observed is due to the presence of bicarbonate and alkalinity used to neutralize the VFA, since the operation of the reactors (6.8 to 7.2), does not allow hydroxide alkalinity to appear, which occurs at a pH
higher than 8.3. A possible effect of alkalinity gener-ated from the formation of ammonium bicarbonate must be considered, due to the ammonium chloride present in the synthetic effluent which, combined with the carbonic acid present in the medium, may form ammonium bicarbonate, helping maintain the pH in a stable range.
The SMA decreased with the increase of LCFA in all reactors, reaching undetectable levels in UASB 2, fed with sodium stereate. This suggests that sodium stereate is the main inhibitor, probably because of its greater hydrophobicity, which reduced the substrate-microorganism interaction. Rather than inhibition, flotation of granular biomass, leading to washout, was the most important operational problem observed in UASB 2. Lalman & Bagley (2001) found that oleic acid was anaerobically degraded at 21 ºC but stearic acid degradation was very slow in unacclimated cultures. Also in this case the biomass used for these experiments was enriched before LCFA addition using glucose, while in our case we used saccharose, in the absence of oleic or stearic acids. However, the authors used LCFA concentrations between 10-100mg/L, while in this study the concentrations were higher ((250-1000 mg/L).
The adsorption of LCFA to the sludge granules may have led to trapping biogas within the granules, modifying their density and leading to washout dur-ing periods III and IV. Physically, this effect can be observed through the heterogeneity in the granule sedimentation characteristics at the end of period III. Moreover, visually the occurrence of white granules was also observed, probably due to the adsorption of LCFA on the surface, similar to that observed by HWU et al (1998).
CONCLUSIONS
effi-cient method for the analysis of physical sedimenta-tion characteristics of anaerobic sludge granules. It allowed the alterations in settling velocity resulting from substrate modification to be measured. Also the addition of LCFA to the substrate led to changes in the physical structure of the granules, reducing set-tling velocity at the same time that mean particle diameter was increased.
In our study the addition of LCFA altered the sedi-mentation profile of the granules with sedisedi-mentation velocities less than 0.83 cm.s-1, as a consequence of the adsorption of LCFA. The addition of LCFA also caused a decrease in the overall performance of the reactors. This effect was more evident in the pres-ence of sodium stereate, and led to total washout of the biomass at the end of the experiment.
The sedimentation velocity of sludge granules can be analysed using the Griffith Tube to determine the upper limit of influent input rates for a specific sludge in UASB reactors. The measurements can be used to show how the behaviour changes with time and operational conditions.
ACKNOWLEDGMENT
The authors acknowledge the Foundation to Sup-port the Research of Rio Grande do Sul State (FAPERGS) for financial support.
REFERENCES
Alves, M. M., Mota Vieira, J. A., Álvares Pereira, R. M., Pereira, M. A. and Mota, M., Effect of lipids and oleic acid on biomass development in anaer-obic fixed-bed reactors. Part I: Biofilm growth and activity. Water Research, 35(1), 255-263 (2001). Ahn, Y. H., Physicochemical and microbial aspects
of anaerobic granular biopellets. Journal of Envi-ronmental Science Health, A35(9), 1617-1635 (2000).
Ahn, Y. and Speece, R. E., Settleability assessment protocol for anaerobic granular sludge and its ap-plication. Water, SA 29(4), 419-426 (2003). Andras, E., Kennedy, K. J. and Richardson, D. A.,
Test for characterizing settleability of anaerobic sludge. Environmental Technology Letters, 10, 463-470 (1989).
APHA, Standard Methods for the Examination of Water and Wastewater. Washington, DC, Ameri-can Public Health Association (APHA) (2012). Battimelli, A., Torrijos, M., Moletta, R., Delgenés, J.
P., Slaughterhouse fatty waste saponification to
increase biogas yield. Bioresource Technology, 100, 3388-3393 (2010).
Batstone, D. J., Keller, J. and Blackall, L. L., The influence of substrate kinetics on the microbial community structure in granular anaerobic bio-mass. Water Research, 38, 1390-1404 (2004). Bhatti, Z. I., Furukawa, K. and Fujita, M.,
Compara-tive composition and characteristics of methano-genic granular sludges treating industrial wastes under different conditions. Journal of Fermenta-tion and Bioengineering, 79(4), 348-353 (1995). Britz, T. J. Van Schalkwyk, C. and Ross, P.,
Devel-opment of method to enhance granulation in a la-boratory batch system. Water SA, 28(1), 49-55 (2002).
Cheng, N. S., Simplified settling velocity formula for sediment particle. Journal of Hydraulic Engi-neering, February 123(2), 149-152 (1997a). Cheng, N. S., Effect of concentration on settling
velocity of sediment particles. Journal of Hydrau-lic Engineering, August 123(8), 728-731 (1997b). Daffonchio, D., Thaveesri, J. and Verstraete, W.,
Contact angle measurement and cell hydrophobi-city of granular sludge from upflow anaerobic sludge bed reactors. Applied Environmental Mi-crobiology, 61, 3676-3680 (1995).
Desbois, A. P. and Smith, V. J., Antibacterial free fatty acids: activities, mechanisms of action and biotechnological potential. Applied Microbiology and Biotechnology, 85(6), 1629-1642 (2010). Duddley, B. T., Howgrave-Graham, A. R., Bruton, A.
G. and Wallis, F. M., Image analysis to quantify and measure UASB digester granules. Biotech-nology and Bioengineering, 42, 279-283 (1993). Gibbs, R. J., Matthews, M. D. and Link, D. A., The
relationship between sphere size and settling ve-locity. Journal of Sedimentary Petrology, 41(1), 7-18 (1971).
Grotenhuis, J. T. C., Kissel, K. C., Plugge, C. M., Stams, A. J. M. and Zehnder, A. J. B., Role of substrate concentration in particle size distribu-tion of methanogenic granular sludge in UASB reactors. Water Research, 25(1), 21-27 (1991). Hairsine, P. and McTainsh, G., The Griffith Tube: A
Simple Settling Tube for the Measurement of Set-tling Velocity of Aggregates. School of Australian Environmental Studies, Working Paper 3/86, 19 p. Griffith University, Australian (1996).
Hamoda, M. F. and van den Berg, L., Effect of set-tling on performance of the upflow anaerobic sludge bed reactors. Water Research, 18(12), 1561-1567 (1984).
high rate anaerobic treatment systems. Water Sci-ence and Technology, 24(8), 207-255 (1991). Hwu, Ching-Shyung, Enhancing Anaerobic
Treat-ment of Wastewaters Containing Oleic Acid. Ph.D. Thesis. 169 p. Wageningen University. Wageningen, The Netherlands (1997).
Hwu, C. S., Tseng, S. K., Yuan, C., Kulik, Z. and Lettinga, G., Biosorption of long-chain fatty acids in UASB treatment process. Water Research, 32(5), 1571-1579 (1998).
Johnson, C. P., Li, X. Y. and Logan, B. E., Settling velocities of fractal aggregates. Environmental Science & Technology, 30, 1911-1918 (1996). Kim, M., Ahn, Y., Yangin, C. and Speece, R. E.,
An-aerobic digestion elutriated phase treatment. In: Proceedings of the 9th World Congress of Anaer-obic Digestion (AD-9). IWA, Antwerpen, Bel-gium. Part 1, 799-804 (2001).
Kim, B. H. and Gadd, G. M., Bacterial Physiology and Metabolism. Cambridge University Press, New York (2008).
Laguna, A., Ouattara, A., Gonzalez, R. O., Baron, O., Fama, G., El Mamouni, R., Guiot, S., Monroy, O. and Macarie, H., A simple and low cost technique for determining the granulometry of upflow an-aerobic sludge blanket reactor sludge. Water Sci-ence and Technology, 40(8), 1-8 (1999).
Lalman, J. A. and Bagley, D. M., Anaerobic degrada-tion and methanogenic inhibitory effects of oleic and stearic acids. Water Research, 35(12), 2975-2983 (2001).
Ligero, P. and Soto, M., Sludge granulation during anaerobic treatment of pre-hydrolysed domestic wastewater. Water SA, 28(3), 307-311 (2002). Lettinga, G. and Hulshoff Pol, L. W., UASB-process
design for various types of wastewaters. Water Science and Technology, 24(8), 87-107 (1991). Li, X. and Yuan, Y., Settling velocities and
permea-bilities of microbial aggregates. Water Research, 36, 3110-3120 (2002).
Metcalf & Eddy Inc., Wastewater Engineering: Treatment, Disposal, and Reuse. 1819 p. 4rd Ed. New York, McGraw-Hill (2013).
Monteggia, L. O., The use of specific methano-genic activity for controlling anaerobic reactors. Ph.D. Thesis, 307 p. Department of Civil Engi-neering, University of Newcastle, Newcastle, UK (1991).
Miranda, L. A. S., Henriques, J. A. P. and Monteggia, L. O., Full scale UASB reactor treating pig and cattle slaughterhouse wastewater with high oil and grease content. Brazilian Journal of Chemical Engineering, 22(4), 601-610 (2005).
Palatsi, J. J., Affes, R., Fernandez, B., Pereira, M. A., Alves, M. M., Flotats, X., Influence of adsorption and anaerobic granular sludge characteristics on long chain fatty acids inhibition process. Water Research, 46, 5268-5278 (2012).
Pereboom, J. H. F., Strength characterisation of mi-crobial granules. Water Science and Technology, 36(6-7), 141-149 (1997).
Petruy, R., Anaerobic treatment of protein, lipid and carbohydrate containing wastewaters using the EGSB technology. 110 p. Ph.D. Thesis, Wa-geningen University, WaWa-geningen, The Nether-lands (1999).
Pietsch, T., Mehrwald, R., Grajetzki, R., Sens, J. and Märkl, H., Sedimentation behaviour of sludge particles in a biogas tower reactor and the func-tion of a hidrostatically pressurized sedimenter. Water Research, 37, 1071-1079 (2003).
Quarmby, J. and Forster, C. F., An examination of the structure of UASB granules. Water Research, 29(11), 2449-2454 (1995).
Rinzema, A., Alphenaar, A. and Lettinga, G., Anaer-obic digestion of long-chain fatty acids in UASB and expanded granular sludge bed reactors. Pro-cess Biochemistry, 28, 527 (1993).
Thaveesri, J., Daffonchio, D., Liessens, B., Vander-meren, P. and Verstraete, W., Granulation and sludge bed stability in upflow anaerobic sludge bed reactors in relation to surface thermodynam-ics. Applied Environmental Microbiology, 61, 3681-3686 (1995).
Valladão, A. B. G., Torres, A. G., Freire, D. M. G., Cammarota, M. C., Profiles of fatty acids and tri-acylgylcerols and their influence on the anaerobic biodegradability of effluents from poultry slaugh-terhouse. Bioresource Technology, 102(14), 7043-7050 (2011).
Winkler, M. -K. H., Bassin, J. P., Kleerebezem, R., van der Lans, R. G. J. M., van Loosdrecht, M. C. M., Temperature and salt effects on settling veloc-ity in granular sludge technology. Water Re-search, 46(16), 5445-5451 (2012).
Yan, Y. G. and Tay, J. H., Characterization of the granulation process during UASB start-up. Water Research, 31(7), 1573-1580 (1997).
Yu, L., Ma, J., Frear, C., Zhao, Q., Dillon, R., Li, X., Chen, S., Multiphase modeling os settling and suspension in anaerobic digester. Applied Energy, 111, 28-39 (2013).