*e-mail: [email protected]
Received: 29 September 2013 / Accepted: 20 June 2014
Is it possible to identify the gender and age group of adults from
gait analysis with hip-knee cyclograms?
Ródney Silva Abreu, Eduardo Lázaro Martins Naves*, Thiago Bruno Caparelli, Daniel Teodoro Gonçalves Mariano, Valdeci Carlos Dionísio
Abstract Introduction: Cyclograms are gait analysis tools that characterize the geometric aspect of the pattern of locomotion. Cyclograms are angle-angle diagrams that are very useful for representing cyclic patterns such as walking. This study is based on the hypothesis that parameters extracted from hip-knee cyclograms of individuals walking on a treadmill with 0° and 5° slopes can be used to determine the age group and sex of the volunteers. Methods: In total, 40 physically active healthy adult volunteers, 20 young people (10 of each gender) and 20 elderly (10 of each gender), were divided into 4 groups, and the average value of area (A), perimeter (P) and the ratio P/√A of cyclogram were calculated, as well as the speed and cadence. Results: The young male (YM) speeds were higher than the elderly male (EM) speeds (p=0.00), and the young female (YF) speeds were higher than the elderly female (EF) speeds (p=0.00). No difference in speed was found between YM and YF (p=0.59) or between EM and EF (p=0.95). The parameters extracted directly from the cyclogram allowed us to distinguish the studied groups according to age group (p<0.05), especially with the treadmill inclined at 5°, but it was not enough to determine gender (p>0.51). Conclusion: The hypothesis was partially coni rmed because parameters extracted from the hip-knee cyclograms could differentiate volunteers by age group but not gender.
Keywords Gait, Young adults, Elderly, Gender, Cyclogram.
Introduction
Human gait is a locomotive process where the moving erect body is sustained by one leg and later by the other leg, with at least one foot touching the ground (Inman et al., 1981). It is noted that the ability to
walk efi ciently and safely is very important to the senile population. Gait is learned during the i rst
year of life, reaching maturity at approximately 7 years, and maintaining its performance for up to 60 years (Prince et al., 1997). It is known that aging is accompanied by physiological alterations to the body (Daly et al., 2013; El Haber et al., 2008; Kerrigan et al., 1998; Shumway-Cook et al., 2007) and that there are
differences in l exibility (Araújo, 2008) and muscular
force (Callisaya et al., 2008; Skelton et al., 1994) between the genders. However, the impact of changes resulting from the aging process in gait and possible gender differences are not well understood (Daly et al., 2013). Therefore, it is necessary to develop tools that can provide effective and practical information to clinicians to quantify changes in gait to enable early and effective medical intervention.
To evaluate gait, a treadmill can be used, allowing the collection of data in a small physical space, with controlled speeds and inclines, simplicity in video capture, and the ability to record several consecutive gait cycles (Riley et al., 2007; Watt et al., 2010). Among the various tools to characterize biomechanics of gait,
there are the cyclograms originally proposed by Grieve in the 60s (Grieve, 1968). Cyclograms are based on
closed trajectories and constitute themselves efi cient
descriptors capable of quantitatively characterizing the gait cycle (GC) through the angles produced by two
joints (Goswami, 1998). Cyclograms have been used
in several studies, for example, to compare bipedal and quadrupedal gaits (Charteris et al., 1979), to identify gait patterns of sprinters and middle-distance runners (Decker et al., 2007), to evaluate the gradual evolution of the cyclogram in ascending and descending slopes of a treadmill (Goswami, 1998), to differentiate the gait of healthy and hemiparetic people (Mah et al., 1999), and so forth.
Cyclograms maintain the original spatial information, are easy to understand, and are suitable for clinical applications. Although there is the loss of temporal representation (Barton and Lees, 1997; Goswami, 1998), cyclograms have several advantages: they enable kinematic analysis during a full GC and can intuitively characterize the analyzed system by its shape. Additionally, as the gait is a coordinated movement of body segments, it is most naturally
understood when two or more joints are analyzed
Hip-knee cyclograms represent nearly all the movements of the body (trunk, thigh, and leg) and therefore can provide useful parameters to help differentiate several types of gait (Barton and Lees, 1997). Although it is known that the variability of step width, stride length, and speed can identify, in kinematic terms, the young and old (Hamacher et al., 2011), this study seeks to identify new parameters, such as cyclogram area and perimeter in relation to age group and gender, for the discrimination of patterns of physiological and pathological gait, supporting clinical practice. Thus, the hypothesis of this study was that parameters extracted from the hip-knee cyclograms could identify the age and sex of volunteers walking on a treadmill with slopes of 0° to 5°.
Methods
Data collection for this study was performed at the Biomechanics Lab of the Faculty of Physical Education (FAEFI) at the Federal University of Uberlandia (UFU) Centre for Sports Excellence (CENESP). The Ethical Research Committee of the Federal University of Uberlandia approved this study (CEP/UFU 414/10).
The sample consisted of forty (40) healthy volunteers with an equal number of both genders, i.e., able to maintain their independence, self-determination, and autonomy, even if they had one or more chronic disease (Veras, 2009) and who regularly practiced physical exercises. The eligibility criteria adopted for this study are as follows: healthy and independent young and elderly people, without limitations to
daily activities; have an absence of injury, trauma,
fractures, or lower limb surgery that altered gait; body mass index - BMI < 30 kg/m2; absence of
postural hypotension, vestibular disorders during the test, and muscle strength score greater than 3 in the examined muscles; a Berg Balance Scale (BBS) score greater than or equal to 41; absence of cardiovascular disorders, rheumatologic, or neurologic diseases with motor sequels; and agreeing to participate in the study, signing the informed consent forms for participation in research.
A sample size calculation was performed using the Action tool version 2.6 integrated with Excel software. To this end, we considered a difference of 350 degrees2 in cyclogram area and a signiicance
level of 5%. The results indicated a sample size
(n) of 10 subjects per group was needed. Thus, the
volunteers were divided into 4 groups: young male group (YM) (n = 10), young female group (YF) (n = 10), elderly male group (EM) (n = 10), and elderly female group (EF) (n = 10). The elderly groups were
participants in the AFRID Project (Group of Physical
and Recreational Activities for the Elderly), run by the Faculty of Physical Education and Physiotherapy (FAEFI). The young groups were formed by volunteers with the following feature: aged 18 to 30 (average 21.70 ± 3.06 years); mass (65.09 ± 11.97 kg); height (1.70 ± 0.10 m) and BMI (22.52 ± 2.67 kg/m2).
The elderly groups were formed by volunteers with the following features: aged 60 and older (average 68.95 ± 6.72 years); mass (67.17 ± 10.66 kg); height (1.63 ± 0.84 m) and BMI (25.17 ± 2.96 kg/m2).
The volunteers underwent a physical assessment, followed by application of the BBS to determine the risk factors associated with loss of independence and falls in the elderly (Whitney et al., 2003). Finally,
the muscle strength of the hip (lexors, extensors, and rotators) and knee (lexors and extensors) were
examined using manual muscle strength testing of the Oxford scale, with scores of 0-5 (Kendall et al., 2007).
Each volunteer then walked freely on a treadmill
during an adjustment period with no pre-set time. After
this, the speed of comfort (self-selected speed) was determined. For the experiments a treadmill branded
REEBOK model TR3 Premier Run (Canton, MA,
USA), 3.0 HP motor, maximum speed 16 km/h, variation in inclination 0-15° was used, and the canvas scroll was 50 cm wide and 152 cm long.
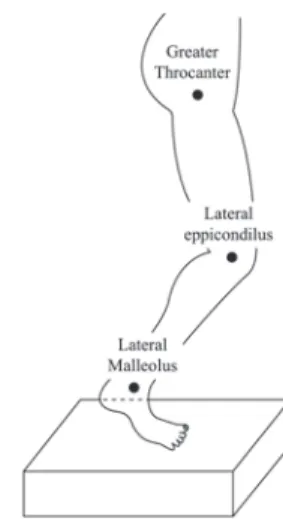
Orange markers, 1.0 cm in diameter, were ixed with
adhesive tape, at the right hemisphere (Figure 1) in the following anatomical prominences: hip’s greater trochanter, knee’s lateral epicondyle, and ankle’s lateral malleolus. Members symmetry was considered for the
knee and hip joints (Forczek and Staszkiewicz, 2012).
Later, the volunteers walked on a treadmill at the self-selected speed, with a slope of 5° for 3 minutes, followed by a break for the same period. This procedure was then repeated without the incline. The slope of
0° was assumed to represent the gait on land without gradient, and that of 5° was used to represent a likely inclined slope to be found in everyday life, according to the Brazilian Association of Technical Standards (ABNT) in the Brazilian Technical Standard (NBR) 9050 (Associação…, 2004).
For kinematic measurements, an HD webcam (Microsoft brand, model LifeCam Studio) with a resolution of 1280 x 720 pixels was used. The movement was recorded in the sagittal plane at 30 frames/second while the individual was walking on
the treadmill. Measurements of the angles of
lexion-extension of the hip and knee on the right leg were made in the coordinate system that originates in the
knee joint (Ellermeijer and Heck, 2003), as observed
in Figure 2, and recorded with the video tool of Coach 6 software (CMA/AMSTEL©, Amsterdam, Holland).
For kinematic analysis, 8 strides with no incline and 8 strides with a 5° incline were selected for each volunteer. For each stride, hip and knee angles were determined, and the following parameters were calculated: gait speed, cadence, cyclogram area (A)
and perimeter (P), and P/√A. The hip-knee cyclogram
graphically shows the relationship between the
angles of these joints throughout the GC (Figure 3). The initial and inal points of the cyclogram may be
slightly different due to frames considered in the video analysis and/or variations between strides, causing
the trajectories not to close perfectly.
The Shapiro-Wilk normality test was applied to all variables. For normally distributed variables the analysis of variance with a criterion (one-way ANOVA) was employed, followed by a post hoc Tukey test. In cases that lack normality, the Kruskal-Wallis test was
applied. The level of signiicance was set at 0.05 for
all statistical tests.
Results
Table 1 shows average values for group speed and cadence, and Table 2 shows that the YM speed was greater than that of EM and that the YF speed was
also greater than that of EF. No signiicant differences
were found between the YM and YF groups or the EM and EF groups. The YM cadence was greater than the EM cadence when the treadmill was not inclined.
When considering a closed cyclogram, there are three relevant geometric aspects: A, P, and the
dimensional ratio P/√A (Goswami, 1998). It is noted that there were no signiicant differences between
Figure 2. Joint Angles. Adapted from Ellermeijer and Heck (2003).
groups for the P/√A variable (Table 2). However, when
comparing the cyclogram perimeter with the treadmill at 5°, the YM perimeter was 14.70% greater than that of the EM and the YF perimeter was 14.33% greater than that of the EF (Table 2; Table 3). Meanwhile,
there were no signiicant differences between male and
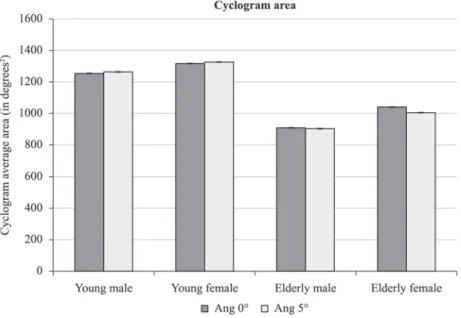
female volunteers from the same age group. (Table 2) When comparing cyclograms of the different
groups when the treadmill was lat, the YM area was
37.58% greater than that of the EM. At a 5° incline, the YM area was measured to be 39.33% greater than that of the EM and the YF area was 31.89% greater than that of the EF (Figure 4; Table 2). However, when observing the same age group, there were no
statistically signiicant differences between genders
(Table 2).
When comparing the different age groups, gait differences were found in the parameters extracted from the cyclograms, especially when the treadmill
was positioned at a 5° incline. Signiicant differences
were found in the area between groups YM and EM at both inclines and between groups YF and EF with the incline at 5°. As for the perimeter, statistically
signiicant differences were found with the treadmill
at 5° between groups YM and EM and between groups YF and EF.
Discussion
The hypothesis this study was based on is that parameters extracted from hip-knee cyclograms can identify the age and sex of volunteers who are walking on a treadmill with slopes of 0° to 5°. The
results partially conirm this hypothesis because
Table 1. Mean values and standard deviation of group speed and cadence.
Group Speed (km/h) Cadence (steps/min)
0° Angle 5° Angle
YOUNG MALE 3.88 ± 0.45 103.22 ± 2.20 102.4 ± 2.51
YOUNG FEMALE 3.58 ± 0.59 102.88 ± 2.63 101.64 ± 2.45
ELDERLY MALE 2.58 ± 0.51 89.76 ± 3.75 93.64 ± 3.16
ELDERLY FEMALE 2.71 ± 0.56 100.58 ± 3.01 102.52 ± 3.59
Table 2. Group comparison between cyclogram parameters, speed, and cadence in treadmill walking without inclination (angle 0°) and tilted (5° angle) using variance analysis (ANOVA) with one factor and post-hoc Tukey test (p < 0.05).
GROUP AREA PERIMETER P/√A
p (ang 0°) p (ang 5°) p (ang 0°) p (ang 5°) p (ang 0°) p (ang 5°)
YM-YF 0.939 0.911 0.931 0.993 0.9341 0.942
YM-EM 0.018* 0.004* 0.061 0.041* 0.3731 0.603
YF-EF 0.081 0.011* 0.052 0.044* 0.9981 0.977
EM-EF 0.622 0.735 0.953 0.990 0.6161 0.508
GROUP SPEED CADENCE
p (ang 0°) p (ang 5°) p (ang 0°) p (ang 5°)
YM-YF 0.591 0.591 1.00 0.998
YM-EM 0.000* 0.000* 0.015* 0.179
YF-EF 0.004* 0.004* 0.946 0.997
EM-EM 0.947 0.947 0.065 0.169
*Statistically signiicant difference in groups. 1Non-normal distribution. Kruskal-Wallis test was used, with signiicance level of 5%.
Table 3. Mean values of cyclogram area and perimeter.
Area (degrees2) Perimeter (degrees)
Young Male Ang 0° 1257.07 ± 158.50 160.26 ± 14.89
Ang 5° 1268.65 ± 177.11 160.04 ± 12.50
Young Female Ang 0° 1320.47 ± 214.24 165.00 ± 17.17
Ang 5° 1332.84 ± 209.63 162.04 ± 15.65
Elderly Male Ang 0° 913.75 ± 211.17 139.71 ± 16.19
Ang 5° 910.53 ± 188.79 139.46 ± 14.91
Elderly Female Ang 0° 1047.56 ± 356.47 143.84 ± 21.64
there were differences in these parameters based on age but not gender.
The elderly gait speed was 28% slower than that of the young. These data are consistent with studies in which the average self-selected gait speed was 20% lower for the elderly than that of the young (Elble et al., 1991). When comparing the gait of healthy individuals at different speeds, the perimeter and area have an almost linear relationship with the
average gait speed, but the relationship P/√A remains
approximately constant (Goswami, 1998). The results in this paper support this premise because there
were no statistically signiicant differences in the P/√A ratio amongst groups (Table 2). Additionally,
linearity between average speed, cyclogram perimeter,
and area were also veriied as the slower elderly
speeds produced cyclograms with a smaller area and perimeter. Conversely, the young’s greater speed implied cyclograms with a greater area and perimeter.
Gait can be represented in a simpliied manner
through the location of the hip-knee coordinates in a plane (Goswami, 1998), allowing cyclograms with
different geometric conigurations. The shape of the
cyclogram can provide a more complete picture, associating speed, movement amplitude (MA), area and perimeter simultaneously, thus presenting a better overview of the hip and knee characteristics during the gait cycle. It is known that in pathological conditions, such as hip and knee osteoarthritis, there is a reduction in gait speed (Magalhães et al., 2013; Mündermann et al., 2004; Watelain et al., 2001) that
alters the geometric coniguration of the cyclogram.
Therefore, gait analysis through cyclograms can
facilitate the classiication and grading of osteoarthritis.
It is known that the movement amplitude of knees
is inluenced by age. According to Ostrosky et al.
(1994), who evaluated MA in the gait of 30 young individuals (15 of each gender) and 30 elderly (15 of each gender), the senile group presented lower values in knee extension (Ostrosky et al., 1994). Data analysis shows that the young had greater cyclogram areas than the elderly, leading to greater mobility in that group
(Goswami, 1998). The decline in lexibility of the
elder population may be due to tendon and ligament
stiffness and joint capsules due to deiciencies in
collagen (Shephard, 2003). Moreover, there is also accentuated loss of muscle strength in the elderly (Kwon et al., 2001; van der Krogt et al., 2012) that can also impact MA reduction (Guccione, 2002). So, slower self-selected speeds were associated with smaller MA in the elderly, resulting in a reduction in cyclogram perimeter and area. Although there were
only statistically signiicant differences in the area
between the YM and EM when the treadmill was raised to a 5° incline, there was a strong trend in that direction between the YF and EF. This trend was similarly observed in the perimeter between the YM and EM and also between the YF and EF.
According to Araújo (2008), women exhibit more lexibility than men from the age of ive (5%),
with the difference being accentuated after puberty (approximately 10 to 15%), and progressively
increasing in elderly (20%) (Araújo, 2008). However,
the cyclogram analysis performed in this study was not effective at identifying male and female cyclograms in
the same age group because no signiicant differences in
based on gender in any of the studied variables (as shown in Table 2 and Table 3). Males, although less
lexible, have greater muscular strength than females
(Hannah et al., 2012; Inglis et al., 2013) and can
compensate for their reduced lexibility with their
greater muscular strength, keeping the their MA and cyclogram parameters similar to those of the female group. It is therefore suggested that parameters with greater mathematical complexity, such as excentricity and cyclogram moments (Goswami, 1998), are needed to differentiate gait by gender.
Although the hip-knee cyclogram analysis could
not be used for gender identiication of the volunteers,
the hip-knee cyclogram developed in this study was a useful method for simple and practical gait analysis.
The investigation of the A, P, and P/√A ratio allowed the classiication of subjects by age group, especially
at a 5° incline. However, it is believed that gender
identiication may be achieved by employing more
advanced data processing techniques, for example,
artiicial intelligence tools such as neural networks
(Barton and Lees, 1997; Kutilek and Farkasova, 2011). Another possibility would be to use more sophisticated instruments to enable three-dimensional gait analysis and, consequently, the search for new parameters to determine gender.
The reduced number of cameras used, two-dimensional analysis, the number of angles of the
treadmill, and the joints examined can be considered
limitations of this study. However, despite these limitations, this study was able to differentiate the gait between individuals from two age groups when they were walking on a 5° inclined treadmill. Another limitation to be considered is the adoption of different
self-selected speeds for each subject, although this
procedure was used in several previous studies found in the literature (Borghese et al., 1996; Kutilek and Farkasova, 2011).
Finally, it should be noted that quantitative gait analysis is currently limited, with very few exceptions, to research laboratory environments due to the high cost of the equipment used. This study sought to provide an affordable quantitative tool that although lacking in the temporal dimension, allows greater simplicity and provides a quick method of data analysis enabling its use in guiding health professionals in the
characterization of simpliied gait, supporting clinical,
surgical, and therapeutic monitoring.
References
Associação Brasileira de Normas Técnicas - ABNT. NBR 9050: acessibilidade a ediicações, mobiliário, espaços e equipamentos urbanos. Rio de Janeiro: ABNT; 2004. Araújo C. Flexibility assessment: normative values for lexitest from 5 to 91 years of age. Arquivos Brasileiros de Cardiologia. 2008; 90(4):280-7.
Barton J, Lees A. An application of neural networks for distinguishing gait patterns on the basis of hip-knee joint angle diagrams. Gait & Posture. 1997; 5(1):28-33. http:// dx.doi.org/10.1016/S0966-6362(96)01070-3
Borghese NA, Bianchi L, Lacquaniti F. Kinematic determinants of human locomotion. Journal of Physiology. 1996; 493(3):863-79.
Callisaya ML, Blizzard L, Schmidt MD, McGinley JL, Srikanth VK. Sex modiies the relationship between age and gait: a population-based study of older adults. The Journals of Gerontology Series A: Biological Sciences and Medical Sciences. 2008; 63(2):165-70. http://dx.doi. org/10.1093/gerona/63.2.165
Cavanagh P, Grieve D. The graphical display of angular movement of the body. British Journal of Sports Medicine. 1973; 7:129-33.
Charteris J, Leach D, Taves C. Comparative kinematic analysis of bipedal and quadrupedal locomotion: a cyclographic technique. Journal of Anatomy. 1979; 128(Pt 4):803. PMid:489468 PMCid:PMC1232882.
Daly RM, Rosengren BE, Alwis G, Ahlborg HG, Sernbo I, Karlsson MK. Gender speciic age-related changes in bone density, muscle strength and functional performance in the elderly: a-10 year prospective population-based study. BMC Geriatrics. 2013; 13(1):71. PMid:23829776 PMCid:PMC3716823. http://dx.doi.org/10.1186/1471-2318-13-71
Decker L, Berge C, Renous S, Penin X. An alternative approach to normalization and evaluation for gait patterns: procrustes analysis applied to the cyclograms of sprinters and middle-distance runners. Journal of Biomechanics. 2007; 40(9):2078-87. PMid:17462657. http://dx.doi.org/10.1016/j. jbiomech.2006.10.005
El Haber N, Erbas B, Hill K, Wark J. Relationship between age and measures of balance, strength and gait: linear and non-linear analyses. Clinical Science. 2008; 114:719-27. PMid:18092948. http://dx.doi.org/10.1042/CS20070301 Elble RJ, Thomas SS, Higgins C, Colliver J. Stride-dependent changes in gait of older people. Journal of Neurology. 1991; 238(1):1-5. PMid:2030366. http://dx.doi.org/10.1007/ BF00319700
Ellermeijer T, Heck A, editors. Walk like a physicist: an example of authentic education. Proceedings of the GIREP 2002 Conference Physics in New Fields; 2003; Lund, Sweden. Forczek W, Staszkiewicz R. An evaluation of symmetry in the lower limb joints during the able-bodied gait of women and men. Journal of Human Kinetics. 2012; 35:47-57. PMid:23486255 PMCid:PMC3588688. http://dx.doi. org/10.2478/v10078-012-0078-5
Goswami A. A new gait parameterization technique by means of cyclogram moments: Application to human slope walking. Gait & Posture. 1998; 8(1):15-36. http://dx.doi. org/10.1016/S0966-6362(98)00014-9
Grieve D. Gait patterns and the speed of walking. Biomedical Engineering. 1968; 3(3):119-22.
Guccione AA. Fisioterapia geriátrica. Rio de Janeiro: Guanabara Koogan; 2002.
individuals: a systematic review. Journal of The Royal Society Interface. 2011; 8(65):1682-98. PMid:21880615 PMCid:PMC3203491. http://dx.doi.org/10.1098/ rsif.2011.0416
Hannah R, Minshull C, Buckthorpe MW, Folland JP. Explosive neuromuscular performance of males versus females. Experimental Physiology. 2012; 97(5):618-29. PMid:22308163.
Inglis JG, Vandenboom R, Gabriel DA. Sex-related differences in maximal rate of isometric torque development. Journal of Electromyography and Kinesiology. 2013; 23(6):1289-94. PMid:24148962. http://dx.doi.org/10.1016/j. jelekin.2013.09.005
Inman VT, Ralston HJ, Todd F. Human walking. London: Williams & Wilkins; 1981.
Kendall FP, McCreary EK, Provance PG, Abeloff D, Andrews PJ, Krausse CC. Músculos. Provas e funções: com postura e dor. Barueri: Manole; 2007.
Kerrigan DC, Todd MK, Della Croce U, Lipsitz LA, Collins JJ. Biomechanical gait alterations independent of speed in the healthy elderly: evidence for speciic limiting impairments. Archives of Physical Medicine and Rehabilitation. 1998; 79(3):317-22. http://dx.doi.org/10.1016/ S0003-9993(98)90013-2
Kutilek P, Farkasova B. Prediction of lower extremities’ movement by angle-angle diagrams and neural networks. Acta of Bioengineering and Biomechanics. 2011; 13(2):57-65. PMid:22097908.
Kwon IS, Oldaker S, Schrager M, Talbot LA, Fozard JL, Metter EJ. Relationship between muscle strength and the time taken to complete a standardized walk-turn-walk test. The Journals of Gerontology Series A: Biological Sciences and Medical Sciences. 2001; 56(9):B398-404. PMid:11524441. http://dx.doi.org/10.1093/gerona/56.9.B398
Magalhães CMB, Resende RA, Kirkwood RN. Increased hip internal abduction moment and reduced speed are the gait strategies used by women with knee osteoarthritis. Journal of Electromyography and Kinesiology. 2013; 23(5):1243-9. PMid:23871653. http://dx.doi.org/10.1016/j. jelekin.2013.05.013
Mah C, Hulliger M, O’Callaghan I, Lee R. Quantitative kinematics of gait patterns during the recovery period after stroke. Journal of Stroke and Cerebrovascular Diseases. 1999; 8(5):312-29. http://dx.doi.org/10.1016/S1052-3057(99)80006-8
Mündermann A, Dyrby CO, Hurwitz DE, Sharma L, Andriacchi TP. Potential strategies to reduce medial compartment loading in patients with knee osteoarthritis of varying severity: reduced walking speed. Arthritis &
Rheumatism. 2004; 50(4):1172-8. PMid:15077299. http:// dx.doi.org/10.1002/art.20132
Ostrosky KM, Van Swearingen JM, Burdett RG, Gee Z. A comparison of gait characteristics in young and old subjects. Physical Therapy. 1994; 74(7):637-44. PMid:8016196. Prince F, Corriveau H, Hébert R, Winter DA. Gait in the elderly. Gait & Posture. 1997; 5(2):128-35. http://dx.doi. org/10.1016/S0966-6362(97)01118-1
Riley PO, Paolini G, Della Croce U, Paylo KW, Kerrigan DC. A kinematic and kinetic comparison of overground and treadmill walking in healthy subjects. Gait & Posture. 2007; 26(1):17-24. PMid:16905322. http://dx.doi.org/10.1016/j. gaitpost.2006.07.003
Shephard RJ. Envelhecimento, atividade física e saúde. São Paulo: Phorte; 2003.
Shumway-Cook A, Guralnik JM, Phillips CL, Coppin AK, Ciol MA, Bandinelli S, Ferrucci, L. Age-associated declines in complex walking task performance: the walking InCHIANTI toolkit. Journal of the American Geriatrics Society. 2007; 55(1):58-65. PMid:17233686 PMCid:PMC2645671. http:// dx.doi.org/10.1111/j.1532-5415.2006.00962.x
Skelton DA, Greig CA, Davies JM, Young A. Strength, power and related functional ability of healthy people aged 65-89 years. Age and Ageing. 1994; 23(5):371-7. PMid:7825481. http://dx.doi.org/10.1093/ageing/23.5.371
Van der Krogt MM, Delp SL, Schwartz MH. How robust is human gait to muscle weakness? Gait & Posture. 2012; 36(1):113-9. PMid:22386624. http://dx.doi.org/10.1016/j. gaitpost.2012.01.017
Veras R. Envelhecimento populacional contemporâneo: demandas, desaios e inovações. Revista de Saúde Pública. 2009; 43(3):548-54. PMid:19377752. http://dx.doi. org/10.1590/S0034-89102009005000025
Watelain E, Dujardin F, Babier F, Dubois D, Allard P. Pelvic and lower limb compensatory actions of subjects in an early stage of hip osteoarthritis. Archives of Physical Medicine and Rehabilitation. 2001; 82(12):1705-11. PMid:11733886. http://dx.doi.org/10.1053/apmr.2001.26812
Watt JR, Franz JR, Jackson K, Dicharry J, Riley PO, Kerrigan DC. A three-dimensional kinematic and kinetic comparison of overground and treadmill walking in healthy elderly subjects. Clinical Biomechanics. 2010; 25(5):444-9. PMid:20347194. http://dx.doi.org/10.1016/j.clinbiomech.2009.09.002 Whitney S, Wrisley D, Furman J. Concurrent validity of the Berg Balance Scale and the Dynamic Gait Index in people with vestibular dysfunction. Physiotherapy Research International. 2003; 8(4):178-86. PMid:14730722. http:// dx.doi.org/10.1002/pri.288
Authors
Ródney Silva Abreu, Eduardo Lázaro Martins Naves*, Thiago Bruno Caparelli, Daniel Teodoro Gonçalves Mariano
Biomedical Engineering Lab, Faculty of Electrical Engineering, Federal University of Uberlandia – UFU, Av. João Naves de Ávila, 2121, Campus Santa Mônica, Bloco 3N, Sala 3N306, CEP 38408-100, Uberlândia, MG, Brazil
Valdeci Carlos Dionísio