This study evaluated the influence of the manipulation technique and polishing method on the flexural strength and cytotoxicity of acrylic resins. Two manipulation techniques and three polishing methods were used in the fabrication of acrylic plates that were divided into 6 groups (n=10). Groups MM, MC and MW: mass technique with mechanical polishing, chemical polishing and without polishing, respectively; and Groups SM, SC and SW: Saturation technique with mechanical polishing, chemical polishing and without polishing, respectively). Flexural strength was tested in a universal testing machine and the cytotoxicity assay used cell cultures (L-929) for periods of 24 h to 168 h. Flexural strength and cytotoxicity data were assessed using two-way and three-way ANOVA, respectively (a=0.05), followed by post hoc Bonferroni test for multiple comparisons. The effect of combinations of manipulation techniques and polishing methods on flexural strength showed significant differences only between Group SC and Groups MW, MM and MC (p<0.01). Cell viability ranged from 51% (3.9%) to 87,6% (3.2) in the 24-h time interval, and from 87.8% (5.0) to 95.7% (3.1%) in the 168-h time interval. With the increase of cell viability, from the third day (72 h), there was no significant difference among the groups, except between MM and SC (p<0.01) at 72 h. In conclusion, the manipulation technique and polishing method had more influence on the cytotoxicity than on flexural strength.
Mechanical and Biological Properties
of Acrylic Resins Manipulated and
Po l i s h e d b y D i f f e r e n t M e t h o d s
Rogério Lacerda dos Santos1, Matheus Melo Pithon2, Fabiola Galbiatti Carvalho1, Aretha Aliny dos Santos Ramos3, Maria Teresa Villela Romanos4
1Department of Orthodontics
and Pediatric Dentistry, UFCG - Federal University of Campina Grande, Patos, PB, Brazil
2Department of Orthodontics, UESB
- State University of Southwest Bahia, Jequié, BA, Brazil
3Graduate Program in Dentistry,
UFPB - Federal University of Paraíba, João Pessoa, PB, Brazil
4Department of Microbiology,
UFRJ - Federal University of Rio de Janeiro, Rio de Janeiro, RJ, Brazil
Correspondence: Rogério Lacerda dos Santos, Avenida dos Universitários, S/N, Rodovia Patos/Teixeira, Km 1, Santa Cecília, 58700-970 Patos, PB, Brasil. Tel: +55-83-9977-7100. e-mail: lacerdaorto@hotmail. com or [email protected]
Key Words: acrylic resins, flexural strength, cytotoxicity.
Introduction
The placement of removable orthodontic appliances for tooth movements and splinting in a healthy oral cavity may induce biofilm accumulation (1), alter the normal oral microflora (2), exacerbate periodontal diseases, and consequently cause infections (3).
Since the introduction of acrylic resins began until now, two techniques have been most commonly used: polymerization activated by visible light and chemical polymerization at room temperature (4,5) with the goal of improving their physical properties like occurrence of porosities (5) and reducing the polymerization process time (6). However, conversion of monomers into polymers is never complete, especially in autopolymerized acrylic resins (7). The residual monomer content varies considerably with the curing conditions and the amount of residual monomer is one of the primary factors affecting the properties of acrylic resins (6,8). Studies (9,10)have reported that variable quantities of residual monomer may be released in the oral cavity during the use of removable orthodontic appliances.
Furthermore, polishing is an important factor for obtaining smooth surfaces of the acrylic resins, which favors the reduction of the amount of released residual monomer (10,11). Chemical polishing has shown higher surface roughness than the mechanic, influencing more the mechanical and biological properties of resins, either for
microorganism accumulation or residual monomers release (11), which may be related to greater incorporation of monomers during chemical polishing.
Residual monomers may alter the final physical properties of resins (10) and induce the arise of local and systemic tissue reactions when in contact with saliva and soft tissues (12), causing hypersensitivity, allergic reactions, cell toxicity (13) and systemic involvements (14).
In addition, this material may easily fracture due to its low impact resistance, low flexural strength or low resistance to fatigue (15). Another great disadvantage of acrylic resins is the rapid loss of esthetic, physical and mechanical properties in the oral medium because this material absorbs and releases water (16).
The aim of this study was to verify the influence of the manipulation technique and polishing method on the flexural strength and cytotoxicity of acrylic resins.
Material and Methods
Test Specimen Fabrication
493
Properties of acrylic resins
technique combined with mechanical polishing, chemical polishing and no polishing, respectively; Groups SM, SC and SW: saturation technique combined with mechanical polishing, chemical polishing and no polishing, respectively.
In the mass technique, the powder and liquid were manipulated in a ratio of 3:1, according to the manufacturer’s instructions. The specimens were made in a condensation silicone mold (Perfil, Vigodent, Rio de Janeiro, RJ, Brazil) with internal dimensions of 26x6x4 mm, which served as a negative control (7). In the saturation technique, the specimens were fabricated by increments of powder/liquid until saturation, adding small quantities of monomer and polymer to the silicone matrix with a dropper. Polymerization occurred within a resin polymerizer (M-1000; EDG, São Carlos, SP, Brazil), at 20 °C, 25 psi (1.75 kg/ cm²) pressure, for 15 min, according to the manufacturer’s instructions. Excess material was removed progressively using abrasive papers with granulations of 150, 400 and 600 in a polishing machine APL-4 (Arotec, Cotia, SP, Brazil), to obtain the desired dimensions, which were measured with a precision caliper (123M-150; Starrett, Itu, SP, Brazil). For mechanical polishing, a bristle brush with pumice stone was used (Labordent, São Paulo, SP, Brazil) followed by the application of a felt tip, both using a polishing lathe (Nevoni, São Paulo, SP, Brazil), during 1 min each step. The final polishing step was performed with a flannel wheel and white paste of Spain (Labordent), during 1 min each step. For the specimens submitted to chemical polishing a chemical polisher PQ9000 (Termotron, Piracicaba, SP, Brazil) was used associated with Poli-Quim polishing fluid (Clássico Produtos Odontológicos Ltda, São Paulo, SP, Brazil). When the liquid reached the ideal temperature (80 °C), each test specimen was individually immersed and remained in the receptacle for 10 s. All specimens were fabricated and polished by the same operator.
After polishing, all specimens were stored in deionized water at 37 ºC (Millipore, Bedford, MA, USA) for 24 h (17) so that the superficial residual monomers could be released, and after this the specimens were submitted to the tests.
Flexural Strength Test
The three-point bending flexural test was performed in a universal test machine (DL 1000; EMIC, São José dos Pinhais, PR, Brazil) at a crosshead speed of 5 mm/min until fracture. The testing device consisted of a base with two 20-mm-high columns with ends in the form of spheres with 5 mm radius and equidistant 20 mm from one another, to support the extremities of the specimen to be tested. Force was applied at the center of the specimen that was placed 10 mm equidistant from each of the two lateral columns from one identical spherical extremity to the support with the same radius of 5 mm in order to avoid differences in
the results (7).
Vertical force was applied and the maximum flexural strength was recorded. The flexural strength was calculated from the formula α=3Fd/2bh2, where α is the flexural strength (MPa), F the maximum load exerted on the specimen acrylic (N), d the distance in mm between the supports (20 mm), b the base (5 mm) and h the height of the acrylic specimen (4 mm).
Cytotoxicity Test
Both sides of the acrylic specimens were previously sterilized with ultraviolet light (Labconco, Kansas City, MO, USA) for 30 min (18). To verify the cell response to extreme situations, other three groups were included in the study: Group CC (cell control), consisting of cells not exposed to any material; Group C+ (positive control), consisting of Tween 80 and Group C- (negative control), consisting of PBS solution in contact with the cells.
Cell culture containing L-929 line cells (mouse fibroblast) (American Type Culture Collection - ATCC, Rockville, MD, USA) was maintained in Eagle’s minimum essential medium (Cultilab, Campinas, SP, Brazil) by adding 0.03 mg/mL of glutamine (Sigma, St. Louis, MO, USA), 50 µg/mL of garamicine (Schering Plough, Kenilworth, NJ, USA), 2.5 mg/mL of fungizone (Bristol-Myers-Squibb, New York, NY, USA), 0.25% sodium bicarbonate solution (Merck, Darmstadt, Germany), 10 mM of HEPES (Sigma) and 10% bovine fetal serum (Cultilab, Campinas, SP, Brazil) to the growth medium, or no bovine fetal serum to the maintenance medium only. After this, the cell culture medium was incubated at 37 °C for 48 h.
The method for evaluating the cytotoxicity was the “dye-uptake” test (19). This method is based on a neutral red dye incorporated into live cells. It was used in this experiment only for the following periods of evaluation: 24, 48, 72 and 168 h (7 days). These periods represent the time intervals of 24, 48, 72 and 168 h during which the acrylic specimens remained in the cell culture medium before being removed.
Dye Uptake
R.L. dos Santos et al.
so that the red dye could penetrate the live cells. After this period of time, 100 µL of 4% formaldehyde solution (Vetec, Rio de Janeiro, RJ, Brazil) in PBS (130 mM of NaCl; 2 mM of KCl; 6 mM of Na2HPO4 2 H2O; 1 mM of K2HPO4 1 mM; pH 7.2) were added in order to promote the fixation of the attached cells to the plate. After 5 min, 100 µL of 1% acetic acid (Vetec) and 50% methanol (Vetec) were added in order to remove the dye. After 20 min, a spectrophotometer (BioTek, Winooski, VT, USA) at 492 nm wavelength (λ=492 nm) was used to read the data.
Statistical Analysis
Statistical analysis was performed with BioEstat software program (version 5.0, Belém, PA, Brazil). For each evaluated parameter, descriptive statistical procedures were used, including mean and standard deviation. The homogeneity of the data was verified by the Levene test, and normality of residues verified by the Shapiro-Wilk test. Two-way analysis of variance (ANOVA) and three-way ANOVA were used for flexural strength data and cell viability data, respectively. The level of significance adopted was 5%. Post hoc Bonferroni comparisons were performed for multiple comparisons.
Results
Flexural Test
The mass technique presented better performance and higher mean flexural strength values when compared with the saturation technique. The order of groups ranging from the highest to the lowest flexural
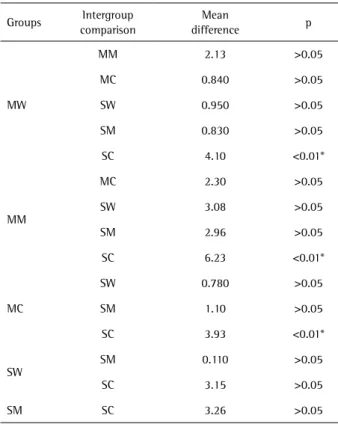
strength (MPa) was: MM (37.26±2.19), MW (35.13±2.06), MC (34.96±2.32), SM (34.29±1.89), SW (34.18±1.52) and SC (31.02±1.67). There were significant statistically differences only between the group SC with the groups MW, MM and MC (p<0.01) (Table 1).
Two-way ANOVA analysis indicated significant differences between the three polishing methods and the two manipulation techniques (p<0.01). However, the technical and polishing interaction was not significant (p=0.127). The effect of polishing methods on the manipulation technique was not different between the groups.
Cytotoxicity Test
Viability was established by comparison with the viability of control cells, which was arbitrarily set at 100%. Cell viability ranged from 51% (±3.9%) to 87,6% (±3.2%) in the 24-h time interval and from 87.8% (±5.0%)
to 95.7% (±3.1%) in the 168-h time interval in comparison with the control group (Table 2).
Table 1.Multiple comparisons test of the flexural strength between the groups
Groups Intergroup comparison
Mean
difference p
MW
MM 2.13 >0.05
MC 0.840 >0.05
SW 0.950 >0.05
SM 0.830 >0.05
SC 4.10 <0.01*
MM
MC 2.30 >0.05
SW 3.08 >0.05
SM 2.96 >0.05
SC 6.23 <0.01*
MC
SW 0.780 >0.05
SM 1.10 >0.05
SC 3.93 <0.01*
SW
SM 0.110 >0.05
SC 3.15 >0.05
SM SC 3.26 >0.05
Two-way ANOVA, followed by Bonferroni Post Hoc multiple comparisons test. *Represent statistically significant difference at p<0.05.
Table 2. Descriptive statistics of the cell viability of acrylic resins in the 1-day to 7-day periods
Manipulation technique
Polishing method
1 d (24 h)
2 d (48 h)
3 d (72 h)
7 d (168 h)
M (SD)* M (SD) M (SD) M (SD)
Mass technique
None 78.7 (6.1) 90.1 (5.2) 91.1 (5.1) 91.2 (4.3)
M 87.6 (3.2) 91.5 (4.7) 93.8 (3.9) 95.7 (3.1)
C 70.6 (4.6) 78.2 (5.5) 87.1 (5.6) 90.2 (4.5)
Saturation technique
None 59.1 (5.6) 81.1 (5.1) 86.0 (5.0) 89.9 (7.3)
M 68.2 (5.7) 83.1 (6.1) 91.6 (5.5) 91.1 (5.6)
C 51.0 (3.9) 70.3 (7.4) 83.0 (4.1) 87.8 (5.0)
C- 96.9 (2,9) 95.5 (4.4) 96.4 (3.5) 95.0 (3.3)
C+ 13.8 (1.1) 10.5 (1.4) 9.6 (1.1) 8.4 (1.1)
CC 100 100 100 100
495
Properties of acrylic resins
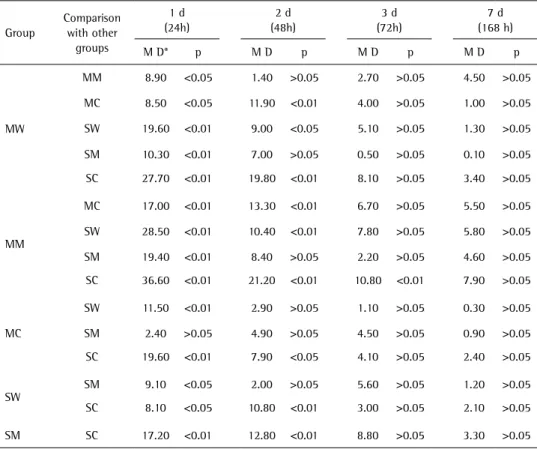
Table 3. Multiple comparisons test of the cell viability of acrylic resins between the groups
Group
Comparison with other
groups
1 d (24h)
2 d (48h)
3 d (72h)
7 d (168 h)
M D* p M D p M D p M D p
MW
MM 8.90 <0.05 1.40 >0.05 2.70 >0.05 4.50 >0.05
MC 8.50 <0.05 11.90 <0.01 4.00 >0.05 1.00 >0.05
SW 19.60 <0.01 9.00 <0.05 5.10 >0.05 1.30 >0.05
SM 10.30 <0.01 7.00 >0.05 0.50 >0.05 0.10 >0.05
SC 27.70 <0.01 19.80 <0.01 8.10 >0.05 3.40 >0.05
MM
MC 17.00 <0.01 13.30 <0.01 6.70 >0.05 5.50 >0.05
SW 28.50 <0.01 10.40 <0.01 7.80 >0.05 5.80 >0.05
SM 19.40 <0.01 8.40 >0.05 2.20 >0.05 4.60 >0.05
SC 36.60 <0.01 21.20 <0.01 10.80 <0.01 7.90 >0.05
MC
SW 11.50 <0.01 2.90 >0.05 1.10 >0.05 0.30 >0.05
SM 2.40 >0.05 4.90 >0.05 4.50 >0.05 0.90 >0.05
SC 19.60 <0.01 7.90 <0.05 4.10 >0.05 2.40 >0.05
SW SM 9.10 <0.05 2.00 >0.05 5.60 >0.05 1.20 >0.05
SC 8.10 <0.05 10.80 <0.01 3.00 >0.05 2.10 >0.05
SM SC 17.20 <0.01 12.80 <0.01 8.80 >0.05 3.30 >0.05
Three-way ANOVA, followed by Bonferroni post hoc multiple comparisons test. p: Indicate statistically significant difference (p<0.01 or p<0.05). *MD: Mean difference.
Table 4. Multiple-comparison test of cell viability of acrylic resins between the time intervals
Time Comparison with other time intervals
Groups
MW MM MC SW SM SC
M D* p M D p M D p M D p M D p M D p
1 d (24h)
2 d (48h) 11.40 <0.01 3.90 >0.05 7.60 <0.05 22.00 <0.01 14.90 <0.01 19.30 <0.01
3 d (72h) 12.40 <0.01 6.20 >0.05 16.5 <0.01 26.90 <0.01 23.40 <0.01 26.00 <0.01
7 d (168 h) 12.50 <0.01 8.10 <0.05 19.60 <0.01 30.80 <0.01 22.90 <0.01 36.80 <0.01
2 d (48h)
3 d (72h) 1.00 >0.05 2.30 >0.05 8.90 >0.05 4.90 >0.05 8.50 >0.05 12.70 <0.01
7 d (168 h) 1.10 >0.05 4.20 >0.05 12,00 <0.01 8.80 >0.05 8.00 >0.05 17.50 <0.01
3 d (72h) 7 d (168 h) 0.10 >0.05 1.90 >0.05 3.10 >0.05 3.90 >0.05 0.10 >0.05 4.80 >0.05
Three-way ANOVA, followed by Bonferroni post hoc multiple comparisons test. p: Represent statistical difference (p<0.01 or p<0.05). *MD: Mean difference.
Three-way ANOVA indicated a significant effect in the technique and polishing interaction (p<0.01), and technique and time interaction (p<0.01). This variation may possibly be due to the differences between the techniques and polishing methods, and between technique and evaluation times, respectively. However, the time and polishing methods
interaction showed no statistical difference (p=0.960). Altogether, these findings indicate that the technique had more influence on cell viability that the polishing method on the evaluated times.
R.L. dos Santos et al.
between them, except between the groups MC and SM (p>0.05). On the second day (48 h) there was an increase in cell viability for all groups, but without statistically significant difference between the group MW and the groups MM and SM; between the group SM and the groups SW, MM and MC; and between the groups MC and SW (p>0.05) (Table 3). From the third day (72 h) on, there was no significant difference among all groups, regardless of the manipulation technique and polishing method, except for the groups MM and SC (p<0.01) in the 72-h time interval.
In the evaluation of the time intervals, the first day differed significantly from all other evaluated times for the groups MW, MC, SW, SM, SC (p<0.01). In the second day, with the increase of cell viability in the groups, there was no statistically significant difference among the groups MW, MM, SW and SM in the comparison with the third and seventh days (168 h) (p>0.05). The third day showed no significant difference with the seventh day for all groups (p>0.05) (Table 4).
Discussion
In this study, as far as the cytotoxicity test is concerned, the cell culture model used was in monolayer (18-20). This model was used together with the dye-uptake technique (19) because the cytotoxicity of materials can be determined by spectrophotometry (20). L-929 mouse fibroblasts were used in this study because they provide results comparable with those of primary human gingival fibroblasts (21,22). Considering the variability of the results, one can infer that the association between the saturation technique of fabrication and the chemical polishing method had a more significant influence on the flexural strength results, as shown in the group SC, which differed significantly from the groups MW, MM and MC (p<0.01) (Table 1). In the cytotoxicity test, the group SC showed increased cell viability from the first to the seventh day, but it had the lowest cell viability among groups at all evaluated times (Table 2). This can be related to the hypothesis of a greater incorporation of monomer and consequently less condensation of the acrylic mass (17).
In the evaluation of time periods, the first day showed statistically significant difference with all other evaluated times for the groups MW, MC, SW, SM, SC, which shows the greatest cytotoxic potential of the groups at baseline (Table 3). In addition, the group SC, the group SW induced the greatest quantity of cell lysis in 24 h. It may be inferred that the release of cytotoxic substances occurs mainly in the first 24 h, which is consistent with studies (6,9,17) that found an increased release of residual monomers in this period, although it should be noted that on the second day it still showed a lower cell viability in the groups MC, SC and SW compared to the other groups (Table 3). This
could have a more relevant negative impact in patients with history of hypersensitivity to acrylic resins (14).
From the third day, there was no significant difference among most groups, regardless of manipulation technique and polishing method that represented respectively decrease of cytotoxic character and increase of cell viability with a similar performance among the groups, which was demonstrated also on seventh day (Table 4). This possibly could mean a decrease until complete absence (third to seventh day) of the inflammatory potential (11,14) of the acrylic resins on gingival tissue.
Taken together, these findings are aligned with the idea that the presence of residual monomer in resin appliances for orthodontic use may influence their clinical performance (23) with regard to their flexural strength and tissue biocompatibility. Although the acrylic resins tested by different methods presented over 50% of cell viability in all the experimental time intervals (Table 2), which does not contraindicate their clinical use, as seen in other studies (20,24) on cytotoxicity of materials (25) for use in dentistry that showed similar performance. However, the findings of this study suggest that the mass technique associated with manual polishing must be encouraged whenever possible, but the saturation technique associated with chemical polishing seems to be less suitable.
These materials are widely employed in the fabrication of appliances for use in orthodontics and pediatric dentistry, so clinical monitoring is necessary to detect cracks and fractures (10) as well as inflammatory processes (12) associated with their use. In patients with gingival hyperplasia and/or potential periodontal disease (20), direct contact of acrylic resins with these gingival tissues may increase their inflammatory (2,11) or allergenic (14) potential. Therefore, after fabrication, the resin appliance must have minimal or none cytotoxicity and, if necessary, avoid the inclusion of acrylic resin or change the appliance proposed for these patients. Within the limits of this in vitro study, it can be concluded that the manipulation technique and polishing method had more influence on the cytotoxicity than on flexural strength.
Resumo
497
Properties of acrylic resins
O efeito das combinações de técnicas de manipulação e métodos de polimento na resistência à flexão mostraram diferenças significativas apenas entre Grupo SC e Grupos MW, MM e MC (p<0,01). A viabilidade celular variou de 51,0% (3,9%) para 87,6% (3,2%) no intervalo de tempo de 24 h, e de 87,8% (5,0%) para 95,7% (3,1%) no intervalo de tempo de 168 h. Com o aumento da viabilidade celular, a partir do terceiro dia (72 h), não houve diferença significativa entre os grupos, exceto entre MM e SC (p<0,01) em 72 h. Em conclusão, a técnica de manipulação e o método de polimento tiveram maior influência sobre a citotoxicidade do que sobre a resistência à flexão.
References
1. Sukontapatipark W, el-Agroudi MA, Selliseth NJ, Thunold K, Selvig KA. Bacterial colonization associated with fixed orthodontic appliances. A scanning electron microscopy study. Eur J Orthod 2001;23:475-484. 2. Batoni G, Pardini M, Giannotti A, Ota F, Giuca MR, Gabriele M, et al..
Effect of removable orthodontic appliances on oral colonisation by mutans streptococci in children. Eur J Oral Sci 2001;109:388-392. 3. Atack NE, Sandy JR, Addy M. Periodontal and microbiological changes
associated with the placement of orthodontic appliances. A review. J Periodontol 1996;67:78-85.
4. Fajardo RS, Gennari Filho H, Goiato MC, Gonçalves WA, Marfinati SMAP. Comparative study of bond strength between artificial tooth and conventional acrylic resin, special and for the microwave with period different of polymerization. RPG - Rev Pos Grad 2004;11:145-151.
5. Goiato MC, Naves JC, Bressan RN, Santos DM, Fajardo RS, Fernandes AUR. Effect of polishing methods on the porosity and hardness of thermocycled acrylic resins. Rev Odontol Unesp 2006;35:47-52. 6. Bartoloni JA, Murchison DF, Wofford DT, Sarkar NK. Degree of
conversion in denture base materials for varied polymerization techniques. J Oral Rehabil 2000;27:488-493.
7. Telles V, Brito RMF, Urach EM, Nojima LI. Assessment of flexural strength of two self-curing acrylic resins containing pigment. Braz J Oral Sci 2009;8:137-140.
8. Harrison A, Huggett R. Effect of the curing cycle on residual monomer levels of acrylic resin denture base polymers. J Dent 1992; 20:370-374. 9. Baker S, Brooks SC, Walker DM. The release of residual monomeric
methyl methacrylate from acrylic appliances in the human mouth: an assay for monomer in saliva. J Dent Res 1988;67:1295-1299. 10. Del Bel Cury AA, Rached RN, Ganzarolli SM. Microwave-cured acrylic
resins and silicone-gypsum moulding technique. J Oral Rehabil 2001;28:433-438.
11. Goncalves TS, Spohr AM, de Souza RM, Macedo de Menezes L. Surface roughness of auto polymerized acrylic resin according to different
manipulation and polishing methods: an in situ evaluation. Angle Orthod 2008;78:931-934.
12. Jorge JH, Giampaolo ET, Machado AL, Vergani CE. Cytotoxicity of denture base acrylic resins: a literature review. J Prosthet Dent 2003;90:190-193.
13. Pithon MM, Santos RL, Martins FO, Rematoso LB, Cunha TMA, Tanaka OM, et al.. Influence of methods of manipulation in cytotoxicity of acrylic resin auto-cured. ABO Nac 2010;18:201-204.
14. Gonçalves TS, Morganti MA, Campos LC, Rizzatto SM, Menezes LM. Allergy to auto-polymerized acrylic resin in an orthodontic patient. Am J Orthod Dentofacial Orthop 2006;129:431-435.
15. Paranhos HFO, Peracini A, Pisani MX, Oliveira VC, Souza RF, Silva-Lovato CH. Color Stability, Surface Roughness and Flexural Strength of an Acrylic Resin Submitted to Simulated Overnight Immersion in Denture Cleansers. Braz Dent J 2013; 24:152-156.
16. Keif F, Etikan I. Evaluation of gloss changes of two denture acrylic resin materials in four different beverages. Dental Mater 2004;20:244-251. 17. Rocha Filho R, Paula LV, Costa VC, Seraidarian PI. Evaluation of residual
monomer in autopolymerizing acrylic resins: spectroscopy analysis. Rev Dent Press Ortod Ortop Facial 2007;12:96-104.
18. Dos Santos RL, Pithon MM, Martins FO, Romanos MT, Ruellas AC. Evaluation of cytotoxicity and degree of conversion of glass ionomer cements reinforced with resin. Eur J Orthod 2012;34:362-366. 19. Neyndorff HC, Bartel DL, Tufaro F, Levy JG. Development of a model
to demonstrate photosensitizer-mediated viral inactivation in blood. Transfusion 1990;30:485-490.
20. Santos RL, Pithon MM, Romanos MT. The influence of pH levels on mechanical and biological properties of nonlatex and latex elastics. Angle Orthod 2012;82:709-714.
21. Franz A, Konig F, Skolka A, Sperr W, Bauer P, Lucas T, et al.. Cytotoxicity of resin composites as a function of interface area. Dent Mater 2007;23:1438-1446.
22. Yeap SK, Omar AR, Ali AM, Ho WY, Beh BK, Alitheen NB. Immunomodulatory Effect of Rhaphidophora korthalsii on natural killer cell cytotoxicity. Evid Based Complement Alternat Med 2012;2012:786487.
23. Hong G, Tsuka H, Maeda T, Akagawa Y, Sasaki K. The dynamic viscoelasticity and water absorption characteristics of soft acrylic resin materials containing adipates and a maleate plasticizer. Dent Mater J 2012;31:139-149.
24. Hanson M, Lobner D. In vitro neuronal cytotoxicity of latex and nonlatex orthodontic elastics. Am J Orthod Dentofacial Orthop 2004;126:65-70.
25. Santos RL, Pithon MM, Martins FO, Romanos MT, Ruellas AC. Cytotoxicity of latex and non-latex orthodontic elastomeric ligatures on L929 mouse fibroblasts. Braz Dent J 2010;21:205-210.