*e-mail: [email protected]
Articles presented at the XV CBECIMAT, Natal - RN, November de 2002.
The Use of Niobium Based Catalysts for Liquid Fuel Production
Frank Martin Reguerab, Lucia Regina Raddi de Araujoa*, Marta Cristina Picardoa, Fábio de Oliveira Belloa, Cynthia Fraga Scofielda, Nídia Maria Ribeiro Pasturaa,b,
Wilma de Araujo Gonzalezb
a
Universidade do Estado do Rio de Janeiro, Inst. Química, Rua São Francisco Xavier, 524, 20559-900 Maracanã, Rio de Janeiro - RJ, Brazil
b
Instituto Militar de Engenharia, Dep. Engenharia Química Praça General Tibúrcio, 80, 22290-270 Urca, Rio de Janeiro - RJ, Brazil
Received: February 12, 2003; Revised: November 13, 2003
The catalytic properties of niobium based catalysts were investigated in the conversion of oleic acid to liquid fuels at atmospheric pressure and at 623 K. The catalytic tests were performed in a fixed bed and continuous flow reactor using an acid to catalyst ratio equal to 4 and N2 as carrier gas. The reaction products were analyzed by gas chromatography and acidity measure-ments. NH3 temperature programmed desorption, N2 adsorption-desorption (BET method) and X-ray diffraction were also performed in order to determine the structural and acidic properties of the catalysts. From the catalytic tests, it was detected the formation of compounds in the range of gasoline, diesel and lubricant oils. Higher catalytic activity and selectivity for diesel fuel were observed for the catalysts NbOPO4 and H3PO4/Nb2O5 that possesses higher acidities and surface areas.
Keywords:niobium, oleic acid, bio-diesel
1. Introduction
Diesel fuel plays an essential role in the economic activ-ity of any country as it is used in different kinds of vehicles, electric generators, agricultural equipments, etc. Due to the worldwide expected growth rate of its consumption as well as the reduction of petroleum resources, the interest and researches for suitable alternative diesel fuels have increased in the last years1.
An alternative to diesel must be economically competi-tive, easily available and acceptable from both technical and environmental viewpoints. Vegetal oils (constituted of 90-98% triglycerides) and their derivatives fulfill all of these requirements. Moreover, the comparison of petrodiesel and biodiesel shows that biodiesel presents many beneficial char-acteristics as its biodegradability, a high cetane number and the absence of sulfur and aromatics which contributes to reduce environmental pollutants.
In the exploitation of vegetable oil for substitution to diesel, three distinct routes are possible2:
•
The direct use of pure vegetable oil. Although this route is economically attractive, it brings serious problems of adjustment as the physical and chemical properties of the vegetable oil, such as density, viscosity and flash point, are quite different from diesel. Another point to be considered is that the products obtained from veg-etal oil combustion would be also different and this could not only compromise the metallic parts of the engine but also generate new pollutants in the atmos-phere, possibly sufficiently toxic.•
The catalytic degradation of the triglycerides with pro-duction of a mixture of hydrocarbons almost similar to diesel. Concerning the quality of the fuel, this route is the best one, since it would be necessary no modifi-cation or adaptation of the engines.Although in the last years many catalytic systems have been investigated for the conversion of vegetal oils to fuel, their effective action is still little known3-8.
The great amounts of raw materials in Brazil concern-ing both vegetable oils and niobium, as well as the knowl-edge that niobium based catalysts can be efficient in differ-ent industrial processes9-10, have motivated us in our research. So, the aim of this work is to study the viability of the use of niobium as a catalytic agent in the conversion reaction of the oleic acid to hydrocarbons in the range of diesel oil (C14 -C18). The oleic acid was chosen as reactant as it is the major constituent of the soy oil.
2. Experimental
2.1. Catalysts Preparation
The start materials were niobium phosphate (NbOPO4) and niobic acid (H8Nb6O19), which were donated by the Brazilian Company of Metallurgy and Mineration (CBMM). Three samples were prepared: NbOPO4, Nb2O5 and H3PO4/Nb2O5. NbOPO4 was submitted to calcination at 623 K. Nb2O5 resulted from the thermal treatment of H8Nb6O19 up to 623 K and the third catalyst H3PO4/Nb2O5 was pre-pared by wetness impregnation of a 12% H3PO4 solution into the support Nb2O5.Then, this sample was dried over-night at 373 K and calcined in an oven at 623 K for 2 h.
2.2. Catalysts Characterization
The textural properties of the samples such as specific area, average pore diameter and pore volume were deter-mined by N2 physical adsorption-desorption (BET method) at its normal boiling temperature (77 K) with an ASAP 2000 Micromeritics apparatus. Prior to the analysis, the catalyst was submitted to a preheating treatment at 423 K under vacuum of 15 × 10-6 mmHg. The BET isotherms were taken at pressures between 45-160 mmHg using super dry N2.
The acid sites distributions were obtained with the NH3 temperature programmed desorption technique (TPD-NH3). Initially, the samples were treated for 0.5 h under pure He flow of 60 mL/min using a heating rate of 10 K/minup to 473 K. The chemisorption of 4%NH3/He was carried out at room temperature for 0.5 h and the excess of fisisorbed mol-ecules was removed by vacuum during 1.5 h at the same tem-perature. Finally, the ammonia termodesorption analysis was performed using a heating rate of 10 K/min up to 773 K.
Powder X-ray data for structural analysis were collected with a Siemens X-ray diffractometer using Cu Kα radiation over a 1h40min period from 2θ = 3 – 80°, with a 1.0 s step.
2.3. Catalytic Tests
The oleic acid conversion to hydrocarbons had been car-ried out at 623 K in a fixed bed and continuous flow reactor. A scheme of the catalytic unit is illustrated in Fig. 1. The catalytic bed was constituted by 5 g of catalyst and 5 cm of small glass balls. The catalyst was pre-treated in situ during
2 h under N2 flow at 623 K. After this treatment, the reac-tant was introduced into the reactor inlet by a pump (reac-tant flow = 20.5 g/h). The liquid products were collected after passing through a condenser connected to reactor out-let. During the test, two samples were withdrawn from the reactor effluents at 30 min and 60 min for posterior acidity value determination (Ma) as well as for chromatographic analysis (GC). These analysis were performed in order to bring informations about the degree of acid descarboxilation
and to obtain the hydrocarbon product distribution in the ranges of gasoline, diesel and lubricant oil. The material that remained in the reactor after the reaction was weighed and considered as a residue.
2.4. Acidity Measurements of the Liquid Products
A solution of ethyl alcohol and benzene (volumetric ra-tio equal to 1) was initially added to a weighed amount of the liquid product. Afterwards, it was titrated with an alco-holic solution of 0,1 mol/L KOH using phenolphtalein as indicator. The amount of free acid was obtained using the following expression:
where:
Ma = acidity measurement
VKOH = volume of KOH spent in titration MKOH = KOH solution concentration
fKOH = correction factor for KOH solution concentration Pa = weight of the sample product
3. Results and Discussion
3.1. Specific Area and Porosity
The results obtained from textural characterization of the samples are shown in Table 1. All catalysts had pre-sented type IV adsorption-desorption isotherms according to Brunauer-Emmett-Teller classification, which increases the confidence of the method in the determination of po-rous properties.
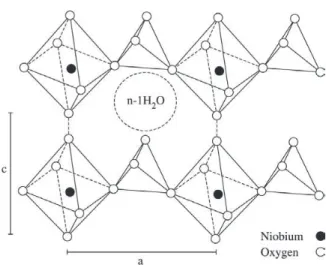
The results obtained with the Nb2O5 catalyst are in good agreement with those reported in the literature11. Compar-ing the textural properties of Nb2O5 and NbOPO4 catalysts, it is observed that both have practically the same specific areas. Nevertheless, NbOPO4 catalyst has higher pore vol-ume and pore diameter values. This behavior can be ex-plained by the presence of a lamelar structure for the NbOPO4 compound where the formed layers consist of octaedrons [NbO6]connected in the equatorial plan by tet-rahedrons [PO4], as can be seen in Fig. 212. Individual layer is electrically neutral and interacts by hydrogen bonding, allowing the occlusion of neutral molecules that increase
Table 1. Textural properties of the samples.
Catalyst Specific Area Pore Volume Medium Pore
(m2/g) (cm3/g) Diameter (Å)
Nb2O5 115 0.15 41.7
H3PO4/Nb2O5 78 0.13 51.5
NbOPO4 119 0.31 71.0 Figure 2. Fragment of NbOPO4.3 H2O structure on ac plane.
the interlamelar distance and thus the volume of this solid12. Concerning the H3PO4/Nb2O5 catalyst, the impregnation of phosphoric acid to Nb2O5 support caused a decrease in its specific area value. This is probably due to the conden-sation of PO43- ions on the surface of the Nb
2O5 support and/or due to the bonding of these ions to niobium with formation of phosphate species, which would be also re-sponsible for the increasing of the pore diameter value.
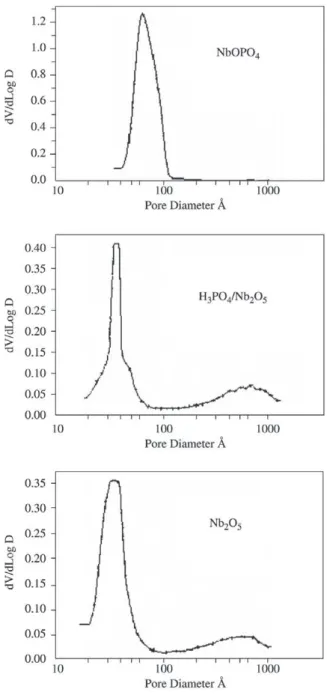
The pore volume distribution curves of the samples are presented in Fig. 3.
As appears from this figure, NbOPO4 catalyst exhibits a monomodal pore distribution, with mesoporosity in the range of 40 Å to 100 Å and having 65 Å as a medium value. Both Nb2O5 and H3PO4/Nb2O5 catalysts presented a bimodal pore distribution in the ranges of 20 Å to 70 Å and 200 Å to 1000 Å, respectively. Comparing the curves of the H3PO4/Nb2O5 sample with that of the corresponding pure support, it is observed a slight narrowing of the peak in the 20 Å to 70 Å region, probably due to a partial blockage of the mesoporous caused by phosphoric acid incorporation to Nb2O5.
3.2. X-ray Diffraction
13-14.
3.3. Ammonia Temperature Programmed Desorption
NH3-TPD profiles are displayed in Fig. 5. From this fig-ure, it is clear that the NbOPO4 catalyst profile is shifted towards higher temperatures as compared to the other sam-ples, indicating that stronger acid sites are present on its surface.
The peak areas values allowed us to obtain the total acidi-ties of the catalysts expressed in mmols of NH3/g of the
catalyst. These informations are reported in Table 2. In or-der to make a semi-quantitative determination, the desorption curves were partitioned into chosen temperature ranges, assuming that the ammonia retained on stronger sites desorbs at higher temperatures as mentioned in the litera-ture15 and these results are also shown in Table 2.
As it can be noted, H3PO4/Nb2O5 catalyst exhibits the highest total acidity followed by Nb2O5 and NbOPO4 cata-lysts. However, NbOPO4 catalyst presented the highest strong acid sites distribution (T > 623 K) and this behavior must be probably caused by the loss of water in its struc-ture, which promotes a strong NH3 adsorption on the sup-port.
3.4. Catalytic Tests
Table 3 presents the average results obtained from cata-Figure 3. Pore size distribution of the different catalysts.
Figure 4. X-ray diffraction patterns of the samples.
lytic conversion reactions at 623 K, where samples 1 and 2 correspond to the aliquots withdrawn after 30 min and 60 min of time on stream, respectively.
From this table, it is possible to assess the descarboxilation activity of the catalysts by comparing the products acidity measurement (Ma): the lower it is, the more efficient is the catalyst in the descarboxilation process. The acidity measurement of the reactant, oleic acid, was also included in Table 3 in order to provide data comparison.
The catalytic activities are compared as a function of the liquid products formation, that is, the ability of convert-ing the oleic acid reactant to hydrocarbon products, usconvert-ing the following expression:
Conversion (%) = ×100
The results from Table 3 suggest the occurrence of a thermal cracking process in the pheating zone of the re-actor for the non-catalyzed reaction which resulted in a small amount of liquid products.
On the basis of experimental data, it is obvious that the presence of a catalytic agent substantially increases the oleic acid conversion. The catalytic activity of the pentoxide nio-bium sample was significantly enhanced by impregnating this support with phosphoric acid. As previously mentioned, the phosphoric acid incorporation to Nb2O5 leads to an in-crease of the total acidity but also to a dein-crease of the
spe-cific area value. Hence, the catalytic promotion effect may be attributed mainly to an increase of the acidic properties of the support.
A maximum of activity was found for NbOPO4 catalyst that exhibits conversions up to 82%. The results of catalytic activity did not follow the same general trend as the TPD results. This is not surprising, since the TPD technique meas-ures all sites capable of adsorbing ammonia and only a frac-tion of these is likely to be active in the acid oleic descarboxilation reaction. Based on these findings, it can be concluded that strong acid sites are required for catalyzing this reaction.
After all tests, it was observed a viscous residual prod-uct formation, mainly with H3PO4/Nb2O5 and NbOPO4 cata-lysts.
3.5. Gas Chromatography
Table 4 presents the weight percentage of products ob-tained from the catalytic oleic acid conversion to hydrocar-bons. The average products distribution was expressed tak-ing into account the different hydrocarbon ranges and it was determined by using a standard chromatogram for compari-son.
For the non-catalyzed reaction, no hydrocarbon product was detected. The presence of the catalyst promoted the formation of compounds in the range of gasoline, diesel oil and lubricant oil for all of the samples. The addition of phos-phoric acid improved the performance of Nb2O5 catalyst. Table 3. Summary results from catalytic tests with oleic acid at 623 K.
Catalyst Sample % LP* Ma** Conversion (%) Residue (wt. %)
None (pure reactant) — — 3.7 — —
None (thermal cracking) 1 84.8 3.7 0 11.4
2 90.8 3.5 5.4
Nb2O5 1 85.2 2.5 32.4 7.4
2 82.2 2.5 32.4
H3PO4/Nb2O5 1 71.9 1.7 54.0 22.2
2 90.2 2.0 45.9
NbOPO4 1 47.7 0.67 81.9 23.2
2 78.5 1.0 73.0
*%LP = weight percentage of liquid products from reactor outlet (liquid products generated + oleic acid not reacted). **Ma = mmol acid/g product.
Table 2. Total acidity and acid strength distribution of the catalysts obtained from NH3-TPD analysis.
Catalysts Total acidity[µmol NH3.gcat-1] Relative acidity distribution [µmol NH3.gcat-1] T < 473 K 473 K < T > 623 K T > 623 K
NbOPO4 143 18 42 83
Nb2O5 529 142 245 142
The best result concerning biodiesel selectivity was obtained with NbOPO4 catalyst. The simultaneous analysis of the oleic acid descarboxilation with the chromatographic re-sults allow us to conclude that the NbOPO4 catalyst is the most efficient for the process, since it showed the highest conversion (73% and 82%) and selectivity values (33% of compounds in the range of diesel oil). This result is prob-ably related to its particular properties: it is a solid with a lamelar phosphate structure with high pore volumes and a monomodal mesopores distribution. Moreover, this solid presents some crystallinity and a higher amount of strong acid sites in comparison to the other samples.
4. Conclusions
The addition of phosphoric acid to niobium pentoxide caused an increase of the total acidity resulting, however, in the partial blockage of the pores. The comparison between the H3PO4/Nb2O5 catalyst and the pure Nb2O5 support sug-gested that phosphoric acid impregnation improved the ef-ficiency in the oleic acid descarboxilation. Nevertheless, NbOPO4 catalyst was the most efficient in this process: it showed the best results in both activity and selectivity for diesel fuel. This is probably related to its strong acid sites and high specific area value. So, both textural and acidic properties play an important role in the catalytic
perform-ance of the conversion of oleic acid to liquid fuels. NbOPO4 seems to be a promising catalyst for oil reform reaction.
References
1. Srivastava, A.; Prasad, R. Renewable and Sustainable Energy Reviews, v. 4, p. 111-133, 2000.
2. Benedito, S.E.; Valverde, L.F.M.; Sousa, R.B. et al.Revista Militar de Ciência e Tecnologia, v. XVII, p. 15-25, 2000.
3. Ma, F.; Hanna, M.A. Bioresource Technology, v. 70, p.
1-15, 1999.
4. Alcantara, R.; Amores, J.; Canoira, L. et al.Biomass and Bioenergy, v. 18, p. 515-527, 2000.
5. Bender, M. Bioresource Technology, v. 70, p. 81-87, 1999.
6. Schuchardf, U.; Sercheli, R.; Vargas, R.M. Journal of Brazilian Chemical Society, v. 9, n. 1, p. 199-210, 1998.
7. Santos, F.R.; Ferreira Netto, J.C.; Costa, S.R. Química Nova, v. 21, n. 5, p. 560-563, 1998.
8. Costa Netto, P.R.; Rossi, F.S.; Zagonel, G.F. et al.Química Nova, v. 23, n. 4, p. 531-537, 2000.
9. Schmal, M.; Aranda, D.A.G.; Alves, P.S. et al.Anais do X Congresso Brasileiro de Catálise, Salvador, BA, v. 1,
p. 105-112, 1999.
10. Picardo, M.C.; Bello, F.O.; Araujo, L.R.R. et al.Livro de Resumos do XLII Congresso Brasileiro de Química, Rio de Janeiro, v. 1, p. 486, 2002.
11. Benedito, E.S.; Valverde, L.F.M.; Sousa, R.B. et al.Anais do X Congresso Brasileiro de Catálise, Salvador, BA,
v. 2, p. 37-43, 1999.
12. Chernonukov, N.R.; Egonov N.P.; Mochalova, I.R. Rus-sian Journal of Inorganic Chemistry, v. 23, p. 1627, 1978.
13. Martins, R.L.; Schitine, W.J.; Castro, F.R. IV Seminário Brasileiro de Catálise, Canela, RS, v. 1, p. 569-579, 1987.
14. Reguera, F.M. tese doutorado, Instituto Militar de Engenharia, RJ, 2002.
15. Silva, C.L.T.; Camorim, V.L.L.; Zotin, J.L. et al., Ca-talysis Today, v. 57, p. 209-217, 2000.
Table 4. Products distribution expressed in hydrocarbon ranges
(weight %).
Catalyst C6-C12 C14-C18 C19-C22 (gasoline range) (diesel range) (lubricant oil)
None 0 0 0
(thermal cracking)
Nb2O5 0.11 4.56 91.29
H3PO4/Nb2O5 1.77 21.32 72.79