*e-mail: [email protected], [email protected]
1. Introduction
For more than 30 years now, surface structure has been identiied as one of six factors particularly important for implant incorporation in bone1. Alterations in endosseous dental implant surface have been revisited extensively to decrease treatment time frames by reducing the healing period for osseointegration establishment2,3. An increasing number of surface modiication techniques have been introduced, and the etching of titanium by acids is one of them.
Acid etching is a subtractive method, wherein pits are created in the titanium surface4. The technique is of particular interest because it creates a microtextured surface (ine rough surface with micro pits of 1-3 μm and larger pits of approximately 6-10 μm) that appears to enhance early endosseous integration and stability of the implant5. The method may have advantages compared with some other methods of roughening such as grit blasting, plasma spraying, and beads. As the process does not stress the adjacent material, there is no risk of laking or delamination, thus leaving particles of grit6-8.
It has been suggested that the surface modiication of titanium by acid etching has a positive effect on endosseous integration. In the study of Lazzara et al.9, the bone response to the Osseotite implant (it has a turned and dual acid-etched surface by HCl/H2SO4) was compared to implants with turned surfaces, both placed in the human posterior maxilla. The bone contact at the acid-etched surface was signiicantly higher after 6 months of healing when compared to the turned surfaces, and the osteoconductive effect, i.e. the amount of
bone apposition, of the acid-etched surface over the turned was particularly pronounced in the softer trabecular bone. In a study conducted in a rabbit tibia model, Klokkevold et al.5 compared the anchorage of acid-etched (by HCl/H2SO4) and turned surfaces and observed a statistically signiicant higher mean removal torque for the acid-etched surface after 1, 2, and 3 months. He et al.10, treating titanium by HF/HNO
3, and Zareidoost et al.11, treating titanium by HCl, HF, and H3PO4, showed that acid-etched titanium surfaces had lower cytotoxicity level, better biocompatibility, and higher roughness than the control samples not submitted to etching. On the other hand, etching does not always increase the surface roughness, as described by Albrektsson & Wennerberg12. Etched commercial available implants may have a roughness comparable to turned Brånemark implants, i.e. a Sa value of approximately 0.5 µm but with a change from an anisotropic to an isotropic surface due to the removal of cut marks from the machining technique by the etching procedure.
It is possible to control and vary selected surface properties of titanium over a relatively wide range using different surface preparation methods. Understanding how these methods inluence the surface properties is important, as these may increase the biological response to dental implants, and consequently inluence its success rates. As the surface chemistry and topography obtained by acid etching can be modulated according to variations in the treatment, the aim of the present study was to evaluate the inluence of temperature and etching time of an acid solution of HCl/H2SO4 on the chemical and topographical supericial characteristics of cpTi grade IV.
Inluence of Temperature and Acid Etching Time on the Supericial Characteristics of Ti
Bruno Ramos Chrcanovica*, Ann Wennerberga, Maximiliano Delany Martinsb
aDepartment of Prosthodontics, Faculty of Odontology, Malmö University, Carl Gustafs väg 34,
SE-205 06, Malmö, Sweden
bLaboratório de Nanoscopia – LabNano, Centro de Desenvolvimento da Tecnologia Nuclear – CDTN,
Comissão Nacional de Energia Nuclear – CNEN, Av. Presidente Antônio Carlos, 6627, Campus da UFMG, Pampulha, CEP 31270-901, Belo Horizonte, MG, Brazil
Received: May 4, 2015; Revised: July 28, 2015
We evaluated the inluence of the etching time and temperature of an acid solution (HCl/H2SO4) on the chemical and topographical supericial characteristics of cpTi grade IV. Samples were analyzed by electron microscopy, interferometry, and grazing incidence XRD. The surfaces kept the irregularity aspect when submitted to the same etching temperature. On the other hand, the irregularities increased in size and depth with increasing etching time. The etching treatments that produced higher values for roughness parameters showed a combination of high temperature for a longer etching time. Some treatments produced very large irregularities, with a brittle surface in some regions. According to statistical correlation, the temperature made the strongest contribution in the variance of the mean values of the surface roughness parameters when compared to the etching time. Titanium and oxygen were the only elements on the surface in all groups. All test group samples showed the presence of titanium hydride.
2.1. Materials
Thirty machined cpTi grade IV discs (12.7 × 2.0 mm) were used as the substrate material for the experiment. All discs were cut from a rod using a IsoMet Low Speed Saw (Buehler, Lake Bluff, USA) with a Diamond Wafering Blade No. 11-4244 (diameter 4”-102mm / thickness 0.012”-0.3mm) from the same manufacturer. The samples were mounted in polymethyl methacrylate resin, in order to be polished in a polishing machine until a #2000 silicon carbide paper.
The discs were separated into a control group and 9 test groups. Each group had 3 discs. Each test group was acid-etched with a solution of HCl/H2SO4 and classiied into different groups depending on the temperature and etching time, as follows: AT1 (60 °C, 5 min), AT2 (60 °C, 15 min), AT3 (60 °C, 30 min), AT4 (90 °C, 5 min), AT5 (90 °C, 15 min), AT6 (90 °C, 30 min), AT7 (120 °C, 5 min), AT8 (120 °C, 15 min), and AT9 (120 °C, 30 min).
2.2. Characterization
The surface morphology of the samples was examined by scanning electron microscopy (SEM - JEOL, model JSM-5310, Tokyo, Japan). The secondary electron (SE) detection mode with an acceleration voltage of 25 kV was selected for SEM analysis and the vacuum pressure was maintained below 1×10⁻⁵ Torr. The load current (LC) was approximately 85 μA. For a direct comparison of the surface morphology, the same magniication of 1000x was selected for all samples.
In order to obtain quantitative analysis of the surface roughness, the samples were examined by interferometry using a MicroXAM instrument (ADE Phase shift Technology, Inc., Tuczon, USA). The analysis was performed at ten random sites of the samples surface, with a scanning area of 200 µm × 260 µm. Surfascan software version 4.2.4.1 (Hommel-Etamic GmbH, Villingen-Schwenningen, Germany) was used to calculate the topographical parameters. Three distinct roughness parameters were reported for each surface, according to a suggested guideline13: S
a (µm) = average height deviation from a mean plane, Sds (µm-2) = density of summits and Sdr (%) = developed surface ratio.
The parameters are deined14 as follows:
(a) Sa (arithmetic mean deviation of the surface). It is a parameter for characterizing the amplitude property of surfaces. It is a dispersion parameter deined as the arithmetic mean of the absolute values of the surface departures above and below the mean plane within the sampling area. It is given by the formula
N M ij a
j 1 i 1 1
z z MN
S
= =
=− ∑ ∑ (1)
(b) Sds (density of summits of the surface). It is a parameter for characterizing the spatial property of surfaces. This is the number of summits of a unit sampling area. It is given by the formula
(
)(
)
. .ds
Number of summits
M 1 N 1 x y
S = − − ∆ ∆ (2)
property is a combination of amplitude and spacing. Any changes which occur in either amplitude or spacing may have an effect on the hybrid property. This is the ratio of the increment of the interfacial area of a surface over the sampling area. A large value of the parameter indicates the signiicance of either the amplitude or the spacing or both. It is given by the formula
(
)(
)
(
)(
)
. .
. %
. .
N 1 M 1 ij j 1 i 1 dr
M 1 N 1 x y 100 M 1 N 1 x y
A S − − = = − − − ∆ ∆ = − − ∆ ∆
∑ ∑ (3)
Before the parametrical calculation could be evaluated, the waviness from the surface was removed using a 50 × 50 µm Gaussian ilter. A statistical analysis of the values of the surface roughness parameters and their relation with the temperature and etching time were composed and compared with One-Way Analysis of Variance (ANOVA) or Kruskal Wallis test, where indicated, depending on the normality (Kolmogorov–Smirnov test). When ANOVA was indicated, the Tukey’s HSD test was also performed, in order to ind means that are signiicantly different from each other. Pearson correlation and linear regression were also performed in order to verify the relationship between the surface roughness parameters and the temperature, and between the surface roughness parameters and the etching time. Standard multiple regression was performed in order to verify the relationship between the surface roughness parameters and the two predictors at the same time. The degree of statistical signiicance was considered
P < 0.05. The Statistical Package for the Social Sciences (SPSS) software version 20 (SPSS Inc., Chicago, USA) was used to perform the statistical analysis.
The surface chemical composition was analyzed by energy dispersive x-ray spectroscopy (EDS - JEOL, model JXA-8900RJ, Tokyo, Japan). The most central region of the samples was chosen, and the analysis was made with a magniication of 200x. The elemental chemical composition was calculated by the mean value and standard deviation from the 3 samples of each group.
Moreover, grazing incidence X-ray diffraction (GIXRD) measurements were carried out in a Ultima IV X-ray diffractometer (Rigaku, Tokyo, Japan), using Cu-Kα1 radiation at 30 kV and tube current of 20 mA, without any ilter or monochromator, in the angle range of 10º-90º (2θ) with a grazing incidence of 3º, making the diffraction sensitive to the surface. The step of measurement was set to 0.05º with a scan rate of 0.5º per minute. The divergence slit was set to 1 mm, with a Div H.L. Slit of 2 mm. The results were analyzed in Search-Match software (Crystallographica, Oxford, United Kingdom). GIXRD experiments were carried out in order to distinguish chemical compounds at the sample surface.
3. Results
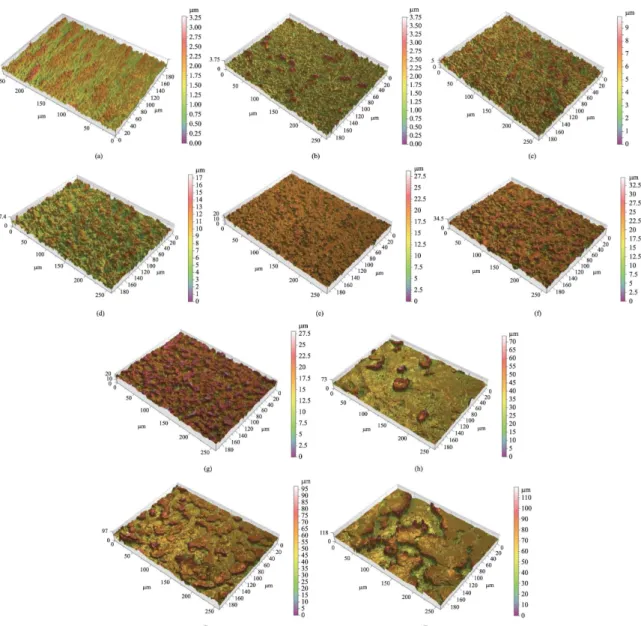
3.1. SEM analysis
surfaces were obvious between the groups due to differences of the etching processes. The control group samples were mainly characterized by multidirectional grooves as result of the polishing process (Figure 1a). Samples submitted to acid treatment under 60 °C (AT1, AT2, AT3; Figures 1b, 1c, 1d, respectively) showed a homogenous distribution of linear irregularities with grooves and sharp edges throughout the surface. The irregularities increased in size with the increasing etching time. The sample group AT1 showed some small unetched regions, probably due to the short period of etching (5 minutes, Figure 1b). The groups that were etched under 90 °C (AT4, AT5, AT6; Figures 1e, 1f, 1g, respectively) showed several micro-pits on the surface, increasing in size and in depth with the increase of the etching time. Finally,
from the groups that were etched under 120 °C, the group AT7 (Figure 1h) showed a surface with some deep valleys and some areas of relatively plain surface, while AT8 (Figure 1i) and AT9 (Figure 1j) demonstrated more irregular surfaces, with larger and deeper valleys and peaks with micro-pits throughout the surface. When seen by the naked eye, the samples from the groups AT8 (120 °C 15 min) and AT9 (120 °C 30 min) produced very large irregularities with a brittle surface that peeled out in some regions when scratched.
3.2. Interferometry analysis
The qualitative and quantitative surface topography demonstrated different degrees of roughness. The topographic maps obtained by interferometry showed, qualitatively, the
respectively).
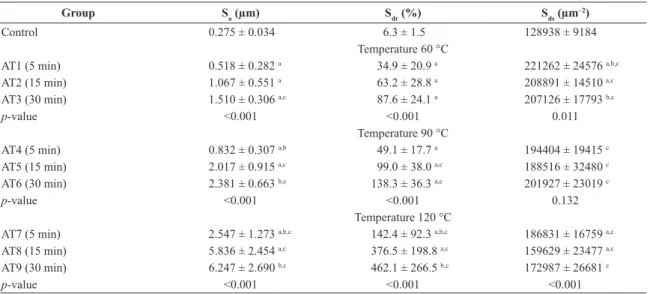
Table 1 shows the mean values of three-dimensional roughness parameters for the sample groups separated by groups of same temperature, as determined by interferometry. It can be observed that the surfaces of the samples from control group showed smaller mean values of the roughness parameters than the test groups. Comparison of the mean values of the surface roughness parameters with ANOVA showed that the difference of the values between the groups revealed to be statistically signiicant for all parameters, except for Sds from the samples treated at the temperature of 90 °C. The mean values of Sa and Sdr tended to increase with the increase of etching time and temperature, while
When Pearson correlation and linear regression were performed to verify the relationship between the surface roughness parameters and the temperature (Table 2), it was observed that 43.2% of the variance in Sa is being explained by the temperature. Presenting p = 0.000 for both coeficients,
shows that the model its very well the data. The numbers for Sdr and Sds were 34.6% and 31.3%, respectively, with their both coeficients also presenting p = 0.000. According with the statistical models, for every 1 oC increase in the temperature, there is an increase of 0.064 µm in Sa, an increase of 4.4% in Sdr, and a decrease of 654 µm–2 in S
ds. When Pearson correlation and linear regression were performed to verify the relationship between the surface roughness parameters and the etching time (Table 3), it
was observed that 11.5% of the variance in Sa is being explained by the etching time. Presenting p = 0.000 for both coeficients, shows that the model its very well the data. The numbers for Sdr and Sds were 10.9% and 0.06%, respectively, with their coeficients presenting p = 0.002 for the coeficient ‘a’ and p = 0.000 for the coeficient ‘b’,
and p = 0.000 for the coeficient ‘a’ and p = 0.223 for the coeficient ‘b’, respectively. In this case, the ‘b’ coeficient is not making a statistically signiicant unique contribution to the outcome at the statistical model for Sds, because of the lack of signiicance of it. According to the statistical models, for every 1 minute increase in the etching time, there is an increase of 0.079 µm in Sa, an increase of 5.9% in Sdr, and a decrease of 207 µm–2 in S
ds.
An explanation is required in order to better understand the meaning of the coeficients. The linear regression analysis provides coeficients for the predictor variables, the regression coeficients. The linear regression is an approach for modeling the relationship between a scalar dependent variable ‘y’ and one or more explanatory variables (or independent variable) denoted ‘x’. When there is only one explanatory variable (in this case, the etching time), only a irst degree equation (y = a + bx) is possible. The ‘b’ coeficient in this case
suggests how much the value of the roughness parameters will increase for every 1 minute increase in the etching time. As the ‘b’ coeficient for the Sds model was not statistically signiicant, it can be said that there is no signiicant effect of the etching time on the variance of the value of Sds.
From the results presented at the Tables 3 and 4, it can be observed that the temperature has a stronger inluence on the outcome (variation in the value of the roughness parameters) than the etching time.
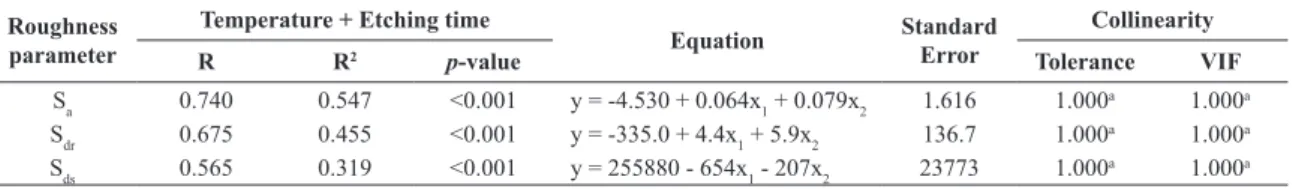
The results for the standard multiple regression are summarized in Table 4. As the standardized coeficient for the irst independent variable (0.657, 0.588, -0.560, for Sa, Sdr, and Sds, respectively) was larger than standardized coeficient for the second independent variable (0.339, 0.331, -0.074, for Sa, Sdr, and Sds, respectively) for all parameters, the temperature makes the strongest contribution in explaining the outcome than the etching time. According to the model, 54.7% of the variance in the Sa value is explained by the model, while 45.3% is explained by other factors. The values are 45.5% and 54.5%, and 31.9% and 68.1%, for Sdr and Sds, respectively. The three models have a p = 0.000, meaning that they are very good predictor of the outcome. Concerning all the coeficients of all three models, only the coeficient for
Table 1. Mean values (± SD) of the three-dimensional roughness parameters of the samples separated by groups of same temperature, as determined by interferometry (scanning area of 200 μm x 260 μm), and p-values for one-way ANOVA comparisons.
Group Sa (µm) Sdr (%) Sds (µm
–2)
Control 0.275 ± 0.034 6.3 ± 1.5 128938 ± 9184
Temperature 60 °C
AT1 (5 min) 0.518 ± 0.282 a 34.9 ± 20.9 a 221262 ± 24576 a,b,c
AT2 (15 min) 1.067 ± 0.551 a 63.2 ± 28.8 a 208891 ± 14510 a,c
AT3 (30 min) 1.510 ± 0.306 a,c 87.6 ± 24.1 a 207126 ± 17793 b,c
p-value <0.001 <0.001 0.011
Temperature 90 °C
AT4 (5 min) 0.832 ± 0.307 a,b 49.1 ± 17.7 a 194404 ± 19415 c
AT5 (15 min) 2.017 ± 0.915 a,c 99.0 ± 38.0 a,c 188516 ± 32480 c
AT6 (30 min) 2.381 ± 0.663 b,c 138.3 ± 36.3 a,c 201927 ± 23019 c
p-value <0.001 <0.001 0.132
Temperature 120 °C
AT7 (5 min) 2.547 ± 1.273 a,b,c 142.4 ± 92.3 a,b,c 186831 ± 16759 a,c
AT8 (15 min) 5.836 ± 2.454 a,c 376.5 ± 198.8 a,c 159629 ± 23477 a,c
AT9 (30 min) 6.247 ± 2.690 b,c 462.1 ± 266.5 b,c 172987 ± 26681 c
p-value <0.001 <0.001 <0.001
a,bGroups denoted with the same superscripted letter indicate statistically signiicant difference in surface roughness (P < 0.05) between the groups of the same temperature (60, 90, and 120 °C), according to the Tukey’s HSD test. cIndicates statistically signiicant difference when compared to the control group. Observation: In the case of difference between the groups of the same etching time (5, 15, and 30 minutes), the following groups denoted with the same superscripted letter (a, b) indicate statistically signiicant difference in surface roughness (P < 0.05), according to the Tukey’s HSD test: 5 minutes: Sa (AT1a, AT4b, AT7a,b), Sdr (AT1a, AT4b, AT7a,b), Sds (AT1a,b, AT4a, AT7b); 15 minutes: Sa (AT2a, AT5a, AT8a), Sdr (AT2a, AT5b, AT8a,b), Sds (AT2a, AT5a, AT8a); 30 minutes: Sa (AT3a, AT6b, AT9a,b), Sdr (AT3a, AT6b, AT9a,b), Sds (AT3a, AT6b, AT9a,b).
Table 2. Pearson correlation and linear regression results of the relationship between the surface roughness parameters and the temperature.
Roughness parameter
Temperature Correlation
(Pearson) Equation Standard Error
R R2
p-value
Sa 0.657 0.432 <0.001 Strong y = –3.217 + 0.064x 1.806
Sdr 0.588 0.346 <0.001 Moderate y = –236.2 + 4.4x 149.5
etching time at the Sds model was not statistically signiicant (p = 0.142), meaning that this one is not making a statistically signiicant unique contribution to the outcome.
The collinearity diagnosis related to the ‘b’ coeficients showed that the values of tolerance and variance inlation factor (VIF) do not suggest multicollinearity in any of the
three models (for Sa, Sdr, and Sds). Thus, the independent variables (temperature and etching time) are not highly correlated to each other in this particular data set, so then there is no imprecise estimate of the effect of independent changes in the independent variables (x1 and x2, respectively).
3.3. EDS analysis
EDS analysis of the surfaces showed titanium and oxygen to be the only elements in all groups, with an average % atomic concentration of 60% and 40%, respectively. Figure 3 shows a typical EDS spectrum of the test groups.
3.4. XRD analysis
Figure 4 presents a typical GIXRD diffractogram for a sample from the control group, where diffraction peaks were labeled according to Miller indices, as described elsewhere15. The diffractogram analysis conirmed the presence of titanium (Ti) only. The GIXRD results obtained for the samples from groups submitted to acid etching showed the presence of Ti and titanium hydride (TiH2) in all test groups (Figure 5).
parameter R R2 (Pearson) Equation Standard Error
p-value
Sa 0.339 0.115 <0.001 Weak y = 1.238 + 0.079x 2.255
Sdr 0.331 0.109 <0.001 Weak y = 62.6 + 5.9x 174.4
Sds –0.074 0.006 0.223 Very Weak y = 196964 - 207x 28672
Table 4. Standard multiple regression results of the relationship between the surface roughness parameters and the two predictors.
Roughness parameter
Temperature + Etching time
Equation Standard Error Collinearity
R R2
p-value Tolerance VIF
Sa 0.740 0.547 <0.001 y = -4.530 + 0.064x1 + 0.079x2 1.616 1.000a 1.000a
Sdr 0.675 0.455 <0.001 y = -335.0 + 4.4x1 + 5.9x2 136.7 1.000
a 1.000a
Sds 0.565 0.319 <0.001 y = 255880 - 654x1 - 207x2 23773 1.000
a 1.000a
VIF - variance inlation factor. a The same value for both ‘b’ coeficients.
Figure 3. Typical EDS spectrum of a sample from group AT2,
showing oxygen (O) and titanium (Ti) peaks.
Figure 4. Typical GIXRD diffractogram for the control group sample, showing peak identiication (Miller indices). See text for details.
Figure 5. A typical GIXRD diffractogram of the acid-etched
samples. Peak identiication according to crystal structures: Ti
4. Discussion
The present study evaluated the inluence of temperature and etching time of an acid solution of HCl/H2SO4 on the chemical and topographical supericial characteristics of cpTi grade IV. Due to the distinct treatment parameters, every surface displayed distinct surface roughness characteristics. As the etching temperature was raised, surface irregularities became deeper, and the mean Sa and Sdr increased. Some studies have demonstrated that increases in the numerical surface roughness of an implant enhance biomechanical anchorage in bone, as determined by torque removal tests16 and resistance to push-out forces17. These studies showed a tendency toward an increase in bone contact, and resistance to removal, with an increasing numerical implant surface roughness. Speciic to dental implants, studies have shown that histologic and biomechanical characteristics were improved due to increase in the as-machined surface texture by varied methods resulting in average implant surface roughness (Sa) ranging from 0.5 to 2 μm18,19. Albrektsson & Wennerberg18 suggested that smooth surfaces have an Sa value of <0.5 μm, minimally rough surfaces 0.5-1.0 μm, moderately rough surfaces 1.0-2.0 μm, and rough surfaces >2.0 μm. Thus, the values found in the present study for the roughness parameter Sa seems to be too high when a temperature of 120 °C is applied, at least for the etching times of 15 and 30 minutes. As for the temperatures of 60 and 90 °C, it seems that a minimum of 15 minutes is required in order to obtain a surface that is classiied as moderately rough. The results of the correlation and regression analyses showed that the temperature makes the strongest contribution in the variance of the mean values of the surface roughness parameters when compared to the etching time.
Although a good correlation between increased Ra (bi-dimensional correlate of the three-dimensional Sa) and stronger anchorage5,17,20 was observed in the literature, one cannot speculate on their biological performance until their bone interlocking capacity is demonstrated. It turns out that clinical implications cannot be drawn by relying on roughness-descriptive parameters alone4. Moreover, S
a (Ra) is insuficient by its own to characterize a given surface.
The increase in temperature changed the irregularity pattern from linear grooves with sharp edges to micro-pits and finally to deeper valleys, removing the grooves produced by the polishing process. The acid etching can create a surface with homogeneously distributed grooves and sharp edges at the micron-scale (at a temperature about 60 °C), randomly create pits throughout the surface (at a temperature about 90 °C), or deep valleys and high ridges (at a temperature about 120 °C), enlarging the surface area. The surfaces kept the irregularity aspect when submitted to the same etching temperature. On the other hand, the irregularities increased in size and depth with increasing etching time. The problem with the 120 °C samples with 15 and 30 minutes of etching time is that the etching process produced very large irregularities when the samples were seen by the naked eye, with a brittle surface in some regions, which peeled out when scratched.
Concerning the chemical evaluation, the EDS analysis of the surfaces showed oxygen and titanium to be the only
elements in all groups. This is most probably due to the natural formation of a titanium oxide passivation layer just after sample surface preparation, mainly TiO2. The result agrees with the mass percentage of the TiO2 (about 60%/40%), which is the main component of a typical titanium oxide passivation layer.
Although the EDS analysis was able to detect the presence of TiO2, the same did not happen with the GIXRD analysis, probably due to the TiO2 ultrathin thickness, as it may happen in the case of the TiO2 itself21 or for other compounds/phases22. However, GIXRD analysis demonstrated the presence of TiH2 on the surface of all samples submitted to acid etching. It was shown by XRD and metallographic microscopy analyses that the etching process modiies the Ti surface composition of sandblasted and acid-etched-treated implants indicating the presence of 20 to 40% of titanium hydride (TiHx, x ≤ 2) in addition to Ti23. It was suggested that titanium hydride may be biologically important because a hydride layer is much better suited as a template for binding biomolecules chemically onto a titanium surface24. In process of TiH2 formation, irst the acids must dissolve the protective titanium oxide layer before attacking the metallic titanium. Then native hydrogen ions (H+) of the acid solution are released in the corrosion process of titanium. As the metal is left without its dense protective oxide layer, the small ions of hydrogen diffuse rapidly into the metal. The sub-surface is therefore enriched with hydrogen25, and when saturation in hydrogen is reached, titanium hydride is formed.
Although some of the surfaces here created using speciic acid etching methods resemble chemically and topographically surfaces with osseointegration potential described in the literature, further research is necessary to clear up the inluence of acid etching methods on the biological response. Moreover, since the present study has used discs as the substrate material, the observed results cannot be directly extrapolated to complex surfaces like those in cylindrical threaded titanium implants.
5. Conclusions
Titanium surface showed great variability when submitted to acid etching depending on the temperature and etching time. The surfaces kept the irregularity aspect when submitted to the same etching temperature. On the other hand, the irregularities increased in size and depth with increasing etching time. The mean value of Sa increased with temperature and time. The temperature made the strongest contribution in the variance of the mean values of the surface roughness parameters when compared to the etching time. EDS analysis of the surfaces showed titanium and oxygen to be the only elements in all groups, and all test group samples showed the presence of titanium hydride on the surface, as observed by GIXRD analysis.
Acknowledgements
Osseointegrated titanium implants. Requirements for ensuring
a long-lasting, direct bone-to-implant anchorage in man. Acta
Orthopaedica Scandinavica. 1981; 52(2):155-170. http://dx.doi. org/10.3109/17453678108991776. PMid:7246093.
2. Wennerberg A and Albrektsson T. Effects of titanium surface
topography on bone integration: a systematic review. Clinical
Oral Implants Research. 2009; 20(Suppl 4):172-184. http:// dx.doi.org/10.1111/j.1600-0501.2009.01775.x. PMid:19663964.
3. Wennerberg A and Albrektsson T. Structural influence from calcium phosphate coatings and its possible effect on enhanced
bone integration. Acta Odontologica Scandinavica. 2009;
67(6):333-340. http://dx.doi.org/10.1080/00016350903188325. PMid:19722110.
4. Szmukler-Moncler S, Testori T and Bernard JP. Etched implants:
a comparative surface analysis of four implant systems. Journal
of Biomedical Materials Research. Part B, Applied Biomaterials. 2004; 69(1):46-57. http://dx.doi.org/10.1002/jbm.b.20021. PMid:15015209.
5. Klokkevold PR, Johnson P, Dadgostari S, Davies JE, Caputo A and Nishimura RD. Early endosseous integration enhanced by dual acid etching of titanium: a torque removal study in the
rabbit. Clinical Oral Implants Research. 2001; 12(4):350-357.
http://dx.doi.org/10.1034/j.1600-0501.2001.012004350.x. PMid:11488864.
6. Daugaard H, Elmengaard B, Bechtold JE and Soballe K. Bone growth enhancement in vivo on press-fit titanium alloy
implants with acid etched microtexture. Journal of Biomedical
Materials Research. Part A. 2008; 87(2):434-440. http://dx.doi. org/10.1002/jbm.a.31748. PMid:18186059.
7. Chrcanovic BR, Leão NLC and Martins MD. Influence of different acid etchings on the superficial characteristics of Ti
sandblasted with Al2O3. Materials Research. 2013;
16(5):1006-1014. http://dx.doi.org/10.1590/S1516-14392013005000067.
8. Chrcanovic BR and Martins MD. Study of the influence of acid etching treatments on the superficial characteristics of Ti. Materials Research. 2014; 17(2):373-380. http://dx.doi. org/10.1590/S1516-14392014005000042.
9. Lazzara RJ, Testori T, Trisi P, Porter SS and Weinstein RL. A human histologic analysis of osseotite and machined surfaces
using implants with 2 opposing surfaces. The International
Journal of Periodontics & Restorative Dentistry. 1999; 19(2):117-129. PMid:10635177.
10. He FM, Yang GL, Zhao SF and Cheng ZP. Mechanical and histomorphometric evaluations of rough titanium implants treated with hydrofluoric acid/nitric acid solution in rabbit tibia.
The International Journal of Oral & Maxillofacial Implants. 2011; 26(1):115-122. PMid:21365046.
11. Zareidoost A, Yousefpour M, Ghaseme B and Amanzadeh A. The relationship of surface roughness and cell response of
chemical surface modification of titanium. Journal of Materials
Science. Materials in Medicine. 2012; 23(6):1479-1488. http:// dx.doi.org/10.1007/s10856-012-4611-9. PMid:22460230. 12. Albrektsson T and Wennerberg A. Oral implant surfaces: Part
2--review focusing on clinical knowledge of different surfaces.
The International Journal of Prosthodontics. 2004; 17(5):544-564. PMid:15543911.
13. Wennerberg A and Albrektsson T. Suggested guidelines for the
topographic evaluation of implant surfaces. The International
14. Stout KJ, editor. Development of the methods for the characterisation of roughness in three dimensions. Luxembourg: Penton Press; 1993.
15. Chrcanovic BR, Pedrosa AR and Martins MD. Chemical and topographic analysis of treated surfaces of five different commercial
dental titanium implants. Materials Research. 2012;
15(3):372-382. http://dx.doi.org/10.1590/S1516-14392012005000035. 16. Souza FA, Queiroz TP, Guastaldi AC, Garcia-Júnior IR,
Magro-Filho O, Nishioka RS, et al. Comparative in vivo study of commercially pure Ti implants with surfaces modified by laser with and without silicate deposition: biomechanical and scanning
electron microscopy analysis. Journal of Biomedical Materials
Research. Part B, Applied Biomaterials. 2013; 101(1):76-84. http://dx.doi.org/10.1002/jbm.b.32818. PMid:23090936.
17. Wong M, Eulenberger J, Schenk R and Hunziker E. Effect of surface topology on the osseointegration of implant materials in
trabecular bone. Journal of Biomedical Materials Research. 1995;
29(12):1567-1575. http://dx.doi.org/10.1002/jbm.820291213. PMid:8600147.
18. Albrektsson T and Wennerberg A. Oral implant surfaces. Part 1: review focusing on topographic and chemical properties
of different surfaces and in vivo responses to them. The
International Journal of Prosthodontics. 2004; 17(5):536-543. PMid:15543910.
19. Buser D, Broggini N, Wieland M, Schenk RK, Denzer AJ, Cochran DL, et al. Enhanced bone apposition to a chemically
modified SLA titanium surface. Journal of Dental Research. 2004;
83(7):529-533. http://dx.doi.org/10.1177/154405910408300704. PMid:15218041.
20. Gotfredsen K, Berglundh T and Lindhe J. Anchorage of titanium implants with different surface characteristics: an experimental
study in rabbits. Clinical Implant Dentistry and Related Research.
2000; 2(3):120-128. http://dx.doi.org/10.1111/j.1708-8208.2000. tb00002.x. PMid:11359256.
21. Han GS, Chung HS, Kim BJ, Kim DH, Lee JW, Swain BS, et al. Retarding charge recombination in perovskite solar cells using
ultrathin MgO-coated TiO2 nanoparticulate films. Journal of
Materials Chemistry. A, Materials for Energy and Sustainability. 2015; 3(17):9160-9164. http://dx.doi.org/10.1039/C4TA03684K. 22. Teng-amnuay N, Tangpatjaroen C, Nisaratanaporn E and
Lohwongwatana B. Replication of trabecular bone structure and reaction layer analysis of titanium alloys using investment casting technique. Procedia Technology. 2014; 12:316-322. http://dx.doi.org/10.1016/j.protcy.2013.12.492.
23. Perrin D, Szmukler-Moncler S, Echikou C, Pointaire P and Bernard JP. Bone response to alteration of surface topography and surface composition of sandblasted and acid etched (SLA)
implants. Clinical Oral Implants Research. 2002;
13(5):465-469. http://dx.doi.org/10.1034/j.1600-0501.2002.130504.x. PMid:12453122.
24. Videm K, Lamolle S, Monjo M, Ellingsen JE, Lyngstadaas SP and Haugen HJ. Hydride formation on titanium surfaces by cathodic
polarization. Applied Surface Science. 2008; 255(5):3011-3015.
http://dx.doi.org/10.1016/j.apsusc.2008.08.090.
25. Frank MJ, Walter MS, Lyngstadaas SP, Wintermantel E and Haugen HJ. Hydrogen content in titanium and a titanium-zirconium alloy
after acid etching. Materials Science and Engineering C. 2013;