ESTIMATION OF LEAF AREA FOR GREENHOUSE
CUCUMBER BY LINEAR MEASUREMENTS
UNDER SALINITY AND GRAFTING
Flávio Favaro Blanco1*; Marcos Vinícius Folegatti2
1
Embrapa Meio Norte Núcleo de Pesquisa dos Cerrados, Rod. BR 135, km 3 64900000 Bom Jesus, PI Brasil.
2
USP/ESALQ - Depto. de Engenharia Rural, C.P. 9 - 13418-900 - Piracicaba, SP - Brasil. *Corresponding author <[email protected]>
ABSTRACT: The measurement of leaf area by linear parameters is a useful tool when plants cannot be destroyed for direct measurement. The objectives of this study were to establish equations to estimate the leaf area of greenhouse-cucumber and to evaluate the effects of salinity and grafting on this estimative. Non-grafted cucumber seedlings, cv. ‘Hokushin’, were transplanted in a greenhouse and were irrigated with water of different salinities (1.0, 3.2 and 5.0 dS m-1). In the second growing period, the same cultivar was grafted on Cucurbita spp. and the plants were irrigated with water of 1.4, 3.0 and 5.3 dS m-1. Leaves of different sizes were collected from both experiments and leaf area was determined by an integrating area meter. Leaf length (L) and width (W) were also recorded. An equation for estimating the leaf area from L and W was developed for a given salinity level or grafting condition and estimated well the area of leaves collected in the other treatments. The leaf area (LA) of cucumber ‘Hokushin’ could be estimated using the equation LA = 0.88LW – 4.27, for any grafting and salinity conditions.
Key words: Cucumis sativus L., regression, irrigation water salinity
ESTIMATIVA DA ÁREA FOLIAR DO PEPINO EM AMBIENTE
PROTEGIDO POR MEDIDAS LINEARES SOB
SALINIDADE E ENXERTIA
RESUMO: A determinação da área foliar por medidas lineares é uma ferramenta útil quando as plantas não podem ser destruídas para que a medição direta seja realizada. Os objetivos desse trabalho foram definir equações para a estimativa da área foliar do pepino em ambiente protegido e avaliar os efeitos da salinidade e da a enxertia nessa estimativa. Mudas de pepino, cv. ‘Hokushin’, não enxertadas, foram transplantadas em um ambiente protegido e irrigadas com água de diferentes salinidades (1,0, 3,2 e 5,0 dS m-1). No segundo período de cultivo, a mesma cultivar foi enxertada sobre Cucurbita spp., sendo as plantas irrigadas com água de 1,4, 3,0 e 5,3 dS m-1
. Foram coletadas folhas de diferentes tamanhos dos dois cultivos e dos três tratamentos e a área foliar foi determinada por um medidor de área foliar. O comprimento (C) e a largura (L) da folha também foram registrados. Desenvolveram-se equações pelas quais a área foliar pôde ser estimada a partir de medidas de C e L. A equação desenvolvida para um dado nível de salinidade ou condição de enxertia estimou bem a área das folhas coletadas nos demais tratamentos. A área foliar (AF) do pepino ‘Hokushin’ pode ser estimada pela função AF = 0,88CL – 4,27, para qualquer condição de enxertia e salinidade.
Palavras-chave: Cucumis sativus L., regressão, salinidade da água
INTRODUCTION
Leaf area is an important variable for most physi-ological and agronomic studies involving plant growth, light interception, photosynthetic efficiency, evapotrans-piration and response to fertilizers and irrigation. Veg-etable crops are very sensitive to the environmental con-ditions, such as soil salinity, which generally affects leaf area as well as plant yield and growth (Chartzoulakis, 1994; Folegatti & Blanco, 2000; Blanco et al., 2002).
Determination of leaf area (LA) is generally made by direct methods, leaves being collected and measured
al., 2001), strawberry (Strik & Proctor, 1985) and pump-kin (Silva et al., 1998).
Environmental conditions seem to change leaf geometry of plants of the Cucurbitaceae family. Robbins & Pharr (1987) verified that the leaves of cucumber grown in hydroponic sand culture were larger in total area and had different geometry in relation to plants grown in soil, thus changing the relation between L and W. Silva et al. (1998) reported that the equation developed for es-timating LA for pumpkin growing in field conditions did not estimated well the LA for greenhouse-grown plants.
The objective of this study was to develop regres-sion models that would accurately predict cucumber leaf area using linear measurements of L and W and to evalu-ate the effects of grafting and different levels of irriga-tion water salinity on this estimative.
MATERIAL AND METHODS
Data used in the present work were obtained from two experiments carried out in Piracicaba, SP (22º43’S, 47º38’W) to verify the response of grafted and non-grafted cucumbers to salinity.
Experiment 1: Non-grafted cucumber
A greenhouse of 1.6 m height, 10 m width, 20 m length was used, covered with a polyethylene film with 0.15 mm of thickness was used, with lateral curtains that were closed at night and opened during the day, contain-ing three beds divided into nine plots of 1.85 m length and 1 m width, insulated by a plastic film buried down to 0.8 m to avoid salt exchange between two adjacent plots.
Cucumber seedlings, cv. ‘Hokushin’, were trans-planted on January 13, 1999, on beds with two rows, giv-ing a plant density of 2.5 plants m-2. Plants were trained with a single stem along and around a vertical plastic string. Water was applied by a drip irrigation system, with one dripper per plant, and N, P, K, Ca, Mg and S were applied with the irrigation water of all irrigations, follow-ing the nutrient uptake rate of cucumber in greenhouse.
Three water salinity levels were used: 1.0 dS m-1 (S1); 3.2 dS m-1 (S2) and 5.0 dS m-1 (S3). Treatment S1 received only fertilizers, while S2 and S3, salts in or-der to reach the desired salinity level. The salts were cal-cium chloride, magnesium sulphate and sodium chloride, which were mixed in order to obtain a nutrient solution for S2 and S3 with (Na+K):Ca:Mg ratio of 5:3:2. Irriga-tion was controlled through tensiometers and pan evapo-ration measurements. Tensiometers were installed in each plot at 0.15 and 0.30 m depth, placed 0.10 m from the plant and the dripper, and readings were made daily in the morning. Water was applied whenever the mean soil matric potential was bellow –30 kPa and the irrigation water depth was calculated based on pan evaporation.
Ir-rigation started at 14 days after transplanting (DAT) be-cause no tensiometer response was observed before, and it had an average frequency of 2 days and a volume of 0.850 L plant-1 day-1.
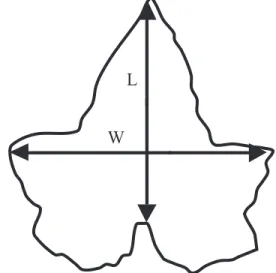
At 40 days after transplanting (DAT), 24 leaves of each treatment were collected; L and W of each leaf were measured with a simple ruler and leaf area (LA) was measured in a LI-COR 3000 leaf area meter. L was mea-sured from the lamina tip to the point of intersection of the lamina and petiole and W was measured from tip to tip between the widest lamina lobes (Figure 1).
Experiment 2: Grafted cucumber
In the second experiment, cucumber, cv. ‘Hokushin’, seedlings were grafted on squash (Cucurbita
spp.), hybrid ‘Excite-Ikki’, and cultivated in another greenhouse 6.3 m wide, 17.5 m long and 2.8 m height, with polyethylene cover with 0.15 m of thickness. Plant density, training, irrigation and fertilization were the same of the first experiment. Water salinities were 1.4 dS m-1 (S1), 3.0 dS m-1 (S2) and 5.3 dS m-1 (S3).
Seedlings were transplanted on 23 June 1999, and irrigation started at 19 DAT, with an average frequency and volume of 3.8 days and 0.144 L plant-1 day-1, respec-tively. Higher irrigation interval and lower water uptake by plants in relation to experiment 1 was due to the lower temperature in the autumn-winter period. Leaf measure-ments were performed at 35 DAT as for the non-grafted plants.
Comparison of the regression equations
Values of L, W and the product LW were plotted against LA and regression models were obtained for each water salinity level. Coefficients of determination (R2) and the standard errors (SE) were calculated and the equation that presented the highest R2 and the lowest SE was used in the estimations. The best equation obtained for each
Figure 1 -Diagram of cucumber leaf showing positions of length (L) and width (W) measurements.
treatment was used to estimate the LA of the other treat-ments of the same experiment, in order to evaluate the ability of the equation fitted with data from a specific water salinity in estimating the LA of the leaves coming from different salinity conditions.
Best equations obtained for experiment 1 and 2 were used to estimate LA of experiment 2 and 1, respec-tively, of the same treatment, in order to evaluate the ef-fects of the grafting on the estimative of leaf area. A lin-ear model (y = bx + a) was fitted, where y is the mea-sured leaf area (cm2), b is the slope, x is the predicted LA value and a the intercept.
RESULTS AND DISCUSSION
Equations obtained for estimating the LA of non-grafted and non-grafted cucumber are shown in Table 1. The equations that use only L had the lowest R2 values and the highest of SE, thus resulting in poor LA estimation when compared to those that use W or the product LW, for both experiments and all treatments. The best equa-tions were those that use LW, giving the highest R2
and lowest SE. Other authors also reported better relationships between LA and LW for several crops, such as strawberry (Strik & Proctor, 1985), safflowers (Sepaskhah, 1977), lettuce (Guo & Sun, 2001) and taro (Lu et al., 2004). In spite of the fact that these equations require more time
in determining LA because L and W should be measured, they were used in the analysis due to the high precision and low errors of the predictions.
Influence of irrigation water salinity on prediction of LA
Irrigation water salinity did not influence the leaf area estimations and the statistical coefficients were prac-tically the same when an equation obtained from a given salinity level was used to estimate the LA of leaves from other salinity levels (Table 2).
For non-grafted cucumber, the poorer prediction was that obtained with the Eq.(3) for leaves taken from S2 and S3 treatments, which resulted in an underestima-tion of LA of 2.5%, and Eq.(9) for S1, with an overesti-mation of 2.4%. Highest underestioveresti-mation for the grafted cucumber was that given by the Eq.(15), which was of 2.9% for estimating the LA of S3, and the highest over-estimation was 2.6% when Eq.(18) was used on S2.
The highest SE and lowest R2 of the estimations were obtained for S1 on both experiments. Leaf area of the leaves taken from S3 treatment for non-grafted cu-cumber and from S2 for grafted cucu-cumber were well pre-dicted by the equations fitted for others treatments and presented the lowest SE and highest R2
. Besides the fact that some estimates were less precise with higher over-or underestimation than others, all equations showed a
Table 1 - Equations for predicting cucumber leaf area (LA) from length (L), width (W) or the product LW and the corresponding coefficient of determination (R2) and standard error (SE) for non-grafted and grafted cucumber irrigated with water
of different salinities.
# Values of LA in cm2, L and W in cm.
p o r
C Water Salinity(S) Equation# Equationnumber R2 SE
m S
d -1
r e b m u c u c d e t f a r g -n o
N 1.0(S1) LA=38.15L- 333 Eq(1) 0.906 35.77
3 0 5 -W 2 . 8 3 = A
L Eq(2) 0.940 28.59
7 . 2 + W L 6 8 . 0 = A
L Eq(3) 0.978 26.40
) 2 S ( 2 .
3 LA=1.67L2- 23.23L+205 Eq(4) 0.909 42.76
9 3 4 -W 3 . 6 3 = A
L Eq(5) 0.970 25.41
5 . 3 -W L 5 8 8 . 0 = A
L Eq(6) 0.978 22.50
) 3 S ( 0 .
5 LA=1.672L2- 23.23 L+205 Eq(7) 0.978 29.00
W 8 7 6 . 0 = A
L 2+5.87W- 105 Eq(8) 0.976 25.94
4 4 . 2 3 -W L 3 4 9 . 0 = A
L Eq(9) 0.983 21.27
r e b m u c u c d e t f a r
G 1.4(S1) LA=1.16L2- 3.1L+11.6 Eq(10) 0.988 32.70
W 6 3 . 0 = A
L 2+11.92W- 88 Eq(11) 0.987 23.99
3 0 . 1 -W L 3 3 5 8 . 0 = A
L Eq(12) 0.991 15.89
) 2 S ( 0 .
3 LA=1.33L2- 8.85L+55.4 Eq(13) 0.993 34.79
9 8 1 -W 9 . 4 2 = A
L Eq(14) 0.987 19.74
5 7 . 2 + W L 4 8 . 0 = A
L Eq(15) 0.995 11.50
) 3 S ( 3 .
5 LA=1.08L2- 1.03L+4.7 Eq(16) 0.984 32.60
W 7 6 3 . 0 = A
L 2+12.2W- 87.6 Eq(17) 0.989 19.25
8 0 . 1 + W L 8 6 8 . 0 = A
good ability in estimating LA for any treatment. There-fore, the relation between L or W to LA was maintained practically the same, independently of the salinity of the irrigation water. Little differences of R2 or SE could also be attributed to the errors in the leaf L and W measure-ments.
Influence of grafting on prediction of LA
The best equation of each treatment of experi-ments 1 and 2 was used to estimate the LA of experiment 2 and 1, respectively. The linear model was forced to pass through the origin because the intercept was very close to zero. Thus a became zero and b indicated how much the estimations were above (b > 1) or bellow (b < 1) the measured LA values.
The equations fitted to data of the S2 treatment had the worst precision, which underestimated in 3.9% the LA of non-grafted cucumber and overestimated in 3.8% for grafted cucumber (Table 3). However, the SE and R2 were satisfactory and the discrepancies observed for b values were probably because the regression was
forced through the origin. In a general way, high R2 and low SE values of the estimations for both experiments in-dicated that the relation between L or W to LA was un-altered by grafting.
General equation for estimating LA
A common regression equation could be used to predict leaf area of non-grafted and grafted cucumber cv. ‘Hokushin’ under different levels of salinity, once both factors did not exercise effects on the relation between L or W to LA. Figure 2 shows the relations of L, W and LW with the measured leaf area and the regression tions for predicting LA from these variables. The equa-tion with LW as independent variable should be used due to the highest R2
and lowest SE in relation to the other. In addition, LA can be estimated only by multiplying the LW product by a constant of 0.88 and subtracting from 4.27, which make the estimation very simple to be used in the field. Equations with L or W as independent vari-ables also could be used, with some sacrifice in accuracy due to the higher SE.
) S ( y t i n i l a s r e t a W a e r a f a e l e h t e t a m i t s e o t d e s u n o i t a u q E r e b m u c u c d e t f a r g -n o N ) 3 ( q
E Eq(6) Eq(9)
E
S R2 b SE R2 b SE R2 b
m S
d -1 cm2 cm2 cm2
) 1 S ( 0 .
1 - - - 26.4 0.950 1.021 26.4 0.950 1.024
) 2 S ( 2 .
3 22.5 0.971 0.975 - - - 22.5 0.974 1.001
) 3 S ( 0 .
5 21.3 0.975 0.975 21.3 0.980 0.997 - -
-r e b m u c u c d e t f a r G ) 2 1 ( q
E Eq(15) Eq(18)
E
S R2 b SE R2 b SE R2 b
m
c 2 cm2 cm2
) 1 S ( 4 .
1 - - - 15.9 0.991 0.992 15.9 0.991 1.020
) 2 S ( 0 .
3 11.5 0.995 1.003 - - - 11.5 0.996 1.026
) 3 S ( 3 .
5 13.7 0.992 0.975 13.7 0.992 0.971 - -
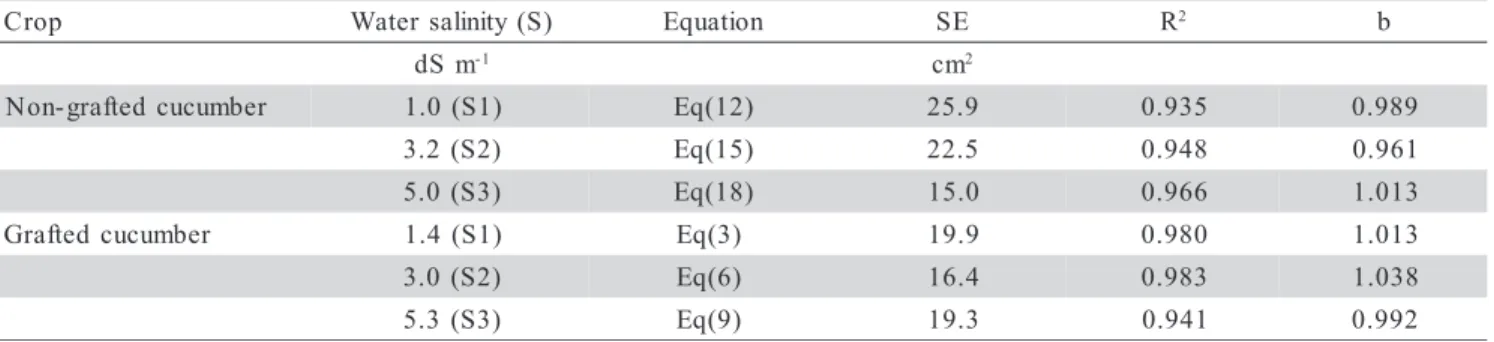
-Table 2 -Standard error (SE), coefficient of determination (R2) and linear regression slope (b) for the estimation of the leaf
area of non-grafted and grafted cucumber irrigated with water of different salinities, using the best equations developed for each treatment.
p o r
C Water salinity(S) Equation SE R2 b
m S
d -1 cm2
r e b m u c u c d e t f a r g -n o
N 1.0(S1) Eq(12) 25.9 0.935 0.989
) 2 S ( 2 .
3 Eq(15) 22.5 0.948 0.961
) 3 S ( 0 .
5 Eq(18) 15.0 0.966 1.013
r e b m u c u c d e t f a r
G 1.4(S1) Eq(3) 19.9 0.980 1.013
) 2 S ( 0 .
3 Eq(6) 16.4 0.983 1.038
) 3 S ( 3 .
5 Eq(9) 19.3 0.941 0.992
Table 3 - Standard error (SE), coefficient of determination (R2) and linear regression slope (b) for the estimation of the leaf
In North Carolina, USA, Robbins & Pharr (1987) found LA = 0.89LW – 20.58 (R2
= 0.98) for soil-grown Calypso cucumber, and no difference was found between this model and the models fitted for 14 soil-grown cu-cumber cultivars in field and greenhouse. Leaf area of ‘Hokushin’ cucumber measured in the present study was estimated by the model for Calipso cucumber (Robbins & Pharr, 1987) and an error of only 2.7% was found
(Fig-ure 3), which suggests that the relation between W or L to LA of soil-grown cucumber has only little differences between the cultivars, location and growing systems.
ACKNOWLEDGMENT
To FAPESP for financial support.
REFERENCES
ASTEGIANO, E.D.; FAVARO, J.C.; BOUZO, C.A. Estimación del area foliar en distintos cultivares de tomate (Lycopersicon esculentum Mill.) utilizando medidas foliares lineales. Investigación Agraria: Producción y Protección Vegetales, v.16, p.249-256, 2001. BLANCO, F.F.; FOLEGATTI, M.V.; NOGUEIRA, M.C.S. Fertirrigação
com água salina e seus efeitos na produção do pepino enxertado em ambiente protegido. Horticultura Brasileira, v.20, p.442-446, 2002. CHARTZOULAKIS, K.S. Photosynthesis, water relations and leaf growth
of cucumber exposed to salt stress. Scientia Horticulturae, v.59, p.27-35, 1994.
FOLEGATTI, M.V.; BLANCO, F.F. Desenvolvimento vegetativo do pepino enxertado irrigado com água salina. Scientia Agricola, v.57, p.451-457, 2000.
GUO, D.P.; SUN, Y.Z. Estimation of leaf area of stem lettuce (Lactuca sativa var angustana) from linear measurements. Indian Journal of Agricultural Sciences, v.71, p.483-486, 2001.
LU, H.Y.; LU, C.T.; WEI, M.L.; CHAN, L.F. Comparison of different models for nondestructive leaf area estimation in taro. Agronomy Journal, v.96, p.448-453, 2004.
ROBBINS, N.S.; PHARR, D.M. Leaf area prediction models for cucumber from linear measurements. HortScience, v.22, p.1264-1266, 1987. SEPASKHAH, A.R. Estimation of individual and total leaf areas of
safflowers. Agronomy Journal, v.69, p.783-785, 1977.
SILVA, N.F.; FERREIRA, F.A.; FONTES, P.C.R.; CARDOSO, A.A. Modelos para estimar a área foliar de abóbora por meio de medidas lineares. Revista Ceres, v.45, p.287-291, 1998.
STRIK, B.C.; PROCTOR, J.T.A. Estimating the area of trifoliolate and unequally imparipinnate leaves of strawberry. HortScience, v.20, p.1072-1074, 1985.
Figure 2 -General regression models for estimating the leaf area of non-grafted and grafted cucumber from leaf length (L), width (W) or the product LW. Each equation includes all treatments.
Figure 3 - Measured and estimated leaf area of ‘Hokushin’ cucumber using the model for ‘Calipso’ cucumber.
Received June 06, 2004 Accepted May 31, 2005 LA = 1.05L2 - 0.172L - 0.305
R2 = 0.979
SE = 27.26 cm2
0 200 400 600 800 1000
0 10 20 30
L (cm)
L
eaf
area (c
m
2 )
Grafted Non-grafted
LA = 0.727W2 + 0.083W - 2.72
R2 = 0.982
SE = 25.23 cm2
0 200 400 600 800 1000
0 10 20 30 40
W (cm)
Le
af
a
rea
(
c
m
2 )
Grafted
Non-grafted
LA = 0.88LW - 4.27 R2 = 0.989
SE = 19.75 cm2
0 200 400 600 800 1000
0 250 500 750 1000
LW (cm2)
L
eaf
ar
e
a (
c
m
2 )
Grafted
Non-grafted
y = 0.9726x R2 = 0.988
SE = 19.98 cm2
0 200 400 600 800 1000
0 250 500 750 1000
Measured (cm2)
E
s
ti
m
at
ed (
c
m