Hepatic damage during acute
pancreatitis in the rat
1Laboratório de Cirurgia do Aparelho Digestivo-LIM35,
Departamento de Gastroenterologia, Hospital das Clínicas, Faculdade de Medicina, Universidade de São Paulo, 05403-900 São Paulo, SP, Brasil
2Unidade de Hipertensão, INCOR, Faculdade de Medicina, Universidade de São Paulo,
05403-900 São Paulo, SP, Brasil A.M.M. Coelho1,
M.C.C. Machado1,
S.N. Sampietre1,
K.R.M. Leite1,
V.L.L. Oliveira2
and H.W. Pinotti1
Abstract
We studied the alterations in the metabolism of liver mitochondria in rats with acute pancreatitis. Male Wistar rats were allocated to a control group (group I) and to five other groups corresponding to 2, 4, 12, 24 and 48 h after the induction of acute pancreatitis by the injection of 5% sodium taurocholate into the pancreatic duct. Sham-operated animals were submitted to the same surgical steps except for the induction of acute pancreatitis. Mitochondrial oxidation and phospho-rylation were measured polarographically by determining oxygen consumption without ADP (basal respiration, state 4) and in the presence of ADP (activated respiration, state 3). Serum amylase, transaminases (ALT and AST) and protein were also determined. Ascitic fluid, contents of amylase, trypsin and total protein were also determined and arterial blood pressure was measured in all groups. In ascitic fluid, trypsin and amylase increased reaching a maximum at 2 and 4h, respectively. Serum amylase increased at 2 h reaching a maximum at 4 h. Serum transaminase levels increased at 12 and 24 h. After 2 h (and also 4 h) there was an increase in state 4 respiration (45.65 ± 1.79 vs 28.96 ± 1.50) and a decrease in respiration control rate
(3.53 ± 0.09 vs 4.45 ± 0.08) and in the ADP/O ratio (1.77 ± 0.02 vs 1.91
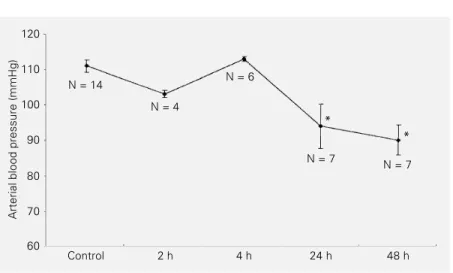
± 0.01) compared to controls (P<0.05). These results indicate a disruption of mitochondrial function, which recovered after 12 h. In the 48-h groups there was mitochondrial damage similar to that occurring in ischemic lesion. Beat-to-beat analysis (30 min) showed that arterial blood pressure remained normal up to 24 h (111 ± 3 mmHg) while a significant decrease occurred in the 48-h group (91 ± 4 mmHg). These data suggest biphasic damage in mitochondrial function in acute pancreatitis: an initial uncoupled phase, possibly secondary to enzyme activity, followed by a temporary recovery and then a late and final dysfunction, associated with arterial hypotension, possibly related to ischemic damage.
Correspondence
M.C.C. Machado Laboratório de Cirurgia do Aparelho Digestivo-LIM35 Hospital das Clínicas, FM, USP Rua Dr. Enéas C. Aguiar, 255 05403-900 São Paulo, SP Brasil
Publication supported by FAPESP.
Received October 1, 1996 Accepted June 30, 1997
Key words
•Acute pancreatitis
•Hepatic lesion
Introduction
Acute pancreatitis is known to produce morphologic and functional changes in the liver and is associated with a high mortality rate (1-3). Many experimental studies sug-gest that hepatic cells can be injured during acute pancreatitis due to pancreatic enzymes or kinins expected to enter the portal system (4). It has been shown that the pancreatitis-associated ascitic fluid depresses rat liver cell oxygen uptake (5-7).
In an attempt to characterize these alter-ations, an experimental model was devel-oped to investigate mitochondrial liver me-tabolism in rats with acute pancreatitis and the results were correlated with hemody-namic data, ascitic fluid composition and histological findings.
Material and Methods
Male Wistar rats weighing 220-270 g were used in all experiments. The animals were kept at 22-24°C on a 12-h light-dark cycle, and fasted for 16 h, with free access to water. Rats were allocated to a control group (without any operation) (group I, N = 14), and to one of five other (experimental) groups according to the time elapsed after acute pancreatitis (AP) induction: 2 h (group 2, N = 12), 4 h (group 4, N = 6), 12 h (group 12, N = 8), 24 h (group 24, N = 7), and 48 h (group 48, N = 7).
Acute pancreatitis was induced after lap-arotomy under ketamine chloride anesthesia (0.2 ml/100 g body weight). The main pan-creatic duct was cannulated transduodenally with a flexible catheter (Intracath, P50, Becton-Dickinson, Parsippany, NJ) and 0.5 ml of 5% sodium taurocholate in saline was infused at a constant rate. In order to direct the solution to the pancreatic duct a clamp was applied to the proximal part of the he-patic duct during injection (8,9). Sham-oper-ated groups were submitted to the same sur-gical steps as the experimental group except
for the induction of acute pancreatitis and the animals were sacrificed 2, 4, 12, 24 and 48 h after the surgical procedure.
The animals were killed by a blow to the head followed by exsanguination. Blood samples were collected from animals of all groups to measure serum aspartate ami-notransferase (AST), alanine aminotrans-ferase (ALT) (Technicon RA-1000 System), amylase (10) and total protein (11). Ascitic fluid was removed from the abdominal cav-ity with a syringe and placed in glass vessels and the volume was determined. The con-tents of free active trypsin and total trypsin after activation of trypsinogen by enteroki-nase (12,13), amylase and total protein were also determined.
Liver mitochondria were prepared as de-scribed in Ref. 7. Mitochondrial oxygen con-sumption was measured polarographically (14) using a Gilson 5/6H Oxygraph (Gilson Medical Electronics Inc., Middleton, WI) in a closed reaction vessel fitted with a Clark oxygen electrode (Yellow Springs
Instru-ments Co., Yellow Springs, OH) at 28oC.
The incubation medium consisted of 120 mM KCl, 2 mM sodium phosphate, 10 µM rotenone, and 1 mM EGTA, and was buff-ered at pH 7.1 with 5 mM Tris-HCl. Mito-chondria were energized with potassium suc-cinate as substrate at a final concentration of 10 mM. After a brief equilibration period, state 3 (activated state, S3) respiration was induced by the addition of 280 nmol adeno-sine diphosphate (ADP, Sigma Chemical Co., St. Louis, MO). After all the added ADP was phosphorylated to adenosine triphosphate (ATP), state 4 (basal state, S4) respiration was measured. The ratio of oxygen con-sumption in the presence of ADP to that in its absence (respiratory control rate, RCR) and the ADP/O ratio were calculated as indi-ces of oxidative and phosphorylative mito-chondrial function (15). RCR = oxygen con-sumption in state 3/oxygen concon-sumption in state 4.
per atom of oxygen consumed. State 3 and state 4 respiratory rates are reported as nano-gram atoms of oxygen per millinano-gram mito-chondrial protein per minute. Mitochondria protein content was determined by the method of Lowry et al. (11).
The femoral artery was cannulated 24 h before the induction of acute pancreatitis. Arterial blood pressure (ABP) was recorded in conscious, freely moving rats with the arterial cannula connected to a pressure trans-ducer (Statham P23Db, Hato Rey, PR) coupled to an amplifier (General Purpose Stemtech Inc., Winston, VA). Pulsatile arte-rial pressure was sampled at 120 Hz under basal conditions and 2, 4, 24 and 48 h after AP with an analog-to-digital converter and processed with a computer on a beat-to-beat basis (AT-CODAS), providing values of mean arterial pressure.
Liver and pancreas from four rats in each group were fixed in 10% formaldehyde and embedded in paraffin, and 5-6-µm sections were stained with hematoxylin-eosin (H+E).
Statistical analysis
The results are reported as means ± SD. The significance of the differences between the mean values was evaluated by analysis of variance (ANOVA).
Results
Blood and ascitic fluid
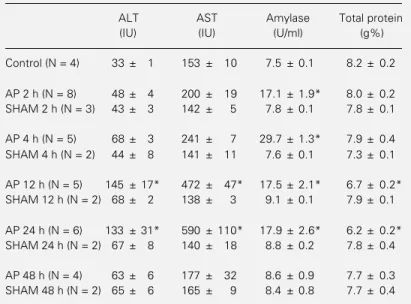
The animals showed increased serum transaminase levels 12 and 24 h after induc-tion of acute pancreatitis (Table 1). Serum amylase increased rapidly within the first 2 h, reached a maximum at 4 h, and then returned to basal levels at 48 h. Total serum protein content decreased 12 and 24 h after the induction of pancreatitis.
Free active trypsin, total trypsin and amy-lase in the ascitic fluid reached a maximum 2 h (4 h for amylase) after the induction of
acute pancreatitis and then decreased gradu-ally. The protein levels increased 24 and 48 h after induction of AP. The largest volume of ascitic fluid was observed 12 h after the induction of pancreatitis (Table 2).
Oxidation and phosphorylation of liver mitochondria
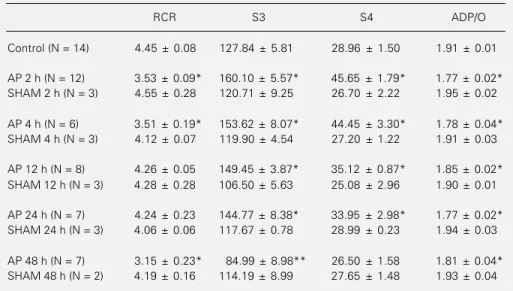
Table 3 shows the results of liver mito-chondrial function. After 2 and 4 h there was an increase in the oxygen consumption rate by liver mitochondria in S3 and S4, and a decrease in RCR and in the ADP/O ratio. At 12 and 24 h, RCR increased to normal levels while the other parameters remained un-changed. After 48 h of acute pancreatitis a significant reduction in RCR, state 3 respira-tion and ADP/O ratio was observed.
Arterial blood pressure
Blood pressure remained within normal levels at 2 h and 4 h (111 ± 3 mmHg) but significant hypotension was observed in all
Table 1 - Changes in serum alanine aminotransferase (ALT), aspartate ami-notransferase (AST), amylase and total protein in experimental acute pancreati-tis (AP).
Data are reported as means ± SD. *P<0.05 compared to control (analysis of variance).
ALT AST Amylase Total protein
(IU) (IU) (U/ml) (g%)
Control (N = 4) 33 ± 1 153 ± 10 7.5 ± 0.1 8.2 ± 0.2
AP 2 h (N = 8) 48 ± 4 200 ± 19 17.1 ± 1.9* 8.0 ± 0.2 SHAM 2 h (N = 3) 43 ± 3 142 ± 5 7.8 ± 0.1 7.8 ± 0.1
AP 4 h (N = 5) 68 ± 3 241 ± 7 29.7 ± 1.3* 7.9 ± 0.4 SHAM 4 h (N = 2) 44 ± 8 141 ± 11 7.6 ± 0.1 7.3 ± 0.1
AP 12 h (N = 5) 145 ± 17* 472 ± 47* 17.5 ± 2.1* 6.7 ± 0.2* SHAM 12 h (N = 2) 68 ± 2 138 ± 3 9.1 ± 0.1 7.9 ± 0.1
AP 24 h (N = 6) 133 ± 31* 590 ± 110* 17.9 ± 2.6* 6.2 ± 0.2* SHAM 24 h (N = 2) 67 ± 8 140 ± 18 8.8 ± 0.2 7.8 ± 0.4
animals at 24 and 48 h (91 ± 4 mmHg) (Figure 1).
Histological analysis
Acute pancreatitis with acinar necrosis, hemorrhage and edema was observed in all animals. Sinusoidal liver congestion and slight inflammation were observed at 2, 4 and 12 h. Necrosis and degenerative changes of hepatocytes were observed at 24 and 48 h (Figure 2).
Table 2 - Analysis of pancreatitis-associated ascitic fluid in rats.
Data are reported as means ± SD. *P<0.05 compared to other groups without asterisk; **P<0.05 compared to 2, 4, 12, 24 h (analysis of variance). U/ml Trypsin = µmol of substrate released per ml per min. U/ml Amylase = mg of substrate released per min per ml. AP = Acute pancreatitis.
Volume Activated Total Amylase Total
(ml) trypsin trypsin (U/ml) protein
(10-3 U/ml) (10-3 U/ml) (g%)
AP 2 h (N = 7) 3.9 ± 0.3 5.65 ± 0.87* 42.38 ± 9.1* 269 ± 25* 3.2 ± 0.2 AP 4 h (N = 5) 4.4 ± 1.3 4.37 ± 0.63* 29.22 ± 5.0* 304 ± 16* 2.0 ± 0.2
AP 12 h (N = 6) 9.6 ± 3.4* 2.00 ± 0.25 4.77 ± 0.7 124 ± 13 3.0 ± 0.2
AP 24 h (N = 7) 4.0 ± 0.9 0.95 ± 0.21 5.22 ± 0.9 81 ± 16 4.2 ± 0.2*
AP 48 h (N = 5) 2.4 ± 0.9 0.32 ± 0.10 2.27 ± 0.8 4 ± 1** 4.5 ± 0.2*
Table 3 - Oxidation and phosphorylation activities of mitochondria in experimental acute pancreatitis.
Data are reported as means ± SD. S3 and S4 = Oxygen consumption in ng atoms of O2 min-1 mg
protein-1; RCR = S3/S4. *P<0.05 compared to control and sham groups (analysis of variance);
**P<0.05 compared to control, AP 2, 4, 12, 24 h and sham groups (analysis of variance).
RCR S3 S4 ADP/O
Control (N = 14) 4.45 ± 0.08 127.84 ± 5.81 28.96 ± 1.50 1.91 ± 0.01
AP 2 h (N = 12) 3.53 ± 0.09* 160.10 ± 5.57* 45.65 ± 1.79* 1.77 ± 0.02* SHAM 2 h (N = 3) 4.55 ± 0.28 120.71 ± 9.25 26.70 ± 2.22 1.95 ± 0.02
AP 4 h (N = 6) 3.51 ± 0.19* 153.62 ± 8.07* 44.45 ± 3.30* 1.78 ± 0.04* SHAM 4 h (N = 3) 4.12 ± 0.07 119.90 ± 4.54 27.20 ± 1.22 1.91 ± 0.03
AP 12 h (N = 8) 4.26 ± 0.05 149.45 ± 3.87* 35.12 ± 0.87* 1.85 ± 0.02* SHAM 12 h (N = 3) 4.28 ± 0.28 106.50 ± 5.63 25.08 ± 2.96 1.90 ± 0.01
AP 24 h (N = 7) 4.24 ± 0.23 144.77 ± 8.38* 33.95 ± 2.98* 1.77 ± 0.02* SHAM 24 h (N = 3) 4.06 ± 0.06 117.67 ± 0.78 28.99 ± 0.23 1.94 ± 0.03
AP 48 h (N = 7) 3.15 ± 0.23* 84.99 ± 8.98** 26.50 ± 1.58 1.81 ± 0.04* SHAM 48 h (N = 2) 4.19 ± 0.16 114.19 ± 8.99 27.65 ± 1.48 1.93 ± 0.04
Discussion
mito-chondria 24 h after the induction of AP has been reported by others (21,22). These in-vestigators also observed a significant re-duction in mitochondrial function over a period of 2 days after the induction of AP (21). However, the early periods of acute pancreatitis were not evaluated in these stud-ies.
In the present study we observed increased levels of trypsin and amylase in the ascitic fluid in the early periods (2 and 4 h) after induction of acute pancreatitis (Table 2), suggesting that systemic absorption of toxic substances from the ascitic fluid may occur early after induction of AP, causing liver damage.
Our results demonstrate disruption of mi-tochondrial function early after induction of acute pancreatitis (Table 3). In the early
Figure 2 - Liver biopsy 48 h after induction of acute pancreatitis showing lobular focal necrosis and mononuclear inflammatory cell infiltrates. H+E. 400X.
Arterial blood pressure (mmHg)
120
110
100
90
80
70
60
Control 2 h 4 h 24 h 48 h
N = 14
N = 4
N = 6
N = 7
N = 7
* *
periods an uncoupling effect on mitochon-drial function was observed, together with decreases in RCR, an increase in state 4 respiration and a reduction in the ADP/O ratio. In this early phase (2 and 4 h) no significant changes in serum transaminases were observed (Table 1). After the 12-h period, however, an increasing depression of all parameters of mitochondrial respira-tory functions with decreased mitochondrial ATP synthesis was observed. Since biologi-cal functions depend on a source of high energy phosphate, its decrease may cause severe damage to hepatic cells. Actually, after the 12-h period we observed increased levels of serum AST and ALT indicating hepatic cellular damage. At 48 h after induc-tion of AP, a decrease in RCR, in state 3 respiration and in ADP/O ratio was observed, suggesting a degenerative and necrotizing process characteristic of cellular ischemia (Table 3).
Kitamura et al. (21) also demonstrated significant damage to mitochondrial func-tion 48 h after the inducfunc-tion of AP. In the present study, these alterations were associ-ated with a decrease in arterial blood pres-sure (Figure 1) and are consistent with the results of previous studies demonstrating depressed liver mitochondrial respiratory
function in response to shock and ischemia (26-28). Cell death may result from mito-chondrial respiratory dysfunction.
Thus, the present findings demonstrate a biphasic damage to liver mitochondrial func-tion in acute pancreatitis: an initial phase of uncoupling of oxidative phosphorylation and a late phase with damage to mitochondrial ATP synthesis. In the early phase of AP, the level of pancreatic enzymes in the ascitic fluid is high, suggesting that disruption of mitochondrial function during this period may be related to toxic substances released during this phase (5), followed by a tempo-rary and partial recovery (Table 3). In the late phase, mitochondrial dysfunction is as-sociated with arterial hypotension and prob-ably related to ischemic damage.
Further studies are needed to elucidate the different factors involved in the patho-physiology of AP, in particular the abnor-malities of liver mitochondrial function and to determine the appropriate treatment.
Acknowledgment
References
1. Fisher ER & McCloy D (1955). Hepatic lesions of acute hemorrhagic pancreatitis. Surgery, 37: 213-219.
2. Anderson MC (1966). Hepatic morpholo-gy and function: alterations associated with acute pancreatitis. Archives of Sur-gery, 92: 664-671.
3. Tuzhilin SA, Polsky AE & Dreiling DA (1975). Hepatic lesions in pancreatitis. Gastroenterology, 64: 108-114. 4. Hirano T, Manabe T & Tobe T (1992).
Impaired hepatic energy metabolism in acute pancreatitis: Protective effects of prostaglandin E2 and synthetic protease inhibitor ONO 3307. Journal of Surgical Research, 53: 238-244.
5. Pappas TN, Lesser MA, Ellison EC & Carey LC (1982). Pancreatitis associated ascitic fluid: effect on oxygen consump-tion of liver cells. Proceedings of the Soci-ety for Experimental Biology and Medi-cine,169: 438-444.
6. Coticchia JM, Lesser MA, Carey LC, Mayer AD & McMahon MG (1986). Peri-toneal fluid in acute pancreatitis blocks hepatic mitochondrial respiration. Sur-gery, 100: 850-856.
7. Bielecki JW, Dlugosz J, Pawlicka E & Gabryelewicz A (1989). The effect of pan-creatitis associated ascitic fluid on some functions of rat liver mitochondria. Inter-national Journal of Pancreatology, 5: 145-156.
8. Lankisch PG, Koop H, Winckler K, Folsch VR & Creutzfeld W (1977). Somatostatin therapy of acute experimental pancreati-tis. Gut, 18: 713-716.
9. Storck G (1971). Fat necrosis in acute pan-creatitis. Acta Chirurgica Scandinavica, 137 (Suppl 417): 1-36.
10. Jamieson AD, Pruitt KM & Caldwell RC (1969). An improved amylase assay. Jour-nal of Dental Research, 48: 483.
11. Lowry OH, Rosebrough NJ, Farr AL & Randall RJ (1951). Protein measurement with the Folin phenol reagent. Journal of Biological Chemistry, 193: 265-275. 12. Glazer G & Steer ML (1977).
Require-ments for activation of trypsinogen and chymotrypsinogen in rabbit pancreatic juice. Analytical Biochemistry, 77: 130-141.
13. Erlanger B, Kokowzky M & Cohen W (1961). The preparation and properties of two chromogenic substrates of trypsin. Archives of Biochemistry and Biophysics, 95: 271-278.
14. Estabrook K (1964). Mitochondrial respi-ratory control and the polarographic meas-urement of ADP/O ratios. In: Estabrook RW & Pullman ME (Editors), Methods in Enzymology. Academic Press, New York. 15. Chance B & Williams GR (1955). A simple and rapid assay of oxidative phosphoryla-tion. Nature, 175: 1120-1121.
16. Amundsen E, Ofstad E & Hangen PO (1968). Experimental acute pancreatitis in dogs. I. Hypotensive effect induced by pancreatic exudate. Scandinavian Journal of Gastroenterology, 3: 659-664. 17. Butler MR (1973). Abnormalities of liver
function in acute pancreatitis. Southern Medical Journal,6: 700-702.
18. Traverso WL, Pullos TG & Frey ChF (1983). Hemodynamic characterization of porcine hemorrhagic pancreatitis ascitic fluid. Journal of Surgical Research, 34: 254-262.
19. Ellison EC, Pappas TN, Johnson JA, Fabri PJ & Carey LC (1981). Demonstration and characterization of hemoconcentration ef-fect of ascitic fluid that accumulates dur-ing hemorrhagic pancreatitis. Journal of SurgicalResearch, 30: 241-248. 20. Frey ChF, Wong HN, Hicman D & Pullos T
(1982). Toxicity of hemorrhagic ascitic fluid associated with hemorrhagic pancre-atitis. Archives of Surgery, 117: 401-404.
21. Kitamura O, Ozawa K & Honjo I (1973). Alterations of liver metabolism associated with experimental acute pancreatitis. American Journal of Surgery, 126: 379-382.
22. Lu-nan Y, Ozawa O & Kobayashi N (1992). Changes in hepatic energy metabolism in experimental acute pancreatitis. Chinese Medical Journal, 105: 684-688.
23. Akopian LA, Gabriélian NA, Kanaian AS, Karalova EM & Magakian IA (1994). The morphofunctional changes in the hepato-cytes of rats with experimental acute pan-creatitis. Tsitologiia, 36: 829-836. 24. Poplawski C, Dlugosz JW, Gabryelewicz
A, Pawlicka E, Wroblewski E & Adrzejew-ska A (1996). Hepatic mitochondrial and lysosomal alterations in acute experimen-tal pancreatitis with ethanolic coetiology in rats. Digestive Diseases and Sciences, 41: 139-148.
25. Dlugosz JW, Poplawski C, Pawlicka E, Wroblewski E & Gabryelewicz A (1996). The effect of tilsuprost on the liver mito-chondria in taurocholate pancreatitis in rats with antecedent acute ethanol abuse. Life Sciences, 59: 1297-1306.
26. Mittnacht Jr S, Sherman SC & Farber JL (1979). Reversal of ischemic mitochon-drial dysfunction. Journal of Biological Chemistry, 254: 9871-9879.
27. Townsed MD, Yokun MD & Fry DE (1987). Hepatic microsomal adenosine triphos-phatase and mitochondrial function. Ar-chives of Surgery, 122: 813-816. 28. Iwata S, Tanaka A & Ozawa K (1992).